
Key Insights
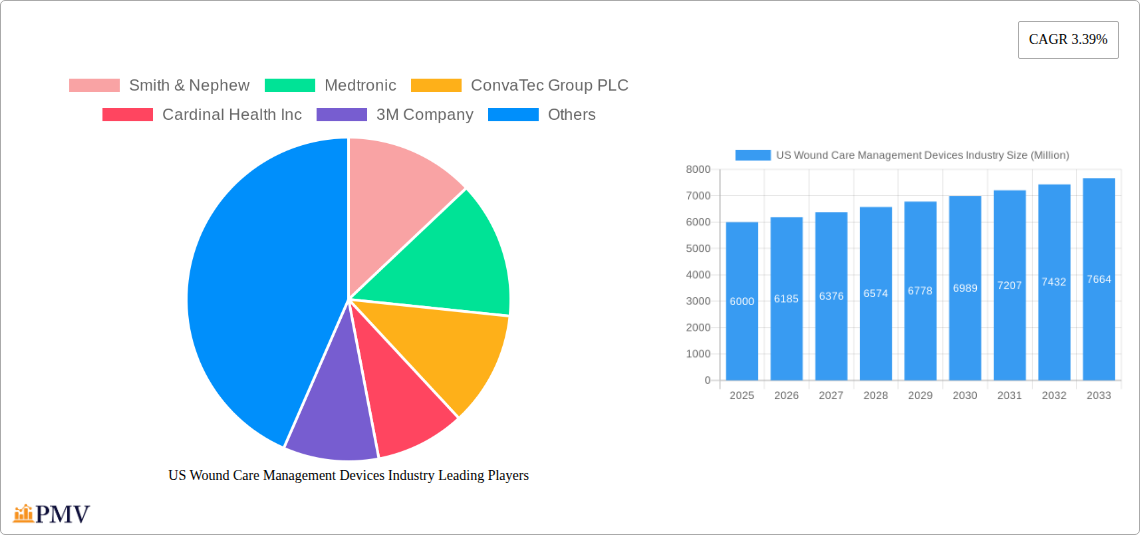
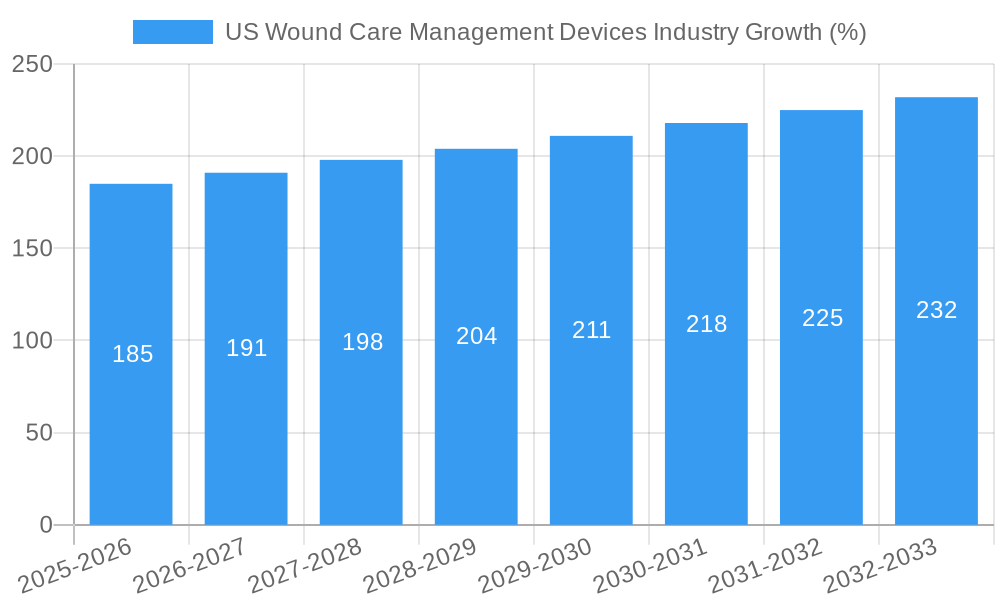
The US wound care management devices market, valued at approximately $6 billion in 2025, is projected to experience steady growth, driven by an aging population, increasing prevalence of chronic diseases like diabetes and obesity leading to higher rates of chronic wounds, and advancements in wound care technologies. The market's Compound Annual Growth Rate (CAGR) of 3.39% from 2025 to 2033 indicates a consistent expansion, albeit a moderate one, reflecting the inherent complexities and varied treatment pathways within the wound care landscape. Major market segments include chronic wound care (which holds the largest share due to the high prevalence and prolonged treatment periods of conditions like diabetic foot ulcers and pressure ulcers) and acute wound care, with product categories encompassing advanced wound dressings, negative pressure wound therapy (NPWT) systems, and other specialized devices. Key players like Smith & Nephew, Medtronic, and Johnson & Johnson are actively engaged in research and development, striving to introduce innovative products and improve existing technologies to enhance patient outcomes and market penetration.
Growth is further facilitated by the rising adoption of minimally invasive procedures, increased demand for effective and cost-efficient treatment options, and growing awareness among healthcare professionals about the benefits of advanced wound care. However, the market faces certain challenges including high treatment costs, particularly for advanced technologies like NPWT, and the need for skilled healthcare professionals to effectively use these devices. Furthermore, reimbursement policies and regulatory approvals can influence market dynamics. Despite these restraints, the long-term outlook for the US wound care management devices market remains positive, fueled by consistent technological improvements, an expanding elderly population, and a greater emphasis on preventative care and improved patient outcomes. Future growth will likely be influenced by the development of innovative solutions, personalized medicine approaches, and the increasing integration of telehealth in wound care management.
US Wound Care Management Devices Industry Report: 2019-2033
This comprehensive report provides an in-depth analysis of the US Wound Care Management Devices industry, covering market size, growth drivers, competitive landscape, and future outlook. The study period spans 2019-2033, with 2025 serving as the base and estimated year. The forecast period is 2025-2033, and the historical period encompasses 2019-2024. Key players like Smith & Nephew, Medtronic, ConvaTec Group PLC, and others are analyzed for their market share, strategies, and innovations. This report is crucial for businesses, investors, and stakeholders seeking to understand this dynamic market.
US Wound Care Management Devices Industry Market Structure & Competitive Dynamics
The US wound care management devices market is characterized by a moderately concentrated structure with several major players holding significant market share. Smith & Nephew, Medtronic, and ConvaTec Group PLC are among the leading companies, competing based on product innovation, technological advancements, and distribution networks. The market exhibits a dynamic innovation ecosystem, with ongoing research and development focused on advanced wound dressings, negative pressure wound therapy (NPWT) systems, and bioengineered skin substitutes. The regulatory framework, primarily overseen by the FDA, plays a critical role in shaping product approvals and market access. Existing products face competition from substitutes such as traditional wound care methods, but technological advancements constantly redefine the competitive landscape. End-user trends, particularly the increasing prevalence of chronic wounds and the growing demand for improved wound healing outcomes, drive market growth.
The industry has witnessed several mergers and acquisitions (M&A) in recent years, although the total value of these deals fluctuates annually. For example, in 2022, M&A activity resulted in an estimated xx Million in deal value, reflecting consolidation and strategic expansion within the sector. Market share data for key players is dynamic; however, the top three companies likely hold a combined share of approximately xx%.
US Wound Care Management Devices Industry Industry Trends & Insights
The US wound care management devices market is experiencing substantial growth, driven by a multitude of factors. The aging population is a key driver, with a consequent increase in the prevalence of chronic wounds like diabetic ulcers and pressure injuries. Technological advancements are also fueling market expansion, with innovations such as advanced dressings, bioengineered skin substitutes, and NPWT systems leading to improved treatment outcomes and patient comfort. Consumer preferences are shifting towards minimally invasive procedures and faster healing times, pushing manufacturers to focus on developing products that meet these demands. The highly competitive market encourages ongoing innovation and the development of more effective and efficient wound care solutions. The CAGR for the forecast period (2025-2033) is projected at xx%, indicating a consistently expanding market. Market penetration of advanced technologies, such as NPWT, is gradually increasing, although still varies significantly by healthcare setting and access to these advanced therapies.
Dominant Markets & Segments in US Wound Care Management Devices Industry
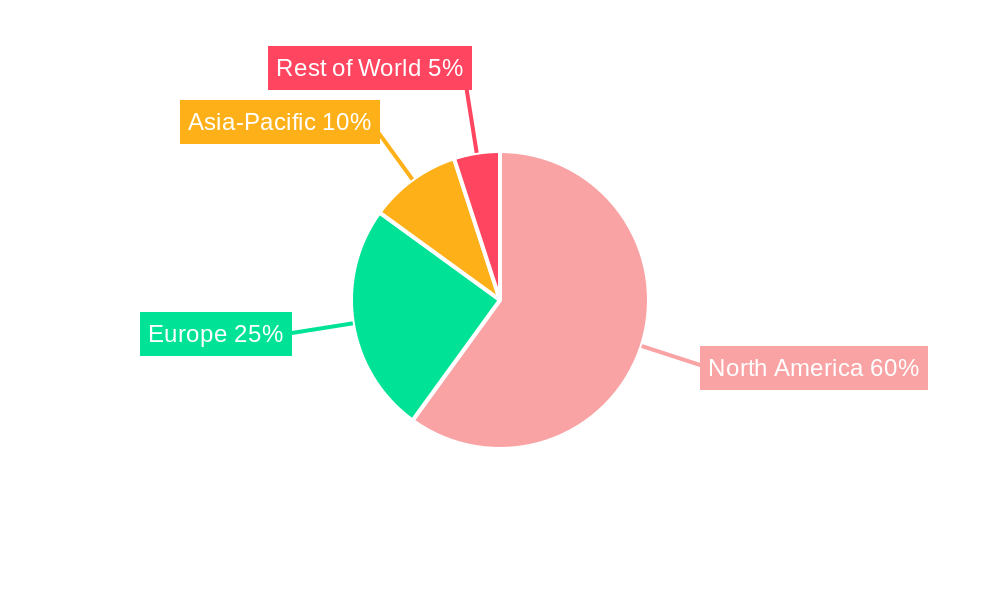
The market exhibits strong regional variations within the United States. The highest demand centers around regions with higher aging populations and prevalent chronic illnesses, including the South and Northeast.
Wound Type: Chronic wounds represent the largest segment, driven by the high prevalence of diabetes, obesity, and vascular diseases. The increase in the prevalence of these diseases translates into a significant and consistent demand for effective wound care solutions. Acute wounds, while less prevalent, still account for a substantial portion of the market due to the immediate and urgent need for effective treatment in settings like hospitals and emergency rooms.
Product: Wound care dressings dominate the product segment, representing a majority of the market revenue. Other wound care products, such as NPWT systems and bioengineered skin substitutes, represent a growing segment. The growth is propelled by the rising demand for enhanced treatment efficacy and reduced healthcare costs associated with these technologies. Key drivers for the dominant segments include increased healthcare expenditure, improved healthcare infrastructure, and government initiatives supporting improved wound care.
US Wound Care Management Devices Industry Product Innovations
Recent years have witnessed significant advancements in wound care management devices. The development of advanced dressings with enhanced antimicrobial properties and improved moisture retention capabilities significantly enhances wound healing. Similarly, NPWT systems have evolved, incorporating features such as automated pressure control and improved portability. Bioengineered skin substitutes provide advanced solutions for the treatment of severe wounds. These innovations cater to the need for effective and efficient wound management, improving patient outcomes and reducing healthcare costs.
Report Segmentation & Scope
The US Wound Care Management Devices Industry report segments the market based on wound type (chronic and acute) and product type (wound care dressings, NPWT systems, other wound care products). The chronic wound segment is projected to grow at a CAGR of xx% during the forecast period, driven by the rising prevalence of chronic diseases. The acute wound segment is expected to grow at a CAGR of xx%, fueled by advances in surgical procedures and trauma care. Within product categories, the wound dressings segment holds a significant share, while NPWT and other advanced products are experiencing higher growth rates. The competitive landscape within each segment is marked by intense rivalry, prompting innovation and the adoption of various marketing strategies.
Key Drivers of US Wound Care Management Devices Industry Growth
Several factors contribute to the growth of the US wound care management devices market. These include the aging population resulting in a higher incidence of chronic wounds, technological advancements leading to more effective treatment options, and the rising healthcare expenditure allowing for greater access to advanced wound care products and treatments. Additionally, increased awareness about wound care among healthcare professionals and patients fuels demand for improved solutions. Government initiatives promoting preventative care and improved wound management further accelerate market growth.
Challenges in the US Wound Care Management Devices Industry Sector
Despite substantial growth, the US wound care management devices market faces certain challenges. Stringent regulatory requirements for device approval can delay product launches and increase development costs. Supply chain disruptions can impact the availability and pricing of raw materials and finished goods. The highly competitive market creates pressure on profit margins, necessitating the need for sustained innovation. The high cost of advanced technologies also poses a barrier to widespread adoption and accessibility for a significant portion of the population.
Leading Players in the US Wound Care Management Devices Industry Market
- Smith & Nephew
- Medtronic
- ConvaTec Group PLC
- Cardinal Health Inc
- 3M Company
- Johnson & Johnson
- Organogenesis Inc
- Teleflex Incorporated
- B. Braun SE
- Medline Industries Inc
- Coloplast Corp
- Integra Lifesciences
Key Developments in US Wound Care Management Devices Industry Sector
January 2023: Convatec launched ConvaFoam, a family of advanced foam dressings designed for various wound types. This launch expands Convatec's product portfolio and enhances its market competitiveness.
April 2023: 3M Health Care's 3M Veraflo Therapy received FDA clearance for hydromechanical removal of infectious materials, expanding its capabilities and offering a novel approach to wound debridement.
Strategic US Wound Care Management Devices Industry Market Outlook
The future of the US wound care management devices market appears promising, driven by continuous technological innovation, a growing elderly population, and a rising prevalence of chronic wounds. Strategic opportunities exist for companies focused on developing innovative products that address unmet needs, such as personalized wound care solutions and improved patient adherence. Expanding distribution channels and focusing on strategic partnerships within the healthcare system are also crucial for success in this competitive landscape. The market is poised for continued expansion, offering substantial growth potential for companies that can adapt to evolving market dynamics and deliver high-quality, effective wound care solutions.
US Wound Care Management Devices Industry Segmentation
-
1. Product
-
1.1. Wound Care
- 1.1.1. Dressings
- 1.1.2. Wound Care Devices
- 1.1.3. Topical Agents
- 1.1.4. Other Wound Care Products
-
1.2. Wound Closure
- 1.2.1. Suture
- 1.2.2. Surgical Staplers
- 1.2.3. Tissue Adhesive, Strips, Sealant, and Glue
-
1.1. Wound Care
-
2. Wound Type
-
2.1. Chronic Wound
- 2.1.1. Diabetic Foot Ulcer
- 2.1.2. Pressure Ulcer
- 2.1.3. Venous Ulcer
- 2.1.4. Other Chronic Wounds
-
2.2. Acute Wound
- 2.2.1. Surgical Wounds
- 2.2.2. Burns
- 2.2.3. Other Acute Wounds
-
2.1. Chronic Wound
US Wound Care Management Devices Industry Segmentation By Geography
-
1. North America
- 1.1. United States
- 1.2. Canada
- 1.3. Mexico
-
2. South America
- 2.1. Brazil
- 2.2. Argentina
- 2.3. Rest of South America
-
3. Europe
- 3.1. United Kingdom
- 3.2. Germany
- 3.3. France
- 3.4. Italy
- 3.5. Spain
- 3.6. Russia
- 3.7. Benelux
- 3.8. Nordics
- 3.9. Rest of Europe
-
4. Middle East & Africa
- 4.1. Turkey
- 4.2. Israel
- 4.3. GCC
- 4.4. North Africa
- 4.5. South Africa
- 4.6. Rest of Middle East & Africa
-
5. Asia Pacific
- 5.1. China
- 5.2. India
- 5.3. Japan
- 5.4. South Korea
- 5.5. ASEAN
- 5.6. Oceania
- 5.7. Rest of Asia Pacific
US Wound Care Management Devices Industry REPORT HIGHLIGHTS
| Aspects | Details |
|---|---|
| Study Period | 2019-2033 |
| Base Year | 2024 |
| Estimated Year | 2025 |
| Forecast Period | 2025-2033 |
| Historical Period | 2019-2024 |
| Growth Rate | CAGR of 3.39% from 2019-2033 |
| Segmentation |
|
Table of Contents
- 1. Introduction
- 1.1. Research Scope
- 1.2. Market Segmentation
- 1.3. Research Methodology
- 1.4. Definitions and Assumptions
- 2. Executive Summary
- 2.1. Introduction
- 3. Market Dynamics
- 3.1. Introduction
- 3.2. Market Drivers
- 3.2.1 Increasing Incidences of Chronic Wounds
- 3.2.2 Ulcers and Diabetic Ulcers; Increase in the Number of Surgical Procedures; Rising Aging Population
- 3.3. Market Restrains
- 3.3.1. Concerns with Stringent Regulations and Reimbursement Policies; High Treatment Costs
- 3.4. Market Trends
- 3.4.1. Sutures Segment is Expected to Grow Significantly Over the Forecast Period
- 4. Market Factor Analysis
- 4.1. Porters Five Forces
- 4.2. Supply/Value Chain
- 4.3. PESTEL analysis
- 4.4. Market Entropy
- 4.5. Patent/Trademark Analysis
- 5. Global US Wound Care Management Devices Industry Analysis, Insights and Forecast, 2019-2031
- 5.1. Market Analysis, Insights and Forecast - by Product
- 5.1.1. Wound Care
- 5.1.1.1. Dressings
- 5.1.1.2. Wound Care Devices
- 5.1.1.3. Topical Agents
- 5.1.1.4. Other Wound Care Products
- 5.1.2. Wound Closure
- 5.1.2.1. Suture
- 5.1.2.2. Surgical Staplers
- 5.1.2.3. Tissue Adhesive, Strips, Sealant, and Glue
- 5.1.1. Wound Care
- 5.2. Market Analysis, Insights and Forecast - by Wound Type
- 5.2.1. Chronic Wound
- 5.2.1.1. Diabetic Foot Ulcer
- 5.2.1.2. Pressure Ulcer
- 5.2.1.3. Venous Ulcer
- 5.2.1.4. Other Chronic Wounds
- 5.2.2. Acute Wound
- 5.2.2.1. Surgical Wounds
- 5.2.2.2. Burns
- 5.2.2.3. Other Acute Wounds
- 5.2.1. Chronic Wound
- 5.3. Market Analysis, Insights and Forecast - by Region
- 5.3.1. North America
- 5.3.2. South America
- 5.3.3. Europe
- 5.3.4. Middle East & Africa
- 5.3.5. Asia Pacific
- 5.1. Market Analysis, Insights and Forecast - by Product
- 6. North America US Wound Care Management Devices Industry Analysis, Insights and Forecast, 2019-2031
- 6.1. Market Analysis, Insights and Forecast - by Product
- 6.1.1. Wound Care
- 6.1.1.1. Dressings
- 6.1.1.2. Wound Care Devices
- 6.1.1.3. Topical Agents
- 6.1.1.4. Other Wound Care Products
- 6.1.2. Wound Closure
- 6.1.2.1. Suture
- 6.1.2.2. Surgical Staplers
- 6.1.2.3. Tissue Adhesive, Strips, Sealant, and Glue
- 6.1.1. Wound Care
- 6.2. Market Analysis, Insights and Forecast - by Wound Type
- 6.2.1. Chronic Wound
- 6.2.1.1. Diabetic Foot Ulcer
- 6.2.1.2. Pressure Ulcer
- 6.2.1.3. Venous Ulcer
- 6.2.1.4. Other Chronic Wounds
- 6.2.2. Acute Wound
- 6.2.2.1. Surgical Wounds
- 6.2.2.2. Burns
- 6.2.2.3. Other Acute Wounds
- 6.2.1. Chronic Wound
- 6.1. Market Analysis, Insights and Forecast - by Product
- 7. South America US Wound Care Management Devices Industry Analysis, Insights and Forecast, 2019-2031
- 7.1. Market Analysis, Insights and Forecast - by Product
- 7.1.1. Wound Care
- 7.1.1.1. Dressings
- 7.1.1.2. Wound Care Devices
- 7.1.1.3. Topical Agents
- 7.1.1.4. Other Wound Care Products
- 7.1.2. Wound Closure
- 7.1.2.1. Suture
- 7.1.2.2. Surgical Staplers
- 7.1.2.3. Tissue Adhesive, Strips, Sealant, and Glue
- 7.1.1. Wound Care
- 7.2. Market Analysis, Insights and Forecast - by Wound Type
- 7.2.1. Chronic Wound
- 7.2.1.1. Diabetic Foot Ulcer
- 7.2.1.2. Pressure Ulcer
- 7.2.1.3. Venous Ulcer
- 7.2.1.4. Other Chronic Wounds
- 7.2.2. Acute Wound
- 7.2.2.1. Surgical Wounds
- 7.2.2.2. Burns
- 7.2.2.3. Other Acute Wounds
- 7.2.1. Chronic Wound
- 7.1. Market Analysis, Insights and Forecast - by Product
- 8. Europe US Wound Care Management Devices Industry Analysis, Insights and Forecast, 2019-2031
- 8.1. Market Analysis, Insights and Forecast - by Product
- 8.1.1. Wound Care
- 8.1.1.1. Dressings
- 8.1.1.2. Wound Care Devices
- 8.1.1.3. Topical Agents
- 8.1.1.4. Other Wound Care Products
- 8.1.2. Wound Closure
- 8.1.2.1. Suture
- 8.1.2.2. Surgical Staplers
- 8.1.2.3. Tissue Adhesive, Strips, Sealant, and Glue
- 8.1.1. Wound Care
- 8.2. Market Analysis, Insights and Forecast - by Wound Type
- 8.2.1. Chronic Wound
- 8.2.1.1. Diabetic Foot Ulcer
- 8.2.1.2. Pressure Ulcer
- 8.2.1.3. Venous Ulcer
- 8.2.1.4. Other Chronic Wounds
- 8.2.2. Acute Wound
- 8.2.2.1. Surgical Wounds
- 8.2.2.2. Burns
- 8.2.2.3. Other Acute Wounds
- 8.2.1. Chronic Wound
- 8.1. Market Analysis, Insights and Forecast - by Product
- 9. Middle East & Africa US Wound Care Management Devices Industry Analysis, Insights and Forecast, 2019-2031
- 9.1. Market Analysis, Insights and Forecast - by Product
- 9.1.1. Wound Care
- 9.1.1.1. Dressings
- 9.1.1.2. Wound Care Devices
- 9.1.1.3. Topical Agents
- 9.1.1.4. Other Wound Care Products
- 9.1.2. Wound Closure
- 9.1.2.1. Suture
- 9.1.2.2. Surgical Staplers
- 9.1.2.3. Tissue Adhesive, Strips, Sealant, and Glue
- 9.1.1. Wound Care
- 9.2. Market Analysis, Insights and Forecast - by Wound Type
- 9.2.1. Chronic Wound
- 9.2.1.1. Diabetic Foot Ulcer
- 9.2.1.2. Pressure Ulcer
- 9.2.1.3. Venous Ulcer
- 9.2.1.4. Other Chronic Wounds
- 9.2.2. Acute Wound
- 9.2.2.1. Surgical Wounds
- 9.2.2.2. Burns
- 9.2.2.3. Other Acute Wounds
- 9.2.1. Chronic Wound
- 9.1. Market Analysis, Insights and Forecast - by Product
- 10. Asia Pacific US Wound Care Management Devices Industry Analysis, Insights and Forecast, 2019-2031
- 10.1. Market Analysis, Insights and Forecast - by Product
- 10.1.1. Wound Care
- 10.1.1.1. Dressings
- 10.1.1.2. Wound Care Devices
- 10.1.1.3. Topical Agents
- 10.1.1.4. Other Wound Care Products
- 10.1.2. Wound Closure
- 10.1.2.1. Suture
- 10.1.2.2. Surgical Staplers
- 10.1.2.3. Tissue Adhesive, Strips, Sealant, and Glue
- 10.1.1. Wound Care
- 10.2. Market Analysis, Insights and Forecast - by Wound Type
- 10.2.1. Chronic Wound
- 10.2.1.1. Diabetic Foot Ulcer
- 10.2.1.2. Pressure Ulcer
- 10.2.1.3. Venous Ulcer
- 10.2.1.4. Other Chronic Wounds
- 10.2.2. Acute Wound
- 10.2.2.1. Surgical Wounds
- 10.2.2.2. Burns
- 10.2.2.3. Other Acute Wounds
- 10.2.1. Chronic Wound
- 10.1. Market Analysis, Insights and Forecast - by Product
- 11. Competitive Analysis
- 11.1. Global Market Share Analysis 2024
- 11.2. Company Profiles
- 11.2.1 Smith & Nephew
- 11.2.1.1. Overview
- 11.2.1.2. Products
- 11.2.1.3. SWOT Analysis
- 11.2.1.4. Recent Developments
- 11.2.1.5. Financials (Based on Availability)
- 11.2.2 Medtronic
- 11.2.2.1. Overview
- 11.2.2.2. Products
- 11.2.2.3. SWOT Analysis
- 11.2.2.4. Recent Developments
- 11.2.2.5. Financials (Based on Availability)
- 11.2.3 ConvaTec Group PLC
- 11.2.3.1. Overview
- 11.2.3.2. Products
- 11.2.3.3. SWOT Analysis
- 11.2.3.4. Recent Developments
- 11.2.3.5. Financials (Based on Availability)
- 11.2.4 Cardinal Health Inc
- 11.2.4.1. Overview
- 11.2.4.2. Products
- 11.2.4.3. SWOT Analysis
- 11.2.4.4. Recent Developments
- 11.2.4.5. Financials (Based on Availability)
- 11.2.5 3M Company
- 11.2.5.1. Overview
- 11.2.5.2. Products
- 11.2.5.3. SWOT Analysis
- 11.2.5.4. Recent Developments
- 11.2.5.5. Financials (Based on Availability)
- 11.2.6 Johnson and Johnson
- 11.2.6.1. Overview
- 11.2.6.2. Products
- 11.2.6.3. SWOT Analysis
- 11.2.6.4. Recent Developments
- 11.2.6.5. Financials (Based on Availability)
- 11.2.7 Organogenesis Inc
- 11.2.7.1. Overview
- 11.2.7.2. Products
- 11.2.7.3. SWOT Analysis
- 11.2.7.4. Recent Developments
- 11.2.7.5. Financials (Based on Availability)
- 11.2.8 Teleflex Incorporated
- 11.2.8.1. Overview
- 11.2.8.2. Products
- 11.2.8.3. SWOT Analysis
- 11.2.8.4. Recent Developments
- 11.2.8.5. Financials (Based on Availability)
- 11.2.9 B Braun SE
- 11.2.9.1. Overview
- 11.2.9.2. Products
- 11.2.9.3. SWOT Analysis
- 11.2.9.4. Recent Developments
- 11.2.9.5. Financials (Based on Availability)
- 11.2.10 Medline Industries Inc
- 11.2.10.1. Overview
- 11.2.10.2. Products
- 11.2.10.3. SWOT Analysis
- 11.2.10.4. Recent Developments
- 11.2.10.5. Financials (Based on Availability)
- 11.2.11 Coloplast Corp
- 11.2.11.1. Overview
- 11.2.11.2. Products
- 11.2.11.3. SWOT Analysis
- 11.2.11.4. Recent Developments
- 11.2.11.5. Financials (Based on Availability)
- 11.2.12 Integra Lifesciences
- 11.2.12.1. Overview
- 11.2.12.2. Products
- 11.2.12.3. SWOT Analysis
- 11.2.12.4. Recent Developments
- 11.2.12.5. Financials (Based on Availability)
- 11.2.1 Smith & Nephew
List of Figures
- Figure 1: Global US Wound Care Management Devices Industry Revenue Breakdown (Million, %) by Region 2024 & 2032
- Figure 2: Global US Wound Care Management Devices Industry Volume Breakdown (K Unit, %) by Region 2024 & 2032
- Figure 3: United states US Wound Care Management Devices Industry Revenue (Million), by Country 2024 & 2032
- Figure 4: United states US Wound Care Management Devices Industry Volume (K Unit), by Country 2024 & 2032
- Figure 5: United states US Wound Care Management Devices Industry Revenue Share (%), by Country 2024 & 2032
- Figure 6: United states US Wound Care Management Devices Industry Volume Share (%), by Country 2024 & 2032
- Figure 7: North America US Wound Care Management Devices Industry Revenue (Million), by Product 2024 & 2032
- Figure 8: North America US Wound Care Management Devices Industry Volume (K Unit), by Product 2024 & 2032
- Figure 9: North America US Wound Care Management Devices Industry Revenue Share (%), by Product 2024 & 2032
- Figure 10: North America US Wound Care Management Devices Industry Volume Share (%), by Product 2024 & 2032
- Figure 11: North America US Wound Care Management Devices Industry Revenue (Million), by Wound Type 2024 & 2032
- Figure 12: North America US Wound Care Management Devices Industry Volume (K Unit), by Wound Type 2024 & 2032
- Figure 13: North America US Wound Care Management Devices Industry Revenue Share (%), by Wound Type 2024 & 2032
- Figure 14: North America US Wound Care Management Devices Industry Volume Share (%), by Wound Type 2024 & 2032
- Figure 15: North America US Wound Care Management Devices Industry Revenue (Million), by Country 2024 & 2032
- Figure 16: North America US Wound Care Management Devices Industry Volume (K Unit), by Country 2024 & 2032
- Figure 17: North America US Wound Care Management Devices Industry Revenue Share (%), by Country 2024 & 2032
- Figure 18: North America US Wound Care Management Devices Industry Volume Share (%), by Country 2024 & 2032
- Figure 19: South America US Wound Care Management Devices Industry Revenue (Million), by Product 2024 & 2032
- Figure 20: South America US Wound Care Management Devices Industry Volume (K Unit), by Product 2024 & 2032
- Figure 21: South America US Wound Care Management Devices Industry Revenue Share (%), by Product 2024 & 2032
- Figure 22: South America US Wound Care Management Devices Industry Volume Share (%), by Product 2024 & 2032
- Figure 23: South America US Wound Care Management Devices Industry Revenue (Million), by Wound Type 2024 & 2032
- Figure 24: South America US Wound Care Management Devices Industry Volume (K Unit), by Wound Type 2024 & 2032
- Figure 25: South America US Wound Care Management Devices Industry Revenue Share (%), by Wound Type 2024 & 2032
- Figure 26: South America US Wound Care Management Devices Industry Volume Share (%), by Wound Type 2024 & 2032
- Figure 27: South America US Wound Care Management Devices Industry Revenue (Million), by Country 2024 & 2032
- Figure 28: South America US Wound Care Management Devices Industry Volume (K Unit), by Country 2024 & 2032
- Figure 29: South America US Wound Care Management Devices Industry Revenue Share (%), by Country 2024 & 2032
- Figure 30: South America US Wound Care Management Devices Industry Volume Share (%), by Country 2024 & 2032
- Figure 31: Europe US Wound Care Management Devices Industry Revenue (Million), by Product 2024 & 2032
- Figure 32: Europe US Wound Care Management Devices Industry Volume (K Unit), by Product 2024 & 2032
- Figure 33: Europe US Wound Care Management Devices Industry Revenue Share (%), by Product 2024 & 2032
- Figure 34: Europe US Wound Care Management Devices Industry Volume Share (%), by Product 2024 & 2032
- Figure 35: Europe US Wound Care Management Devices Industry Revenue (Million), by Wound Type 2024 & 2032
- Figure 36: Europe US Wound Care Management Devices Industry Volume (K Unit), by Wound Type 2024 & 2032
- Figure 37: Europe US Wound Care Management Devices Industry Revenue Share (%), by Wound Type 2024 & 2032
- Figure 38: Europe US Wound Care Management Devices Industry Volume Share (%), by Wound Type 2024 & 2032
- Figure 39: Europe US Wound Care Management Devices Industry Revenue (Million), by Country 2024 & 2032
- Figure 40: Europe US Wound Care Management Devices Industry Volume (K Unit), by Country 2024 & 2032
- Figure 41: Europe US Wound Care Management Devices Industry Revenue Share (%), by Country 2024 & 2032
- Figure 42: Europe US Wound Care Management Devices Industry Volume Share (%), by Country 2024 & 2032
- Figure 43: Middle East & Africa US Wound Care Management Devices Industry Revenue (Million), by Product 2024 & 2032
- Figure 44: Middle East & Africa US Wound Care Management Devices Industry Volume (K Unit), by Product 2024 & 2032
- Figure 45: Middle East & Africa US Wound Care Management Devices Industry Revenue Share (%), by Product 2024 & 2032
- Figure 46: Middle East & Africa US Wound Care Management Devices Industry Volume Share (%), by Product 2024 & 2032
- Figure 47: Middle East & Africa US Wound Care Management Devices Industry Revenue (Million), by Wound Type 2024 & 2032
- Figure 48: Middle East & Africa US Wound Care Management Devices Industry Volume (K Unit), by Wound Type 2024 & 2032
- Figure 49: Middle East & Africa US Wound Care Management Devices Industry Revenue Share (%), by Wound Type 2024 & 2032
- Figure 50: Middle East & Africa US Wound Care Management Devices Industry Volume Share (%), by Wound Type 2024 & 2032
- Figure 51: Middle East & Africa US Wound Care Management Devices Industry Revenue (Million), by Country 2024 & 2032
- Figure 52: Middle East & Africa US Wound Care Management Devices Industry Volume (K Unit), by Country 2024 & 2032
- Figure 53: Middle East & Africa US Wound Care Management Devices Industry Revenue Share (%), by Country 2024 & 2032
- Figure 54: Middle East & Africa US Wound Care Management Devices Industry Volume Share (%), by Country 2024 & 2032
- Figure 55: Asia Pacific US Wound Care Management Devices Industry Revenue (Million), by Product 2024 & 2032
- Figure 56: Asia Pacific US Wound Care Management Devices Industry Volume (K Unit), by Product 2024 & 2032
- Figure 57: Asia Pacific US Wound Care Management Devices Industry Revenue Share (%), by Product 2024 & 2032
- Figure 58: Asia Pacific US Wound Care Management Devices Industry Volume Share (%), by Product 2024 & 2032
- Figure 59: Asia Pacific US Wound Care Management Devices Industry Revenue (Million), by Wound Type 2024 & 2032
- Figure 60: Asia Pacific US Wound Care Management Devices Industry Volume (K Unit), by Wound Type 2024 & 2032
- Figure 61: Asia Pacific US Wound Care Management Devices Industry Revenue Share (%), by Wound Type 2024 & 2032
- Figure 62: Asia Pacific US Wound Care Management Devices Industry Volume Share (%), by Wound Type 2024 & 2032
- Figure 63: Asia Pacific US Wound Care Management Devices Industry Revenue (Million), by Country 2024 & 2032
- Figure 64: Asia Pacific US Wound Care Management Devices Industry Volume (K Unit), by Country 2024 & 2032
- Figure 65: Asia Pacific US Wound Care Management Devices Industry Revenue Share (%), by Country 2024 & 2032
- Figure 66: Asia Pacific US Wound Care Management Devices Industry Volume Share (%), by Country 2024 & 2032
List of Tables
- Table 1: Global US Wound Care Management Devices Industry Revenue Million Forecast, by Region 2019 & 2032
- Table 2: Global US Wound Care Management Devices Industry Volume K Unit Forecast, by Region 2019 & 2032
- Table 3: Global US Wound Care Management Devices Industry Revenue Million Forecast, by Product 2019 & 2032
- Table 4: Global US Wound Care Management Devices Industry Volume K Unit Forecast, by Product 2019 & 2032
- Table 5: Global US Wound Care Management Devices Industry Revenue Million Forecast, by Wound Type 2019 & 2032
- Table 6: Global US Wound Care Management Devices Industry Volume K Unit Forecast, by Wound Type 2019 & 2032
- Table 7: Global US Wound Care Management Devices Industry Revenue Million Forecast, by Region 2019 & 2032
- Table 8: Global US Wound Care Management Devices Industry Volume K Unit Forecast, by Region 2019 & 2032
- Table 9: Global US Wound Care Management Devices Industry Revenue Million Forecast, by Country 2019 & 2032
- Table 10: Global US Wound Care Management Devices Industry Volume K Unit Forecast, by Country 2019 & 2032
- Table 11: Global US Wound Care Management Devices Industry Revenue Million Forecast, by Product 2019 & 2032
- Table 12: Global US Wound Care Management Devices Industry Volume K Unit Forecast, by Product 2019 & 2032
- Table 13: Global US Wound Care Management Devices Industry Revenue Million Forecast, by Wound Type 2019 & 2032
- Table 14: Global US Wound Care Management Devices Industry Volume K Unit Forecast, by Wound Type 2019 & 2032
- Table 15: Global US Wound Care Management Devices Industry Revenue Million Forecast, by Country 2019 & 2032
- Table 16: Global US Wound Care Management Devices Industry Volume K Unit Forecast, by Country 2019 & 2032
- Table 17: United States US Wound Care Management Devices Industry Revenue (Million) Forecast, by Application 2019 & 2032
- Table 18: United States US Wound Care Management Devices Industry Volume (K Unit) Forecast, by Application 2019 & 2032
- Table 19: Canada US Wound Care Management Devices Industry Revenue (Million) Forecast, by Application 2019 & 2032
- Table 20: Canada US Wound Care Management Devices Industry Volume (K Unit) Forecast, by Application 2019 & 2032
- Table 21: Mexico US Wound Care Management Devices Industry Revenue (Million) Forecast, by Application 2019 & 2032
- Table 22: Mexico US Wound Care Management Devices Industry Volume (K Unit) Forecast, by Application 2019 & 2032
- Table 23: Global US Wound Care Management Devices Industry Revenue Million Forecast, by Product 2019 & 2032
- Table 24: Global US Wound Care Management Devices Industry Volume K Unit Forecast, by Product 2019 & 2032
- Table 25: Global US Wound Care Management Devices Industry Revenue Million Forecast, by Wound Type 2019 & 2032
- Table 26: Global US Wound Care Management Devices Industry Volume K Unit Forecast, by Wound Type 2019 & 2032
- Table 27: Global US Wound Care Management Devices Industry Revenue Million Forecast, by Country 2019 & 2032
- Table 28: Global US Wound Care Management Devices Industry Volume K Unit Forecast, by Country 2019 & 2032
- Table 29: Brazil US Wound Care Management Devices Industry Revenue (Million) Forecast, by Application 2019 & 2032
- Table 30: Brazil US Wound Care Management Devices Industry Volume (K Unit) Forecast, by Application 2019 & 2032
- Table 31: Argentina US Wound Care Management Devices Industry Revenue (Million) Forecast, by Application 2019 & 2032
- Table 32: Argentina US Wound Care Management Devices Industry Volume (K Unit) Forecast, by Application 2019 & 2032
- Table 33: Rest of South America US Wound Care Management Devices Industry Revenue (Million) Forecast, by Application 2019 & 2032
- Table 34: Rest of South America US Wound Care Management Devices Industry Volume (K Unit) Forecast, by Application 2019 & 2032
- Table 35: Global US Wound Care Management Devices Industry Revenue Million Forecast, by Product 2019 & 2032
- Table 36: Global US Wound Care Management Devices Industry Volume K Unit Forecast, by Product 2019 & 2032
- Table 37: Global US Wound Care Management Devices Industry Revenue Million Forecast, by Wound Type 2019 & 2032
- Table 38: Global US Wound Care Management Devices Industry Volume K Unit Forecast, by Wound Type 2019 & 2032
- Table 39: Global US Wound Care Management Devices Industry Revenue Million Forecast, by Country 2019 & 2032
- Table 40: Global US Wound Care Management Devices Industry Volume K Unit Forecast, by Country 2019 & 2032
- Table 41: United Kingdom US Wound Care Management Devices Industry Revenue (Million) Forecast, by Application 2019 & 2032
- Table 42: United Kingdom US Wound Care Management Devices Industry Volume (K Unit) Forecast, by Application 2019 & 2032
- Table 43: Germany US Wound Care Management Devices Industry Revenue (Million) Forecast, by Application 2019 & 2032
- Table 44: Germany US Wound Care Management Devices Industry Volume (K Unit) Forecast, by Application 2019 & 2032
- Table 45: France US Wound Care Management Devices Industry Revenue (Million) Forecast, by Application 2019 & 2032
- Table 46: France US Wound Care Management Devices Industry Volume (K Unit) Forecast, by Application 2019 & 2032
- Table 47: Italy US Wound Care Management Devices Industry Revenue (Million) Forecast, by Application 2019 & 2032
- Table 48: Italy US Wound Care Management Devices Industry Volume (K Unit) Forecast, by Application 2019 & 2032
- Table 49: Spain US Wound Care Management Devices Industry Revenue (Million) Forecast, by Application 2019 & 2032
- Table 50: Spain US Wound Care Management Devices Industry Volume (K Unit) Forecast, by Application 2019 & 2032
- Table 51: Russia US Wound Care Management Devices Industry Revenue (Million) Forecast, by Application 2019 & 2032
- Table 52: Russia US Wound Care Management Devices Industry Volume (K Unit) Forecast, by Application 2019 & 2032
- Table 53: Benelux US Wound Care Management Devices Industry Revenue (Million) Forecast, by Application 2019 & 2032
- Table 54: Benelux US Wound Care Management Devices Industry Volume (K Unit) Forecast, by Application 2019 & 2032
- Table 55: Nordics US Wound Care Management Devices Industry Revenue (Million) Forecast, by Application 2019 & 2032
- Table 56: Nordics US Wound Care Management Devices Industry Volume (K Unit) Forecast, by Application 2019 & 2032
- Table 57: Rest of Europe US Wound Care Management Devices Industry Revenue (Million) Forecast, by Application 2019 & 2032
- Table 58: Rest of Europe US Wound Care Management Devices Industry Volume (K Unit) Forecast, by Application 2019 & 2032
- Table 59: Global US Wound Care Management Devices Industry Revenue Million Forecast, by Product 2019 & 2032
- Table 60: Global US Wound Care Management Devices Industry Volume K Unit Forecast, by Product 2019 & 2032
- Table 61: Global US Wound Care Management Devices Industry Revenue Million Forecast, by Wound Type 2019 & 2032
- Table 62: Global US Wound Care Management Devices Industry Volume K Unit Forecast, by Wound Type 2019 & 2032
- Table 63: Global US Wound Care Management Devices Industry Revenue Million Forecast, by Country 2019 & 2032
- Table 64: Global US Wound Care Management Devices Industry Volume K Unit Forecast, by Country 2019 & 2032
- Table 65: Turkey US Wound Care Management Devices Industry Revenue (Million) Forecast, by Application 2019 & 2032
- Table 66: Turkey US Wound Care Management Devices Industry Volume (K Unit) Forecast, by Application 2019 & 2032
- Table 67: Israel US Wound Care Management Devices Industry Revenue (Million) Forecast, by Application 2019 & 2032
- Table 68: Israel US Wound Care Management Devices Industry Volume (K Unit) Forecast, by Application 2019 & 2032
- Table 69: GCC US Wound Care Management Devices Industry Revenue (Million) Forecast, by Application 2019 & 2032
- Table 70: GCC US Wound Care Management Devices Industry Volume (K Unit) Forecast, by Application 2019 & 2032
- Table 71: North Africa US Wound Care Management Devices Industry Revenue (Million) Forecast, by Application 2019 & 2032
- Table 72: North Africa US Wound Care Management Devices Industry Volume (K Unit) Forecast, by Application 2019 & 2032
- Table 73: South Africa US Wound Care Management Devices Industry Revenue (Million) Forecast, by Application 2019 & 2032
- Table 74: South Africa US Wound Care Management Devices Industry Volume (K Unit) Forecast, by Application 2019 & 2032
- Table 75: Rest of Middle East & Africa US Wound Care Management Devices Industry Revenue (Million) Forecast, by Application 2019 & 2032
- Table 76: Rest of Middle East & Africa US Wound Care Management Devices Industry Volume (K Unit) Forecast, by Application 2019 & 2032
- Table 77: Global US Wound Care Management Devices Industry Revenue Million Forecast, by Product 2019 & 2032
- Table 78: Global US Wound Care Management Devices Industry Volume K Unit Forecast, by Product 2019 & 2032
- Table 79: Global US Wound Care Management Devices Industry Revenue Million Forecast, by Wound Type 2019 & 2032
- Table 80: Global US Wound Care Management Devices Industry Volume K Unit Forecast, by Wound Type 2019 & 2032
- Table 81: Global US Wound Care Management Devices Industry Revenue Million Forecast, by Country 2019 & 2032
- Table 82: Global US Wound Care Management Devices Industry Volume K Unit Forecast, by Country 2019 & 2032
- Table 83: China US Wound Care Management Devices Industry Revenue (Million) Forecast, by Application 2019 & 2032
- Table 84: China US Wound Care Management Devices Industry Volume (K Unit) Forecast, by Application 2019 & 2032
- Table 85: India US Wound Care Management Devices Industry Revenue (Million) Forecast, by Application 2019 & 2032
- Table 86: India US Wound Care Management Devices Industry Volume (K Unit) Forecast, by Application 2019 & 2032
- Table 87: Japan US Wound Care Management Devices Industry Revenue (Million) Forecast, by Application 2019 & 2032
- Table 88: Japan US Wound Care Management Devices Industry Volume (K Unit) Forecast, by Application 2019 & 2032
- Table 89: South Korea US Wound Care Management Devices Industry Revenue (Million) Forecast, by Application 2019 & 2032
- Table 90: South Korea US Wound Care Management Devices Industry Volume (K Unit) Forecast, by Application 2019 & 2032
- Table 91: ASEAN US Wound Care Management Devices Industry Revenue (Million) Forecast, by Application 2019 & 2032
- Table 92: ASEAN US Wound Care Management Devices Industry Volume (K Unit) Forecast, by Application 2019 & 2032
- Table 93: Oceania US Wound Care Management Devices Industry Revenue (Million) Forecast, by Application 2019 & 2032
- Table 94: Oceania US Wound Care Management Devices Industry Volume (K Unit) Forecast, by Application 2019 & 2032
- Table 95: Rest of Asia Pacific US Wound Care Management Devices Industry Revenue (Million) Forecast, by Application 2019 & 2032
- Table 96: Rest of Asia Pacific US Wound Care Management Devices Industry Volume (K Unit) Forecast, by Application 2019 & 2032
Frequently Asked Questions
1. What is the projected Compound Annual Growth Rate (CAGR) of the US Wound Care Management Devices Industry?
The projected CAGR is approximately 3.39%.
2. Which companies are prominent players in the US Wound Care Management Devices Industry?
Key companies in the market include Smith & Nephew, Medtronic, ConvaTec Group PLC, Cardinal Health Inc, 3M Company, Johnson and Johnson, Organogenesis Inc, Teleflex Incorporated, B Braun SE, Medline Industries Inc, Coloplast Corp , Integra Lifesciences.
3. What are the main segments of the US Wound Care Management Devices Industry?
The market segments include Product, Wound Type.
4. Can you provide details about the market size?
The market size is estimated to be USD XX Million as of 2022.
5. What are some drivers contributing to market growth?
Increasing Incidences of Chronic Wounds. Ulcers and Diabetic Ulcers; Increase in the Number of Surgical Procedures; Rising Aging Population.
6. What are the notable trends driving market growth?
Sutures Segment is Expected to Grow Significantly Over the Forecast Period.
7. Are there any restraints impacting market growth?
Concerns with Stringent Regulations and Reimbursement Policies; High Treatment Costs.
8. Can you provide examples of recent developments in the market?
April 2023: 3M Health Care's innovative 3M Veraflo Therapy, with both 3M Veraflo Cleanse Choice Complete Dressing and 3M™ V.A.C. Veraflo Cleanse Choice Dressing, received the first-ever Food and Drug Administration (FDA) clearance for hydromechanical removal of infectious materials, non-viable tissue and wound debris which reduces the number of surgical debridements required, while promoting granulation tissue formation, creating an environment that promotes wound healing.
9. What pricing options are available for accessing the report?
Pricing options include single-user, multi-user, and enterprise licenses priced at USD 3800, USD 4500, and USD 5800 respectively.
10. Is the market size provided in terms of value or volume?
The market size is provided in terms of value, measured in Million and volume, measured in K Unit.
11. Are there any specific market keywords associated with the report?
Yes, the market keyword associated with the report is "US Wound Care Management Devices Industry," which aids in identifying and referencing the specific market segment covered.
12. How do I determine which pricing option suits my needs best?
The pricing options vary based on user requirements and access needs. Individual users may opt for single-user licenses, while businesses requiring broader access may choose multi-user or enterprise licenses for cost-effective access to the report.
13. Are there any additional resources or data provided in the US Wound Care Management Devices Industry report?
While the report offers comprehensive insights, it's advisable to review the specific contents or supplementary materials provided to ascertain if additional resources or data are available.
14. How can I stay updated on further developments or reports in the US Wound Care Management Devices Industry?
To stay informed about further developments, trends, and reports in the US Wound Care Management Devices Industry, consider subscribing to industry newsletters, following relevant companies and organizations, or regularly checking reputable industry news sources and publications.
Methodology
Step 1 - Identification of Relevant Samples Size from Population Database


Step 2 - Approaches for Defining Global Market Size (Value, Volume* & Price*)

Note*: In applicable scenarios
Step 3 - Data Sources
Primary Research
- Web Analytics
- Survey Reports
- Research Institute
- Latest Research Reports
- Opinion Leaders
Secondary Research
- Annual Reports
- White Paper
- Latest Press Release
- Industry Association
- Paid Database
- Investor Presentations

Step 4 - Data Triangulation
Involves using different sources of information in order to increase the validity of a study
These sources are likely to be stakeholders in a program - participants, other researchers, program staff, other community members, and so on.
Then we put all data in single framework & apply various statistical tools to find out the dynamic on the market.
During the analysis stage, feedback from the stakeholder groups would be compared to determine areas of agreement as well as areas of divergence


