
Key Insights
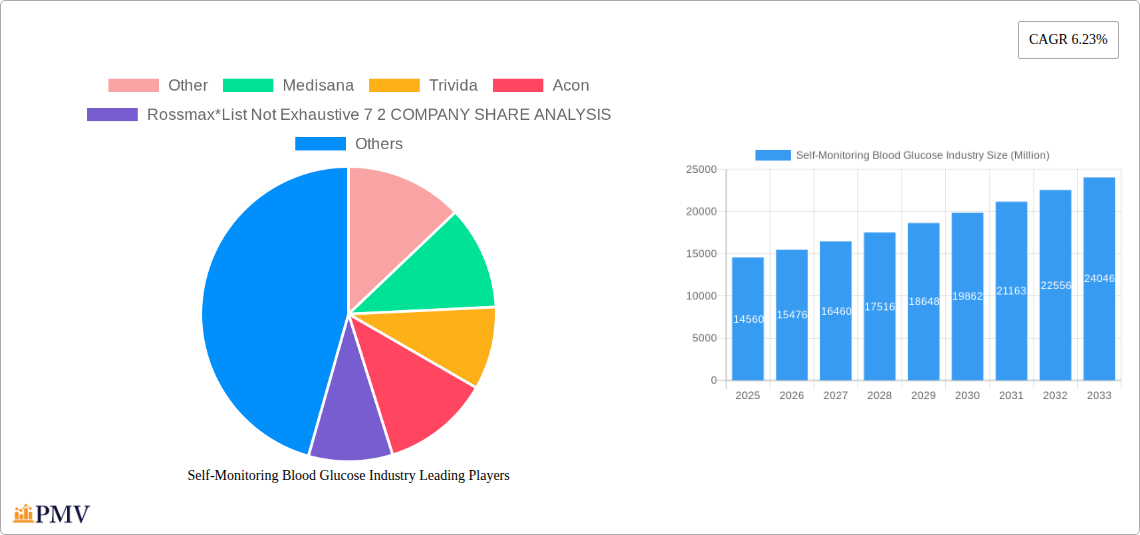
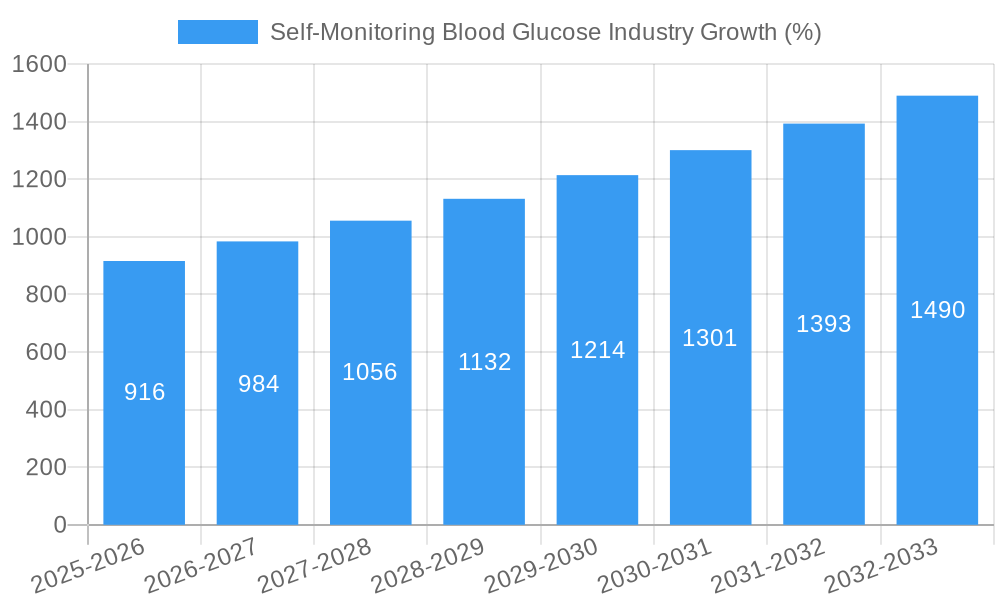
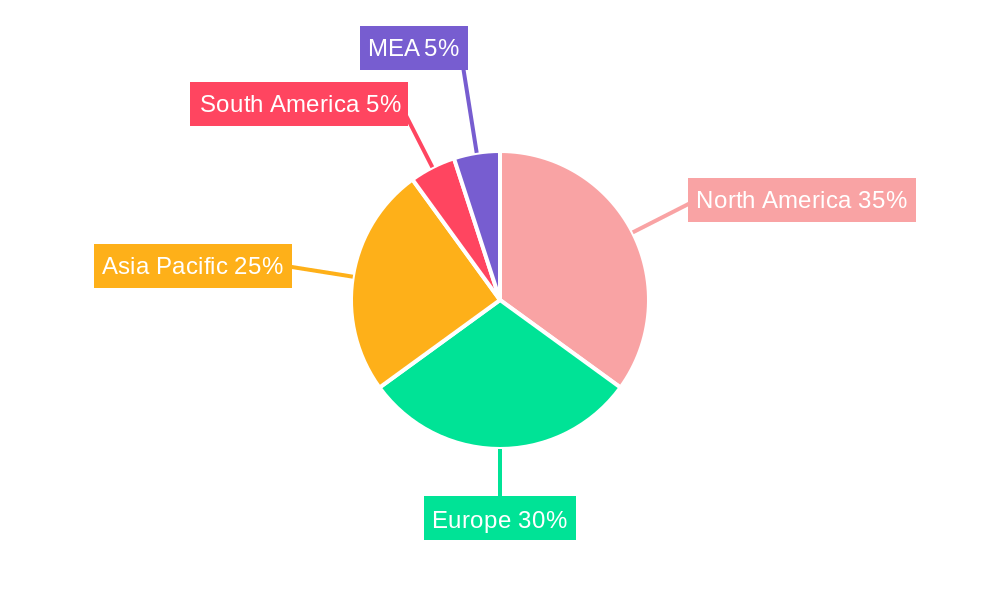
The self-monitoring blood glucose (SMBG) market, valued at $14.56 billion in 2025, is projected to experience robust growth, driven by rising prevalence of diabetes globally and increasing demand for convenient home-based testing solutions. A compound annual growth rate (CAGR) of 6.23% from 2025 to 2033 indicates a significant market expansion, reaching an estimated value exceeding $25 billion by 2033. This growth is fueled by technological advancements leading to more accurate, user-friendly, and affordable glucometers and test strips. The market is segmented by component (glucometer devices, test strips, lancets) and end-user (hospitals/clinics, personal/home use), with the personal/home segment dominating due to increasing self-management of diabetes among individuals. Key players such as Abbott, Roche, and LifeScan are driving innovation and competition, while emerging companies are focusing on developing technologically advanced devices and improving accessibility in underserved regions. Growth is further supported by increasing awareness about diabetes prevention and management, coupled with expanding healthcare infrastructure and improved access to healthcare services in developing economies. However, factors like potential price fluctuations in raw materials and intense competition among established and emerging players could pose challenges to market growth. The North American and European markets currently hold significant shares, but Asia Pacific is anticipated to show the most robust growth in the forecast period, driven by increasing diabetes prevalence and rising disposable incomes.
The SMBG market's future growth depends on successful strategies by market leaders to enhance product offerings, expand distribution networks, particularly in emerging markets, and focus on personalized diabetes management solutions. Continuous research and development focused on improving accuracy, reducing testing time, and incorporating digital connectivity into glucometers are crucial for sustained market expansion. Furthermore, strategic collaborations and partnerships among manufacturers, healthcare providers, and technology companies will play a vital role in improving patient access and outcomes, contributing significantly to overall market growth. Regulatory approvals for new technologies and increasing health insurance coverage for diabetes management tools will also contribute to positive market trends.
This comprehensive report provides an in-depth analysis of the Self-Monitoring Blood Glucose (SMBG) industry, offering invaluable insights for stakeholders seeking to understand market dynamics, competitive landscapes, and future growth opportunities. The report covers the period from 2019 to 2033, with a base year of 2025 and a forecast period of 2025-2033. The global SMBG market size is estimated to reach xx Million by 2025 and is projected to experience significant growth during the forecast period. This report includes detailed analysis of key market segments, leading players, and crucial industry developments.
Self-Monitoring Blood Glucose Industry Market Structure & Competitive Dynamics
The SMBG market exhibits a moderately concentrated structure with several major players holding significant market share. The top seven companies – Agamatrix Inc, F Hoffmann-La Roche AG, Abbott, Bionime Corporation, Arkray, LifeScan, and Ascensia – account for approximately 72% of the total market share in 2025. Other prominent players include Medisana, Trivida, Acon, and Rossmax, although their individual market shares are considerably smaller.
The industry's innovation ecosystem is highly active, driven by continuous advancements in glucometer technology, such as wireless connectivity, integrated data management systems, and improved accuracy. Regulatory frameworks, particularly those related to medical device approvals and data privacy, significantly impact market dynamics. Product substitutes, such as continuous glucose monitoring (CGM) systems, pose a growing competitive challenge. End-user trends are shifting towards greater preference for user-friendly, connected devices and personalized diabetes management solutions. Mergers and acquisitions (M&A) activity has been relatively moderate, with deal values typically ranging from xx Million to xx Million, primarily focused on enhancing technology portfolios and expanding market reach. The average M&A deal value in the period 2019-2024 is estimated to be xx Million.
Self-Monitoring Blood Glucose Industry Industry Trends & Insights
The SMBG market is experiencing robust growth, driven by several key factors. The increasing prevalence of diabetes globally is a primary driver, with a projected CAGR of xx% during the forecast period. Technological disruptions, such as the integration of mobile apps and cloud-based data platforms, are enhancing the convenience and effectiveness of SMBG. Consumer preferences are increasingly focused on ease of use, accuracy, and data integration capabilities. Competitive dynamics are intensifying, with companies investing heavily in research and development to improve product features, enhance data analytics, and expand market access. The market penetration of SMBG devices is expected to reach xx% by 2033, significantly driven by increased awareness and improved access to healthcare in emerging markets.
Dominant Markets & Segments in Self-Monitoring Blood Glucose Industry
Leading Region/Country: North America currently holds the largest market share, driven by high diabetes prevalence, advanced healthcare infrastructure, and strong consumer demand. However, significant growth is expected in Asia Pacific due to rising diabetes incidence and expanding healthcare access.
Dominant Segments:
- By Component: Test strips represent the largest segment by value, followed by glucometer devices and lancets. This is attributed to the frequent need for test strip replacements, compared to the less frequent purchase of glucometers and lancets. The glucometer device segment is also experiencing growth due to the continuous development of advanced technologies, including wireless connectivity.
- By End User: The personal/home use segment dominates the SMBG market, reflecting the self-management nature of diabetes care. However, the hospital/clinics segment also holds a significant share, fueled by the demand for accurate and reliable glucose monitoring in clinical settings. Key drivers for the dominance include the high prevalence of diabetes-related hospital admissions and the demand for point-of-care testing.
Self-Monitoring Blood Glucose Industry Product Innovations
Recent product innovations in the SMBG industry focus on improving accuracy, connectivity, and user experience. The integration of Bluetooth technology with mobile apps allows for seamless data transfer and remote monitoring, empowering users with personalized insights. The development of smaller, more discreet glucometers enhances portability and user comfort. These advancements have resulted in improved glycemic control and enhanced patient engagement. This improves market competitiveness and patient compliance.
Report Segmentation & Scope
This report segments the SMBG market by component (Glucometer Devices, Test Strips, Lancets) and end-user (Hospital/Clinics, Personal/Home). Each segment is analyzed in detail, including growth projections, market size estimates, and competitive dynamics. For example, the glucometer device segment is expected to witness a xx% CAGR during the forecast period, driven by technological advancements and increasing preference for user-friendly devices. The test strips segment is also expected to demonstrate healthy growth due to the continuous need for consumables. The hospital/clinics segment is projected to experience steady growth due to increased demand for point-of-care testing solutions in hospitals and clinics, while the personal/home segment is expected to maintain its dominance, driven by rising diabetes prevalence and increasing self-management practices.
Key Drivers of Self-Monitoring Blood Glucose Industry Growth
Several factors drive the growth of the SMBG industry. The rising prevalence of diabetes, globally, is a major driver. Advancements in glucometer technology, such as improved accuracy, connectivity, and ease of use, are significantly contributing to market growth. Favorable regulatory environments supporting the adoption of SMBG devices also play a crucial role. Finally, increasing healthcare awareness and better access to diabetes management resources are bolstering demand.
Challenges in the Self-Monitoring Blood Glucose Industry Sector
Despite the substantial growth, the SMBG industry faces several challenges. Stringent regulatory approvals for new devices and technologies can delay market entry and increase development costs. Supply chain disruptions can impact the availability of essential components like test strips and lancets. The increasing competition from continuous glucose monitoring (CGM) systems poses a significant threat. These challenges could cumulatively impact market growth by approximately xx% by the end of the forecast period.
Leading Players in the Self-Monitoring Blood Glucose Industry Market
- Other
- Medisana
- Trivida
- Acon
- Rossmax
- Agamatrix Inc
- F Hoffmann-La Roche AG
- Abbott
- Bionime Corporation
- Arkray
- LifeScan
- Ascensia
Key Developments in Self-Monitoring Blood Glucose Industry Sector
June 2022: LifeScan announced the publication of Real World Evidence demonstrating improved glycemic control using a Bluetooth-connected blood glucose meter with a mobile diabetes management application (OneTouch Reveal app with OneTouch Verio Reflect meter). This highlights the growing importance of connected devices in diabetes management.
January 2022: Roche launched its Cobas pulse point-of-care blood glucose monitor for hospital professionals. This sophisticated device features an automated test strip reader, camera, and touchscreen, expanding the capabilities of SMBG in clinical settings.
Strategic Self-Monitoring Blood Glucose Industry Market Outlook
The future of the SMBG industry looks promising, with continued growth driven by technological advancements, rising diabetes prevalence, and expanding access to healthcare. Strategic opportunities lie in developing innovative, connected devices, enhancing data analytics capabilities, and penetrating emerging markets. Focusing on personalized diabetes management solutions and leveraging digital health technologies will be crucial for sustained growth and competitive advantage in the years to come.
Self-Monitoring Blood Glucose Industry Segmentation
-
1. Component
- 1.1. Glucometer Devices
- 1.2. Test Strips
- 1.3. Lancets
-
2. End User
- 2.1. Hospital/Clinics
- 2.2. Personal/Home
Self-Monitoring Blood Glucose Industry Segmentation By Geography
-
1. North America
- 1.1. United States
- 1.2. Canada
- 1.3. Rest of North America
-
2. Europe
- 2.1. France
- 2.2. Germany
- 2.3. Italy
- 2.4. Spain
- 2.5. United Kingdom
- 2.6. Russia
- 2.7. Rest of Europe
-
3. Latin America
- 3.1. Mexico
- 3.2. Brazil
- 3.3. Rest of Latin America
-
4. Asia Pacific
- 4.1. Japan
- 4.2. South Korea
- 4.3. China
- 4.4. India
- 4.5. Australia
- 4.6. Vietnam
- 4.7. Malaysia
- 4.8. Indonesia
- 4.9. Philippines
- 4.10. Thailand
- 4.11. Rest of Asia Pacific
- 5. Middle East
-
6. Saudi Arabia
- 6.1. Iran
- 6.2. Egypt
- 6.3. Oman
- 6.4. South Africa
- 6.5. Rest of Middle East
Self-Monitoring Blood Glucose Industry REPORT HIGHLIGHTS
| Aspects | Details |
|---|---|
| Study Period | 2019-2033 |
| Base Year | 2024 |
| Estimated Year | 2025 |
| Forecast Period | 2025-2033 |
| Historical Period | 2019-2024 |
| Growth Rate | CAGR of 6.23% from 2019-2033 |
| Segmentation |
|
Table of Contents
- 1. Introduction
- 1.1. Research Scope
- 1.2. Market Segmentation
- 1.3. Research Methodology
- 1.4. Definitions and Assumptions
- 2. Executive Summary
- 2.1. Introduction
- 3. Market Dynamics
- 3.1. Introduction
- 3.2. Market Drivers
- 3.2.1. Rising Prevalence of Cancer Worldwide; Technological Advancements in Diagnostic Testing; Increasing Demand for Point-of-care Treatment
- 3.3. Market Restrains
- 3.3.1. High Cost of Molecular Diagnostic Tests; Lack of Skilled Workforce and Stringent Regulatory Framework
- 3.4. Market Trends
- 3.4.1. The Glucometer Devices Segment is Expected to Witness the Highest CAGR
- 4. Market Factor Analysis
- 4.1. Porters Five Forces
- 4.2. Supply/Value Chain
- 4.3. PESTEL analysis
- 4.4. Market Entropy
- 4.5. Patent/Trademark Analysis
- 5. Global Self-Monitoring Blood Glucose Industry Analysis, Insights and Forecast, 2019-2031
- 5.1. Market Analysis, Insights and Forecast - by Component
- 5.1.1. Glucometer Devices
- 5.1.2. Test Strips
- 5.1.3. Lancets
- 5.2. Market Analysis, Insights and Forecast - by End User
- 5.2.1. Hospital/Clinics
- 5.2.2. Personal/Home
- 5.3. Market Analysis, Insights and Forecast - by Region
- 5.3.1. North America
- 5.3.2. Europe
- 5.3.3. Latin America
- 5.3.4. Asia Pacific
- 5.3.5. Middle East
- 5.3.6. Saudi Arabia
- 5.1. Market Analysis, Insights and Forecast - by Component
- 6. North America Self-Monitoring Blood Glucose Industry Analysis, Insights and Forecast, 2019-2031
- 6.1. Market Analysis, Insights and Forecast - by Component
- 6.1.1. Glucometer Devices
- 6.1.2. Test Strips
- 6.1.3. Lancets
- 6.2. Market Analysis, Insights and Forecast - by End User
- 6.2.1. Hospital/Clinics
- 6.2.2. Personal/Home
- 6.1. Market Analysis, Insights and Forecast - by Component
- 7. Europe Self-Monitoring Blood Glucose Industry Analysis, Insights and Forecast, 2019-2031
- 7.1. Market Analysis, Insights and Forecast - by Component
- 7.1.1. Glucometer Devices
- 7.1.2. Test Strips
- 7.1.3. Lancets
- 7.2. Market Analysis, Insights and Forecast - by End User
- 7.2.1. Hospital/Clinics
- 7.2.2. Personal/Home
- 7.1. Market Analysis, Insights and Forecast - by Component
- 8. Latin America Self-Monitoring Blood Glucose Industry Analysis, Insights and Forecast, 2019-2031
- 8.1. Market Analysis, Insights and Forecast - by Component
- 8.1.1. Glucometer Devices
- 8.1.2. Test Strips
- 8.1.3. Lancets
- 8.2. Market Analysis, Insights and Forecast - by End User
- 8.2.1. Hospital/Clinics
- 8.2.2. Personal/Home
- 8.1. Market Analysis, Insights and Forecast - by Component
- 9. Asia Pacific Self-Monitoring Blood Glucose Industry Analysis, Insights and Forecast, 2019-2031
- 9.1. Market Analysis, Insights and Forecast - by Component
- 9.1.1. Glucometer Devices
- 9.1.2. Test Strips
- 9.1.3. Lancets
- 9.2. Market Analysis, Insights and Forecast - by End User
- 9.2.1. Hospital/Clinics
- 9.2.2. Personal/Home
- 9.1. Market Analysis, Insights and Forecast - by Component
- 10. Middle East Self-Monitoring Blood Glucose Industry Analysis, Insights and Forecast, 2019-2031
- 10.1. Market Analysis, Insights and Forecast - by Component
- 10.1.1. Glucometer Devices
- 10.1.2. Test Strips
- 10.1.3. Lancets
- 10.2. Market Analysis, Insights and Forecast - by End User
- 10.2.1. Hospital/Clinics
- 10.2.2. Personal/Home
- 10.1. Market Analysis, Insights and Forecast - by Component
- 11. Saudi Arabia Self-Monitoring Blood Glucose Industry Analysis, Insights and Forecast, 2019-2031
- 11.1. Market Analysis, Insights and Forecast - by Component
- 11.1.1. Glucometer Devices
- 11.1.2. Test Strips
- 11.1.3. Lancets
- 11.2. Market Analysis, Insights and Forecast - by End User
- 11.2.1. Hospital/Clinics
- 11.2.2. Personal/Home
- 11.1. Market Analysis, Insights and Forecast - by Component
- 12. North America Self-Monitoring Blood Glucose Industry Analysis, Insights and Forecast, 2019-2031
- 12.1. Market Analysis, Insights and Forecast - By Country/Sub-region
- 12.1.1 United States
- 12.1.2 Canada
- 12.1.3 Mexico
- 13. Europe Self-Monitoring Blood Glucose Industry Analysis, Insights and Forecast, 2019-2031
- 13.1. Market Analysis, Insights and Forecast - By Country/Sub-region
- 13.1.1 Germany
- 13.1.2 United Kingdom
- 13.1.3 France
- 13.1.4 Spain
- 13.1.5 Italy
- 13.1.6 Spain
- 13.1.7 Belgium
- 13.1.8 Netherland
- 13.1.9 Nordics
- 13.1.10 Rest of Europe
- 14. Asia Pacific Self-Monitoring Blood Glucose Industry Analysis, Insights and Forecast, 2019-2031
- 14.1. Market Analysis, Insights and Forecast - By Country/Sub-region
- 14.1.1 China
- 14.1.2 Japan
- 14.1.3 India
- 14.1.4 South Korea
- 14.1.5 Southeast Asia
- 14.1.6 Australia
- 14.1.7 Indonesia
- 14.1.8 Phillipes
- 14.1.9 Singapore
- 14.1.10 Thailandc
- 14.1.11 Rest of Asia Pacific
- 15. South America Self-Monitoring Blood Glucose Industry Analysis, Insights and Forecast, 2019-2031
- 15.1. Market Analysis, Insights and Forecast - By Country/Sub-region
- 15.1.1 Brazil
- 15.1.2 Argentina
- 15.1.3 Peru
- 15.1.4 Chile
- 15.1.5 Colombia
- 15.1.6 Ecuador
- 15.1.7 Venezuela
- 15.1.8 Rest of South America
- 16. MEA Self-Monitoring Blood Glucose Industry Analysis, Insights and Forecast, 2019-2031
- 16.1. Market Analysis, Insights and Forecast - By Country/Sub-region
- 16.1.1 United Arab Emirates
- 16.1.2 Saudi Arabia
- 16.1.3 South Africa
- 16.1.4 Rest of Middle East and Africa
- 17. Competitive Analysis
- 17.1. Global Market Share Analysis 2024
- 17.2. Company Profiles
- 17.2.1 Other
- 17.2.1.1. Overview
- 17.2.1.2. Products
- 17.2.1.3. SWOT Analysis
- 17.2.1.4. Recent Developments
- 17.2.1.5. Financials (Based on Availability)
- 17.2.2 Medisana
- 17.2.2.1. Overview
- 17.2.2.2. Products
- 17.2.2.3. SWOT Analysis
- 17.2.2.4. Recent Developments
- 17.2.2.5. Financials (Based on Availability)
- 17.2.3 Trivida
- 17.2.3.1. Overview
- 17.2.3.2. Products
- 17.2.3.3. SWOT Analysis
- 17.2.3.4. Recent Developments
- 17.2.3.5. Financials (Based on Availability)
- 17.2.4 Acon
- 17.2.4.1. Overview
- 17.2.4.2. Products
- 17.2.4.3. SWOT Analysis
- 17.2.4.4. Recent Developments
- 17.2.4.5. Financials (Based on Availability)
- 17.2.5 Rossmax*List Not Exhaustive 7 2 COMPANY SHARE ANALYSIS
- 17.2.5.1. Overview
- 17.2.5.2. Products
- 17.2.5.3. SWOT Analysis
- 17.2.5.4. Recent Developments
- 17.2.5.5. Financials (Based on Availability)
- 17.2.6 Agamatrix Inc
- 17.2.6.1. Overview
- 17.2.6.2. Products
- 17.2.6.3. SWOT Analysis
- 17.2.6.4. Recent Developments
- 17.2.6.5. Financials (Based on Availability)
- 17.2.7 F Hoffmann-La Roche AG
- 17.2.7.1. Overview
- 17.2.7.2. Products
- 17.2.7.3. SWOT Analysis
- 17.2.7.4. Recent Developments
- 17.2.7.5. Financials (Based on Availability)
- 17.2.8 Abbott
- 17.2.8.1. Overview
- 17.2.8.2. Products
- 17.2.8.3. SWOT Analysis
- 17.2.8.4. Recent Developments
- 17.2.8.5. Financials (Based on Availability)
- 17.2.9 Bionime Corporation
- 17.2.9.1. Overview
- 17.2.9.2. Products
- 17.2.9.3. SWOT Analysis
- 17.2.9.4. Recent Developments
- 17.2.9.5. Financials (Based on Availability)
- 17.2.10 Arkray
- 17.2.10.1. Overview
- 17.2.10.2. Products
- 17.2.10.3. SWOT Analysis
- 17.2.10.4. Recent Developments
- 17.2.10.5. Financials (Based on Availability)
- 17.2.11 LifeScan
- 17.2.11.1. Overview
- 17.2.11.2. Products
- 17.2.11.3. SWOT Analysis
- 17.2.11.4. Recent Developments
- 17.2.11.5. Financials (Based on Availability)
- 17.2.12 Ascensia
- 17.2.12.1. Overview
- 17.2.12.2. Products
- 17.2.12.3. SWOT Analysis
- 17.2.12.4. Recent Developments
- 17.2.12.5. Financials (Based on Availability)
- 17.2.1 Other
List of Figures
- Figure 1: Global Self-Monitoring Blood Glucose Industry Revenue Breakdown (Million, %) by Region 2024 & 2032
- Figure 2: North America Self-Monitoring Blood Glucose Industry Revenue (Million), by Country 2024 & 2032
- Figure 3: North America Self-Monitoring Blood Glucose Industry Revenue Share (%), by Country 2024 & 2032
- Figure 4: Europe Self-Monitoring Blood Glucose Industry Revenue (Million), by Country 2024 & 2032
- Figure 5: Europe Self-Monitoring Blood Glucose Industry Revenue Share (%), by Country 2024 & 2032
- Figure 6: Asia Pacific Self-Monitoring Blood Glucose Industry Revenue (Million), by Country 2024 & 2032
- Figure 7: Asia Pacific Self-Monitoring Blood Glucose Industry Revenue Share (%), by Country 2024 & 2032
- Figure 8: South America Self-Monitoring Blood Glucose Industry Revenue (Million), by Country 2024 & 2032
- Figure 9: South America Self-Monitoring Blood Glucose Industry Revenue Share (%), by Country 2024 & 2032
- Figure 10: MEA Self-Monitoring Blood Glucose Industry Revenue (Million), by Country 2024 & 2032
- Figure 11: MEA Self-Monitoring Blood Glucose Industry Revenue Share (%), by Country 2024 & 2032
- Figure 12: North America Self-Monitoring Blood Glucose Industry Revenue (Million), by Component 2024 & 2032
- Figure 13: North America Self-Monitoring Blood Glucose Industry Revenue Share (%), by Component 2024 & 2032
- Figure 14: North America Self-Monitoring Blood Glucose Industry Revenue (Million), by End User 2024 & 2032
- Figure 15: North America Self-Monitoring Blood Glucose Industry Revenue Share (%), by End User 2024 & 2032
- Figure 16: North America Self-Monitoring Blood Glucose Industry Revenue (Million), by Country 2024 & 2032
- Figure 17: North America Self-Monitoring Blood Glucose Industry Revenue Share (%), by Country 2024 & 2032
- Figure 18: Europe Self-Monitoring Blood Glucose Industry Revenue (Million), by Component 2024 & 2032
- Figure 19: Europe Self-Monitoring Blood Glucose Industry Revenue Share (%), by Component 2024 & 2032
- Figure 20: Europe Self-Monitoring Blood Glucose Industry Revenue (Million), by End User 2024 & 2032
- Figure 21: Europe Self-Monitoring Blood Glucose Industry Revenue Share (%), by End User 2024 & 2032
- Figure 22: Europe Self-Monitoring Blood Glucose Industry Revenue (Million), by Country 2024 & 2032
- Figure 23: Europe Self-Monitoring Blood Glucose Industry Revenue Share (%), by Country 2024 & 2032
- Figure 24: Latin America Self-Monitoring Blood Glucose Industry Revenue (Million), by Component 2024 & 2032
- Figure 25: Latin America Self-Monitoring Blood Glucose Industry Revenue Share (%), by Component 2024 & 2032
- Figure 26: Latin America Self-Monitoring Blood Glucose Industry Revenue (Million), by End User 2024 & 2032
- Figure 27: Latin America Self-Monitoring Blood Glucose Industry Revenue Share (%), by End User 2024 & 2032
- Figure 28: Latin America Self-Monitoring Blood Glucose Industry Revenue (Million), by Country 2024 & 2032
- Figure 29: Latin America Self-Monitoring Blood Glucose Industry Revenue Share (%), by Country 2024 & 2032
- Figure 30: Asia Pacific Self-Monitoring Blood Glucose Industry Revenue (Million), by Component 2024 & 2032
- Figure 31: Asia Pacific Self-Monitoring Blood Glucose Industry Revenue Share (%), by Component 2024 & 2032
- Figure 32: Asia Pacific Self-Monitoring Blood Glucose Industry Revenue (Million), by End User 2024 & 2032
- Figure 33: Asia Pacific Self-Monitoring Blood Glucose Industry Revenue Share (%), by End User 2024 & 2032
- Figure 34: Asia Pacific Self-Monitoring Blood Glucose Industry Revenue (Million), by Country 2024 & 2032
- Figure 35: Asia Pacific Self-Monitoring Blood Glucose Industry Revenue Share (%), by Country 2024 & 2032
- Figure 36: Middle East Self-Monitoring Blood Glucose Industry Revenue (Million), by Component 2024 & 2032
- Figure 37: Middle East Self-Monitoring Blood Glucose Industry Revenue Share (%), by Component 2024 & 2032
- Figure 38: Middle East Self-Monitoring Blood Glucose Industry Revenue (Million), by End User 2024 & 2032
- Figure 39: Middle East Self-Monitoring Blood Glucose Industry Revenue Share (%), by End User 2024 & 2032
- Figure 40: Middle East Self-Monitoring Blood Glucose Industry Revenue (Million), by Country 2024 & 2032
- Figure 41: Middle East Self-Monitoring Blood Glucose Industry Revenue Share (%), by Country 2024 & 2032
- Figure 42: Saudi Arabia Self-Monitoring Blood Glucose Industry Revenue (Million), by Component 2024 & 2032
- Figure 43: Saudi Arabia Self-Monitoring Blood Glucose Industry Revenue Share (%), by Component 2024 & 2032
- Figure 44: Saudi Arabia Self-Monitoring Blood Glucose Industry Revenue (Million), by End User 2024 & 2032
- Figure 45: Saudi Arabia Self-Monitoring Blood Glucose Industry Revenue Share (%), by End User 2024 & 2032
- Figure 46: Saudi Arabia Self-Monitoring Blood Glucose Industry Revenue (Million), by Country 2024 & 2032
- Figure 47: Saudi Arabia Self-Monitoring Blood Glucose Industry Revenue Share (%), by Country 2024 & 2032
List of Tables
- Table 1: Global Self-Monitoring Blood Glucose Industry Revenue Million Forecast, by Region 2019 & 2032
- Table 2: Global Self-Monitoring Blood Glucose Industry Revenue Million Forecast, by Component 2019 & 2032
- Table 3: Global Self-Monitoring Blood Glucose Industry Revenue Million Forecast, by End User 2019 & 2032
- Table 4: Global Self-Monitoring Blood Glucose Industry Revenue Million Forecast, by Region 2019 & 2032
- Table 5: Global Self-Monitoring Blood Glucose Industry Revenue Million Forecast, by Country 2019 & 2032
- Table 6: United States Self-Monitoring Blood Glucose Industry Revenue (Million) Forecast, by Application 2019 & 2032
- Table 7: Canada Self-Monitoring Blood Glucose Industry Revenue (Million) Forecast, by Application 2019 & 2032
- Table 8: Mexico Self-Monitoring Blood Glucose Industry Revenue (Million) Forecast, by Application 2019 & 2032
- Table 9: Global Self-Monitoring Blood Glucose Industry Revenue Million Forecast, by Country 2019 & 2032
- Table 10: Germany Self-Monitoring Blood Glucose Industry Revenue (Million) Forecast, by Application 2019 & 2032
- Table 11: United Kingdom Self-Monitoring Blood Glucose Industry Revenue (Million) Forecast, by Application 2019 & 2032
- Table 12: France Self-Monitoring Blood Glucose Industry Revenue (Million) Forecast, by Application 2019 & 2032
- Table 13: Spain Self-Monitoring Blood Glucose Industry Revenue (Million) Forecast, by Application 2019 & 2032
- Table 14: Italy Self-Monitoring Blood Glucose Industry Revenue (Million) Forecast, by Application 2019 & 2032
- Table 15: Spain Self-Monitoring Blood Glucose Industry Revenue (Million) Forecast, by Application 2019 & 2032
- Table 16: Belgium Self-Monitoring Blood Glucose Industry Revenue (Million) Forecast, by Application 2019 & 2032
- Table 17: Netherland Self-Monitoring Blood Glucose Industry Revenue (Million) Forecast, by Application 2019 & 2032
- Table 18: Nordics Self-Monitoring Blood Glucose Industry Revenue (Million) Forecast, by Application 2019 & 2032
- Table 19: Rest of Europe Self-Monitoring Blood Glucose Industry Revenue (Million) Forecast, by Application 2019 & 2032
- Table 20: Global Self-Monitoring Blood Glucose Industry Revenue Million Forecast, by Country 2019 & 2032
- Table 21: China Self-Monitoring Blood Glucose Industry Revenue (Million) Forecast, by Application 2019 & 2032
- Table 22: Japan Self-Monitoring Blood Glucose Industry Revenue (Million) Forecast, by Application 2019 & 2032
- Table 23: India Self-Monitoring Blood Glucose Industry Revenue (Million) Forecast, by Application 2019 & 2032
- Table 24: South Korea Self-Monitoring Blood Glucose Industry Revenue (Million) Forecast, by Application 2019 & 2032
- Table 25: Southeast Asia Self-Monitoring Blood Glucose Industry Revenue (Million) Forecast, by Application 2019 & 2032
- Table 26: Australia Self-Monitoring Blood Glucose Industry Revenue (Million) Forecast, by Application 2019 & 2032
- Table 27: Indonesia Self-Monitoring Blood Glucose Industry Revenue (Million) Forecast, by Application 2019 & 2032
- Table 28: Phillipes Self-Monitoring Blood Glucose Industry Revenue (Million) Forecast, by Application 2019 & 2032
- Table 29: Singapore Self-Monitoring Blood Glucose Industry Revenue (Million) Forecast, by Application 2019 & 2032
- Table 30: Thailandc Self-Monitoring Blood Glucose Industry Revenue (Million) Forecast, by Application 2019 & 2032
- Table 31: Rest of Asia Pacific Self-Monitoring Blood Glucose Industry Revenue (Million) Forecast, by Application 2019 & 2032
- Table 32: Global Self-Monitoring Blood Glucose Industry Revenue Million Forecast, by Country 2019 & 2032
- Table 33: Brazil Self-Monitoring Blood Glucose Industry Revenue (Million) Forecast, by Application 2019 & 2032
- Table 34: Argentina Self-Monitoring Blood Glucose Industry Revenue (Million) Forecast, by Application 2019 & 2032
- Table 35: Peru Self-Monitoring Blood Glucose Industry Revenue (Million) Forecast, by Application 2019 & 2032
- Table 36: Chile Self-Monitoring Blood Glucose Industry Revenue (Million) Forecast, by Application 2019 & 2032
- Table 37: Colombia Self-Monitoring Blood Glucose Industry Revenue (Million) Forecast, by Application 2019 & 2032
- Table 38: Ecuador Self-Monitoring Blood Glucose Industry Revenue (Million) Forecast, by Application 2019 & 2032
- Table 39: Venezuela Self-Monitoring Blood Glucose Industry Revenue (Million) Forecast, by Application 2019 & 2032
- Table 40: Rest of South America Self-Monitoring Blood Glucose Industry Revenue (Million) Forecast, by Application 2019 & 2032
- Table 41: Global Self-Monitoring Blood Glucose Industry Revenue Million Forecast, by Country 2019 & 2032
- Table 42: United Arab Emirates Self-Monitoring Blood Glucose Industry Revenue (Million) Forecast, by Application 2019 & 2032
- Table 43: Saudi Arabia Self-Monitoring Blood Glucose Industry Revenue (Million) Forecast, by Application 2019 & 2032
- Table 44: South Africa Self-Monitoring Blood Glucose Industry Revenue (Million) Forecast, by Application 2019 & 2032
- Table 45: Rest of Middle East and Africa Self-Monitoring Blood Glucose Industry Revenue (Million) Forecast, by Application 2019 & 2032
- Table 46: Global Self-Monitoring Blood Glucose Industry Revenue Million Forecast, by Component 2019 & 2032
- Table 47: Global Self-Monitoring Blood Glucose Industry Revenue Million Forecast, by End User 2019 & 2032
- Table 48: Global Self-Monitoring Blood Glucose Industry Revenue Million Forecast, by Country 2019 & 2032
- Table 49: United States Self-Monitoring Blood Glucose Industry Revenue (Million) Forecast, by Application 2019 & 2032
- Table 50: Canada Self-Monitoring Blood Glucose Industry Revenue (Million) Forecast, by Application 2019 & 2032
- Table 51: Rest of North America Self-Monitoring Blood Glucose Industry Revenue (Million) Forecast, by Application 2019 & 2032
- Table 52: Global Self-Monitoring Blood Glucose Industry Revenue Million Forecast, by Component 2019 & 2032
- Table 53: Global Self-Monitoring Blood Glucose Industry Revenue Million Forecast, by End User 2019 & 2032
- Table 54: Global Self-Monitoring Blood Glucose Industry Revenue Million Forecast, by Country 2019 & 2032
- Table 55: France Self-Monitoring Blood Glucose Industry Revenue (Million) Forecast, by Application 2019 & 2032
- Table 56: Germany Self-Monitoring Blood Glucose Industry Revenue (Million) Forecast, by Application 2019 & 2032
- Table 57: Italy Self-Monitoring Blood Glucose Industry Revenue (Million) Forecast, by Application 2019 & 2032
- Table 58: Spain Self-Monitoring Blood Glucose Industry Revenue (Million) Forecast, by Application 2019 & 2032
- Table 59: United Kingdom Self-Monitoring Blood Glucose Industry Revenue (Million) Forecast, by Application 2019 & 2032
- Table 60: Russia Self-Monitoring Blood Glucose Industry Revenue (Million) Forecast, by Application 2019 & 2032
- Table 61: Rest of Europe Self-Monitoring Blood Glucose Industry Revenue (Million) Forecast, by Application 2019 & 2032
- Table 62: Global Self-Monitoring Blood Glucose Industry Revenue Million Forecast, by Component 2019 & 2032
- Table 63: Global Self-Monitoring Blood Glucose Industry Revenue Million Forecast, by End User 2019 & 2032
- Table 64: Global Self-Monitoring Blood Glucose Industry Revenue Million Forecast, by Country 2019 & 2032
- Table 65: Mexico Self-Monitoring Blood Glucose Industry Revenue (Million) Forecast, by Application 2019 & 2032
- Table 66: Brazil Self-Monitoring Blood Glucose Industry Revenue (Million) Forecast, by Application 2019 & 2032
- Table 67: Rest of Latin America Self-Monitoring Blood Glucose Industry Revenue (Million) Forecast, by Application 2019 & 2032
- Table 68: Global Self-Monitoring Blood Glucose Industry Revenue Million Forecast, by Component 2019 & 2032
- Table 69: Global Self-Monitoring Blood Glucose Industry Revenue Million Forecast, by End User 2019 & 2032
- Table 70: Global Self-Monitoring Blood Glucose Industry Revenue Million Forecast, by Country 2019 & 2032
- Table 71: Japan Self-Monitoring Blood Glucose Industry Revenue (Million) Forecast, by Application 2019 & 2032
- Table 72: South Korea Self-Monitoring Blood Glucose Industry Revenue (Million) Forecast, by Application 2019 & 2032
- Table 73: China Self-Monitoring Blood Glucose Industry Revenue (Million) Forecast, by Application 2019 & 2032
- Table 74: India Self-Monitoring Blood Glucose Industry Revenue (Million) Forecast, by Application 2019 & 2032
- Table 75: Australia Self-Monitoring Blood Glucose Industry Revenue (Million) Forecast, by Application 2019 & 2032
- Table 76: Vietnam Self-Monitoring Blood Glucose Industry Revenue (Million) Forecast, by Application 2019 & 2032
- Table 77: Malaysia Self-Monitoring Blood Glucose Industry Revenue (Million) Forecast, by Application 2019 & 2032
- Table 78: Indonesia Self-Monitoring Blood Glucose Industry Revenue (Million) Forecast, by Application 2019 & 2032
- Table 79: Philippines Self-Monitoring Blood Glucose Industry Revenue (Million) Forecast, by Application 2019 & 2032
- Table 80: Thailand Self-Monitoring Blood Glucose Industry Revenue (Million) Forecast, by Application 2019 & 2032
- Table 81: Rest of Asia Pacific Self-Monitoring Blood Glucose Industry Revenue (Million) Forecast, by Application 2019 & 2032
- Table 82: Global Self-Monitoring Blood Glucose Industry Revenue Million Forecast, by Component 2019 & 2032
- Table 83: Global Self-Monitoring Blood Glucose Industry Revenue Million Forecast, by End User 2019 & 2032
- Table 84: Global Self-Monitoring Blood Glucose Industry Revenue Million Forecast, by Country 2019 & 2032
- Table 85: Global Self-Monitoring Blood Glucose Industry Revenue Million Forecast, by Component 2019 & 2032
- Table 86: Global Self-Monitoring Blood Glucose Industry Revenue Million Forecast, by End User 2019 & 2032
- Table 87: Global Self-Monitoring Blood Glucose Industry Revenue Million Forecast, by Country 2019 & 2032
- Table 88: Iran Self-Monitoring Blood Glucose Industry Revenue (Million) Forecast, by Application 2019 & 2032
- Table 89: Egypt Self-Monitoring Blood Glucose Industry Revenue (Million) Forecast, by Application 2019 & 2032
- Table 90: Oman Self-Monitoring Blood Glucose Industry Revenue (Million) Forecast, by Application 2019 & 2032
- Table 91: South Africa Self-Monitoring Blood Glucose Industry Revenue (Million) Forecast, by Application 2019 & 2032
- Table 92: Rest of Middle East Self-Monitoring Blood Glucose Industry Revenue (Million) Forecast, by Application 2019 & 2032
Frequently Asked Questions
1. What is the projected Compound Annual Growth Rate (CAGR) of the Self-Monitoring Blood Glucose Industry?
The projected CAGR is approximately 6.23%.
2. Which companies are prominent players in the Self-Monitoring Blood Glucose Industry?
Key companies in the market include Other, Medisana, Trivida, Acon, Rossmax*List Not Exhaustive 7 2 COMPANY SHARE ANALYSIS, Agamatrix Inc, F Hoffmann-La Roche AG, Abbott, Bionime Corporation, Arkray, LifeScan, Ascensia.
3. What are the main segments of the Self-Monitoring Blood Glucose Industry?
The market segments include Component, End User.
4. Can you provide details about the market size?
The market size is estimated to be USD 14.56 Million as of 2022.
5. What are some drivers contributing to market growth?
Rising Prevalence of Cancer Worldwide; Technological Advancements in Diagnostic Testing; Increasing Demand for Point-of-care Treatment.
6. What are the notable trends driving market growth?
The Glucometer Devices Segment is Expected to Witness the Highest CAGR.
7. Are there any restraints impacting market growth?
High Cost of Molecular Diagnostic Tests; Lack of Skilled Workforce and Stringent Regulatory Framework.
8. Can you provide examples of recent developments in the market?
June 2022: LifeScan announced that the peer-reviewed journal Diabetes Technology and Therapeutics (DTT) published Real World Evidence of Improved Glycemic Control in People with Diabetes using a Bluetooth-connected Blood Glucose Meter with Mobile Diabetes Management Application using the OneTouch Reveal mobile app with the OneTouch Verio Reflect meter which can be synced via the Bluetooth wireless technology. It could support improved glycemic control for people with diabetes.
9. What pricing options are available for accessing the report?
Pricing options include single-user, multi-user, and enterprise licenses priced at USD 4750, USD 5250, and USD 8750 respectively.
10. Is the market size provided in terms of value or volume?
The market size is provided in terms of value, measured in Million.
11. Are there any specific market keywords associated with the report?
Yes, the market keyword associated with the report is "Self-Monitoring Blood Glucose Industry," which aids in identifying and referencing the specific market segment covered.
12. How do I determine which pricing option suits my needs best?
The pricing options vary based on user requirements and access needs. Individual users may opt for single-user licenses, while businesses requiring broader access may choose multi-user or enterprise licenses for cost-effective access to the report.
13. Are there any additional resources or data provided in the Self-Monitoring Blood Glucose Industry report?
While the report offers comprehensive insights, it's advisable to review the specific contents or supplementary materials provided to ascertain if additional resources or data are available.
14. How can I stay updated on further developments or reports in the Self-Monitoring Blood Glucose Industry?
To stay informed about further developments, trends, and reports in the Self-Monitoring Blood Glucose Industry, consider subscribing to industry newsletters, following relevant companies and organizations, or regularly checking reputable industry news sources and publications.
Methodology
Step 1 - Identification of Relevant Samples Size from Population Database


Step 2 - Approaches for Defining Global Market Size (Value, Volume* & Price*)

Note*: In applicable scenarios
Step 3 - Data Sources
Primary Research
- Web Analytics
- Survey Reports
- Research Institute
- Latest Research Reports
- Opinion Leaders
Secondary Research
- Annual Reports
- White Paper
- Latest Press Release
- Industry Association
- Paid Database
- Investor Presentations

Step 4 - Data Triangulation
Involves using different sources of information in order to increase the validity of a study
These sources are likely to be stakeholders in a program - participants, other researchers, program staff, other community members, and so on.
Then we put all data in single framework & apply various statistical tools to find out the dynamic on the market.
During the analysis stage, feedback from the stakeholder groups would be compared to determine areas of agreement as well as areas of divergence


