
Key Insights
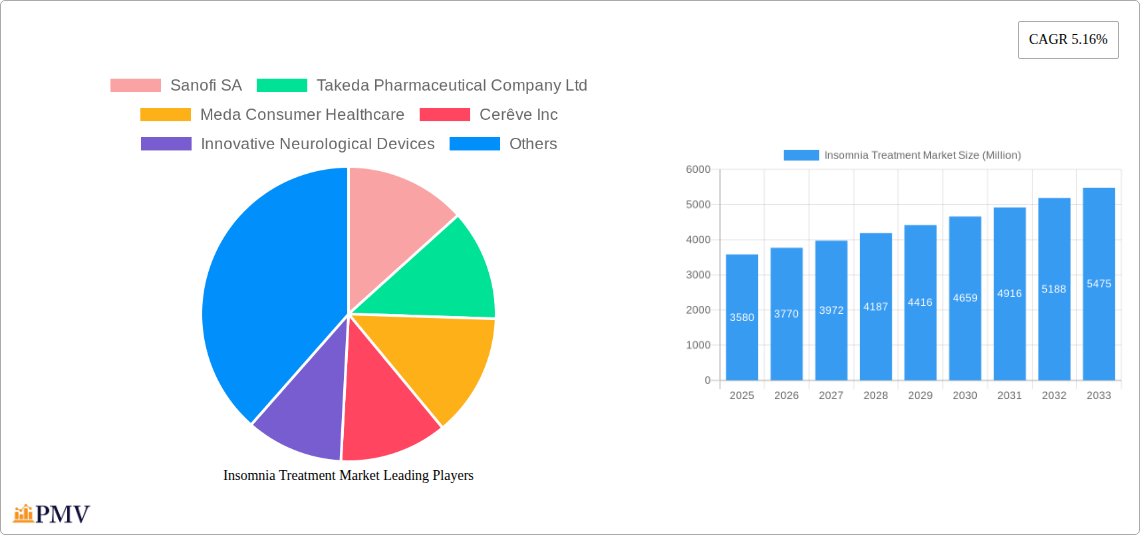
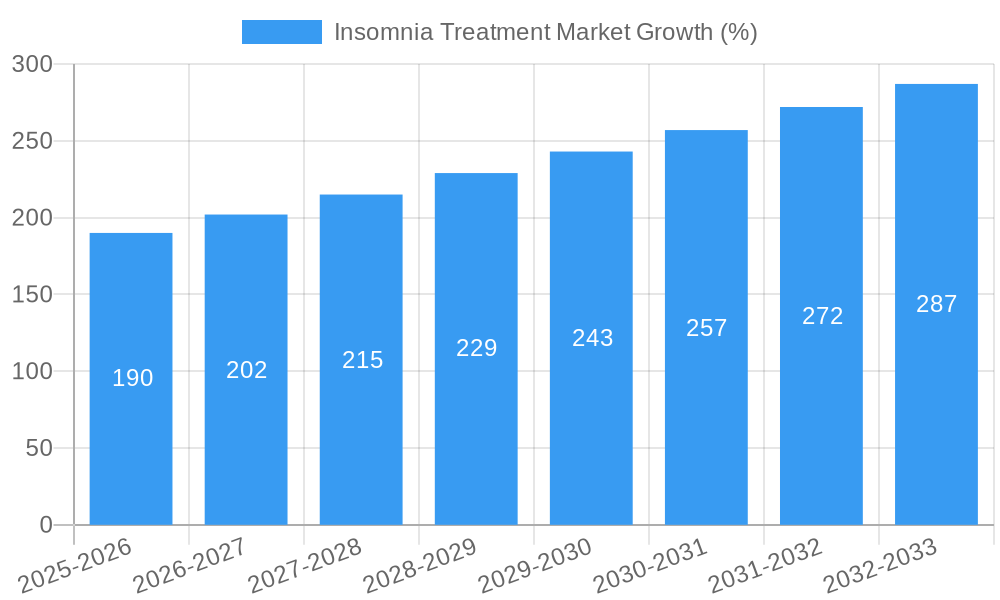
The global insomnia treatment market, valued at $3.58 billion in 2025, is projected to experience robust growth, exhibiting a Compound Annual Growth Rate (CAGR) of 5.16% from 2025 to 2033. This expansion is driven by several key factors. The rising prevalence of insomnia, fueled by increased stress levels, changing lifestyles, and aging populations globally, is a primary driver. Furthermore, advancements in pharmacological treatments, including the development of novel non-benzodiazepine hypnotics and improved formulations of existing medications, are contributing significantly to market growth. Increased awareness of insomnia as a treatable condition and the growing acceptance of both pharmacological and non-pharmacological therapies (such as cognitive behavioral therapy for insomnia or CBT-I) also play a substantial role. Market segmentation reveals that the drug segment holds a larger share compared to devices, reflecting the current reliance on pharmaceutical interventions for insomnia management. Hospital pharmacies constitute a significant distribution channel, highlighting the importance of institutional settings in treatment delivery. However, the market faces certain restraints, including the potential for side effects associated with some medications, the high cost of certain treatments limiting access for some populations, and the growing interest in exploring and implementing alternative, natural sleep remedies.
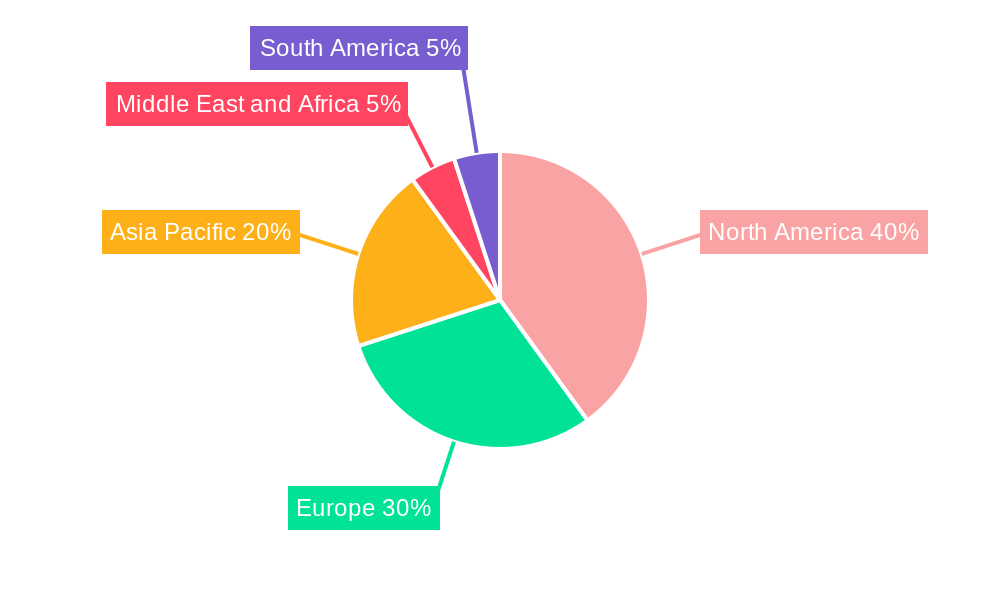
Geographical analysis reveals strong market presence across North America and Europe, driven by higher healthcare expenditure and greater awareness of treatment options. Asia Pacific is projected to witness significant growth during the forecast period, fueled by increasing disposable incomes, rising awareness, and a growing middle class with improved access to healthcare. Competition in the market is intense, with major pharmaceutical companies such as Sanofi SA, Takeda Pharmaceutical Company Ltd, and Pfizer Inc actively involved in research and development, as well as market expansion strategies. The market is expected to see increased consolidation through mergers and acquisitions, and a focus on developing more personalized and effective treatment options that address the diverse needs of the insomnia patient population. The continued research into improved therapies, combined with heightened public awareness, will be key factors influencing future market trajectory.
This comprehensive report provides an in-depth analysis of the Insomnia Treatment Market, encompassing market size, growth drivers, competitive landscape, and future outlook. The study period covers 2019-2033, with 2025 as the base and estimated year. The forecast period spans 2025-2033, and the historical period analyzed is 2019-2024. The market is segmented by treatment type (By Drug, Other Drugs, Devices), and distribution channel (Hospital Pharmacies, Retail Pharmacies, Other Distribution Channels). The report is invaluable for industry stakeholders, investors, and researchers seeking actionable insights into this dynamic market. The global Insomnia Treatment Market is estimated to reach xx Million by 2033.
Insomnia Treatment Market Market Structure & Competitive Dynamics
The Insomnia Treatment Market exhibits a moderately concentrated structure, with a handful of large pharmaceutical companies holding significant market share. The market is characterized by a dynamic innovation ecosystem, driven by ongoing research and development in novel therapies and devices. Stringent regulatory frameworks, particularly from agencies like the FDA and EMA, heavily influence market entry and product approvals. The market also faces competition from various alternative treatments, including lifestyle changes and complementary therapies. End-user preferences are shifting towards more convenient and effective treatment options, fueling demand for innovative solutions. Mergers and acquisitions (M&A) activity plays a crucial role in shaping the competitive landscape, with larger companies acquiring smaller innovative firms to expand their product portfolios.
- Market Concentration: The top 5 players hold an estimated xx% market share in 2025.
- M&A Activity: Between 2019 and 2024, the total value of M&A deals in the Insomnia Treatment Market was approximately xx Million. Key deals included [mention specific deals if available, otherwise use "several significant acquisitions driving market consolidation"].
- Innovation Ecosystem: Significant investments in R&D are driving the development of new drugs and devices, with a focus on improved efficacy and reduced side effects.
- Regulatory Landscape: Stringent regulatory pathways pose challenges for new market entrants, impacting market dynamics and affecting the speed of innovation.
Insomnia Treatment Market Industry Trends & Insights
The Insomnia Treatment Market is experiencing substantial growth, driven by several key factors. The rising prevalence of insomnia globally, coupled with an increasing awareness of its impact on overall health and well-being, is a major driver. Technological advancements in drug development and device innovation are leading to the introduction of more effective and convenient treatments. Changing consumer preferences towards personalized medicine and non-pharmacological approaches are also influencing market growth. The competitive landscape remains dynamic, with ongoing competition among established players and the emergence of new market entrants.
The market is expected to experience a Compound Annual Growth Rate (CAGR) of xx% during the forecast period (2025-2033). This growth reflects the increasing adoption of effective treatment solutions, alongside the rising awareness regarding the impacts of untreated insomnia. Market penetration is estimated at xx% in 2025, with significant potential for further growth in underserved markets.
Dominant Markets & Segments in Insomnia Treatment Market
The North American region currently dominates the Insomnia Treatment Market, driven by factors such as high healthcare expenditure, a large aging population, and strong regulatory support for new therapies. Within North America, the United States holds the largest market share.
- By Treatment Type: The drug segment currently dominates, with significant growth expected for both prescription and over-the-counter drugs. The device segment, including sleep aids and apps, is showing promising growth.
- By Distribution Channel: Retail pharmacies constitute the largest distribution channel, followed by hospital pharmacies. Other distribution channels such as online pharmacies are gaining traction.
Key Drivers of Regional Dominance (North America):
- High healthcare spending and insurance coverage.
- Large and aging population susceptible to insomnia.
- Robust regulatory framework supporting innovation.
- High awareness and acceptance of treatment options.
Insomnia Treatment Market Product Innovations
Recent years have witnessed significant advancements in insomnia treatment, marked by the introduction of novel drug mechanisms, such as selective orexin receptor antagonists. There's a growing focus on developing personalized treatments tailored to individual patient needs and comorbidities, moving beyond one-size-fits-all solutions. Innovative digital therapeutics, using mobile applications and wearables to monitor sleep patterns and deliver tailored interventions are also gaining popularity. This shift toward more personalized and tech-enabled solutions is revolutionizing the market and creating new competitive advantages for companies.
Report Segmentation & Scope
This report segments the Insomnia Treatment Market based on treatment type and distribution channel.
By Treatment Type: The market is categorized into prescription drugs (including hypnotics, antidepressants, and others), over-the-counter drugs (including melatonin and herbal remedies), and medical devices (including CPAP machines and sleep trackers). Growth projections for these segments vary, with the prescription drug segment anticipated to maintain significant growth, while the device segment experiences an accelerating CAGR. Competitive dynamics are shaped by the balance between established players and innovative startups.
By Distribution Channel: The market is segmented into hospital pharmacies, retail pharmacies, and online/other distribution channels. Retail pharmacies currently hold the largest market share, driven by high accessibility and convenience. Online channels are rapidly expanding, fueled by increasing internet penetration and the rising preference for home delivery services. Hospital pharmacies focus largely on inpatient treatment and specialty insomnia medications. Each segment exhibits unique competitive dynamics and growth potentials.
Key Drivers of Insomnia Treatment Market Growth
Several key factors are driving the growth of the Insomnia Treatment Market. The rising prevalence of insomnia due to stressful lifestyles and aging populations globally is a significant factor. Technological advancements leading to new and effective treatments are also contributing to market expansion. Increased awareness campaigns raising public awareness and reducing the stigma around seeking help for sleep disorders are influencing market growth. Favorable regulatory policies promoting innovation in the pharmaceutical and medical device sectors provide a fertile ground for the market’s expansion.
Challenges in the Insomnia Treatment Market Sector
The Insomnia Treatment Market faces several challenges, including the high cost of new drugs and devices, creating accessibility issues for patients. The development and approval process for new drugs can be lengthy and complex, delaying market entry. Competition from alternative therapies and complementary medicine poses another challenge. Potential side effects associated with some insomnia treatments can also hinder market growth and patient adoption. Supply chain disruptions can impact the availability of treatment options, affecting patients.
Leading Players in the Insomnia Treatment Market Market
- Sanofi SA
- Takeda Pharmaceutical Company Ltd
- Meda Consumer Healthcare
- Cerêve Inc
- Innovative Neurological Devices
- Pernix Therapeutics
- Eisai Co Ltd
- Ebb Therapeutics
- Electromedical Products International Inc
- Merck & Co
- Purdue Pharma LP
- Paratek Pharmaceuticals Inc
- Pfizer Inc
Key Developments in Insomnia Treatment Market Sector
- January 2022: Idorsia received approval from the US Food and Drug Administration for QUVIVIQ 25 and 50 mg for the treatment of adults with insomnia, characterized by difficulties with sleep onset and/or sleep maintenance. This approval significantly expanded market access for a novel insomnia treatment.
- May 2022: Idorsia Ltd received marketing authorization from the European Commission for QUVIVIQ, indicated for adult patients with insomnia (symptoms present for at least three months and considerable impact on daytime functioning). This broadened the drug's market reach within the EU.
- February 2024: Nivasorexant (ACT-539313), the first selective orexin-1 receptor antagonist (SO1RA), was investigated during clinical trials. Successful completion of these trials could introduce a new mechanism of action for insomnia treatment, altering market dynamics.
Strategic Insomnia Treatment Market Market Outlook
The Insomnia Treatment Market holds significant future potential, driven by an aging global population, increased prevalence of sleep disorders, and continued advancements in treatment modalities. Strategic opportunities exist for companies focusing on developing personalized medicine approaches, leveraging digital therapeutics, and expanding into underserved markets. Companies prioritizing R&D investment in novel drug mechanisms and device technologies are poised to capture significant market share. Partnerships and collaborations across the industry are expected to become increasingly prevalent to enhance efficiency and accelerate the development of new treatments.
Insomnia Treatment Market Segmentation
-
1. Treatment Type
-
1.1. By Drug
- 1.1.1. Benzodiazepines
- 1.1.2. Nonbenzodiazepines
- 1.1.3. Orexin Antagonist
- 1.1.4. Other Drugs
- 1.2. Devices
-
1.1. By Drug
-
2. Distribution Channel
- 2.1. Hospital Pharmacies
- 2.2. Retail Pharmacies
- 2.3. Other Distribution Channels
Insomnia Treatment Market Segmentation By Geography
-
1. North America
- 1.1. United States
- 1.2. Canada
- 1.3. Mexico
-
2. Europe
- 2.1. Germany
- 2.2. United Kingdom
- 2.3. France
- 2.4. Italy
- 2.5. Spain
- 2.6. Rest of Europe
-
3. Asia Pacific
- 3.1. China
- 3.2. Japan
- 3.3. India
- 3.4. Australia
- 3.5. South Korea
- 3.6. Rest of Asia Pacific
-
4. Middle East and Africa
- 4.1. GCC
- 4.2. South Africa
- 4.3. Rest of Middle East and Africa
-
5. South America
- 5.1. Brazil
- 5.2. Argentina
- 5.3. Rest of South America
Insomnia Treatment Market REPORT HIGHLIGHTS
| Aspects | Details |
|---|---|
| Study Period | 2019-2033 |
| Base Year | 2024 |
| Estimated Year | 2025 |
| Forecast Period | 2025-2033 |
| Historical Period | 2019-2024 |
| Growth Rate | CAGR of 5.16% from 2019-2033 |
| Segmentation |
|
Table of Contents
- 1. Introduction
- 1.1. Research Scope
- 1.2. Market Segmentation
- 1.3. Research Methodology
- 1.4. Definitions and Assumptions
- 2. Executive Summary
- 2.1. Introduction
- 3. Market Dynamics
- 3.1. Introduction
- 3.2. Market Drivers
- 3.2.1. Increasing Stress Due to Highly Active Lifestyles of Individuals; Side Effects Due to Certain OTC and Prescription Medication; High Usage of Media Devices Before Sleep
- 3.3. Market Restrains
- 3.3.1. Misconceptions about the Seriousness of Insomnia; Patient Non-adherence due to Characteristic Side Effects of Insomnia Drugs
- 3.4. Market Trends
- 3.4.1. Orexin Antagonist Segment is Expected to Hold a Significant Share in the Market During the Forecast Period
- 4. Market Factor Analysis
- 4.1. Porters Five Forces
- 4.2. Supply/Value Chain
- 4.3. PESTEL analysis
- 4.4. Market Entropy
- 4.5. Patent/Trademark Analysis
- 5. Global Insomnia Treatment Market Analysis, Insights and Forecast, 2019-2031
- 5.1. Market Analysis, Insights and Forecast - by Treatment Type
- 5.1.1. By Drug
- 5.1.1.1. Benzodiazepines
- 5.1.1.2. Nonbenzodiazepines
- 5.1.1.3. Orexin Antagonist
- 5.1.1.4. Other Drugs
- 5.1.2. Devices
- 5.1.1. By Drug
- 5.2. Market Analysis, Insights and Forecast - by Distribution Channel
- 5.2.1. Hospital Pharmacies
- 5.2.2. Retail Pharmacies
- 5.2.3. Other Distribution Channels
- 5.3. Market Analysis, Insights and Forecast - by Region
- 5.3.1. North America
- 5.3.2. Europe
- 5.3.3. Asia Pacific
- 5.3.4. Middle East and Africa
- 5.3.5. South America
- 5.1. Market Analysis, Insights and Forecast - by Treatment Type
- 6. North America Insomnia Treatment Market Analysis, Insights and Forecast, 2019-2031
- 6.1. Market Analysis, Insights and Forecast - by Treatment Type
- 6.1.1. By Drug
- 6.1.1.1. Benzodiazepines
- 6.1.1.2. Nonbenzodiazepines
- 6.1.1.3. Orexin Antagonist
- 6.1.1.4. Other Drugs
- 6.1.2. Devices
- 6.1.1. By Drug
- 6.2. Market Analysis, Insights and Forecast - by Distribution Channel
- 6.2.1. Hospital Pharmacies
- 6.2.2. Retail Pharmacies
- 6.2.3. Other Distribution Channels
- 6.1. Market Analysis, Insights and Forecast - by Treatment Type
- 7. Europe Insomnia Treatment Market Analysis, Insights and Forecast, 2019-2031
- 7.1. Market Analysis, Insights and Forecast - by Treatment Type
- 7.1.1. By Drug
- 7.1.1.1. Benzodiazepines
- 7.1.1.2. Nonbenzodiazepines
- 7.1.1.3. Orexin Antagonist
- 7.1.1.4. Other Drugs
- 7.1.2. Devices
- 7.1.1. By Drug
- 7.2. Market Analysis, Insights and Forecast - by Distribution Channel
- 7.2.1. Hospital Pharmacies
- 7.2.2. Retail Pharmacies
- 7.2.3. Other Distribution Channels
- 7.1. Market Analysis, Insights and Forecast - by Treatment Type
- 8. Asia Pacific Insomnia Treatment Market Analysis, Insights and Forecast, 2019-2031
- 8.1. Market Analysis, Insights and Forecast - by Treatment Type
- 8.1.1. By Drug
- 8.1.1.1. Benzodiazepines
- 8.1.1.2. Nonbenzodiazepines
- 8.1.1.3. Orexin Antagonist
- 8.1.1.4. Other Drugs
- 8.1.2. Devices
- 8.1.1. By Drug
- 8.2. Market Analysis, Insights and Forecast - by Distribution Channel
- 8.2.1. Hospital Pharmacies
- 8.2.2. Retail Pharmacies
- 8.2.3. Other Distribution Channels
- 8.1. Market Analysis, Insights and Forecast - by Treatment Type
- 9. Middle East and Africa Insomnia Treatment Market Analysis, Insights and Forecast, 2019-2031
- 9.1. Market Analysis, Insights and Forecast - by Treatment Type
- 9.1.1. By Drug
- 9.1.1.1. Benzodiazepines
- 9.1.1.2. Nonbenzodiazepines
- 9.1.1.3. Orexin Antagonist
- 9.1.1.4. Other Drugs
- 9.1.2. Devices
- 9.1.1. By Drug
- 9.2. Market Analysis, Insights and Forecast - by Distribution Channel
- 9.2.1. Hospital Pharmacies
- 9.2.2. Retail Pharmacies
- 9.2.3. Other Distribution Channels
- 9.1. Market Analysis, Insights and Forecast - by Treatment Type
- 10. South America Insomnia Treatment Market Analysis, Insights and Forecast, 2019-2031
- 10.1. Market Analysis, Insights and Forecast - by Treatment Type
- 10.1.1. By Drug
- 10.1.1.1. Benzodiazepines
- 10.1.1.2. Nonbenzodiazepines
- 10.1.1.3. Orexin Antagonist
- 10.1.1.4. Other Drugs
- 10.1.2. Devices
- 10.1.1. By Drug
- 10.2. Market Analysis, Insights and Forecast - by Distribution Channel
- 10.2.1. Hospital Pharmacies
- 10.2.2. Retail Pharmacies
- 10.2.3. Other Distribution Channels
- 10.1. Market Analysis, Insights and Forecast - by Treatment Type
- 11. North America Insomnia Treatment Market Analysis, Insights and Forecast, 2019-2031
- 11.1. Market Analysis, Insights and Forecast - By Country/Sub-region
- 11.1.1 United States
- 11.1.2 Canada
- 11.1.3 Mexico
- 12. Europe Insomnia Treatment Market Analysis, Insights and Forecast, 2019-2031
- 12.1. Market Analysis, Insights and Forecast - By Country/Sub-region
- 12.1.1 Germany
- 12.1.2 United Kingdom
- 12.1.3 France
- 12.1.4 Italy
- 12.1.5 Spain
- 12.1.6 Rest of Europe
- 13. Asia Pacific Insomnia Treatment Market Analysis, Insights and Forecast, 2019-2031
- 13.1. Market Analysis, Insights and Forecast - By Country/Sub-region
- 13.1.1 China
- 13.1.2 Japan
- 13.1.3 India
- 13.1.4 Australia
- 13.1.5 South Korea
- 13.1.6 Rest of Asia Pacific
- 14. Middle East and Africa Insomnia Treatment Market Analysis, Insights and Forecast, 2019-2031
- 14.1. Market Analysis, Insights and Forecast - By Country/Sub-region
- 14.1.1 GCC
- 14.1.2 South Africa
- 14.1.3 Rest of Middle East and Africa
- 15. South America Insomnia Treatment Market Analysis, Insights and Forecast, 2019-2031
- 15.1. Market Analysis, Insights and Forecast - By Country/Sub-region
- 15.1.1 Brazil
- 15.1.2 Argentina
- 15.1.3 Rest of South America
- 16. Competitive Analysis
- 16.1. Global Market Share Analysis 2024
- 16.2. Company Profiles
- 16.2.1 Sanofi SA
- 16.2.1.1. Overview
- 16.2.1.2. Products
- 16.2.1.3. SWOT Analysis
- 16.2.1.4. Recent Developments
- 16.2.1.5. Financials (Based on Availability)
- 16.2.2 Takeda Pharmaceutical Company Ltd
- 16.2.2.1. Overview
- 16.2.2.2. Products
- 16.2.2.3. SWOT Analysis
- 16.2.2.4. Recent Developments
- 16.2.2.5. Financials (Based on Availability)
- 16.2.3 Meda Consumer Healthcare
- 16.2.3.1. Overview
- 16.2.3.2. Products
- 16.2.3.3. SWOT Analysis
- 16.2.3.4. Recent Developments
- 16.2.3.5. Financials (Based on Availability)
- 16.2.4 Cerêve Inc
- 16.2.4.1. Overview
- 16.2.4.2. Products
- 16.2.4.3. SWOT Analysis
- 16.2.4.4. Recent Developments
- 16.2.4.5. Financials (Based on Availability)
- 16.2.5 Innovative Neurological Devices
- 16.2.5.1. Overview
- 16.2.5.2. Products
- 16.2.5.3. SWOT Analysis
- 16.2.5.4. Recent Developments
- 16.2.5.5. Financials (Based on Availability)
- 16.2.6 Pernix Therapeutics
- 16.2.6.1. Overview
- 16.2.6.2. Products
- 16.2.6.3. SWOT Analysis
- 16.2.6.4. Recent Developments
- 16.2.6.5. Financials (Based on Availability)
- 16.2.7 Eisai Co Ltd
- 16.2.7.1. Overview
- 16.2.7.2. Products
- 16.2.7.3. SWOT Analysis
- 16.2.7.4. Recent Developments
- 16.2.7.5. Financials (Based on Availability)
- 16.2.8 Ebb Therapeutics
- 16.2.8.1. Overview
- 16.2.8.2. Products
- 16.2.8.3. SWOT Analysis
- 16.2.8.4. Recent Developments
- 16.2.8.5. Financials (Based on Availability)
- 16.2.9 Electromedical Products International Inc
- 16.2.9.1. Overview
- 16.2.9.2. Products
- 16.2.9.3. SWOT Analysis
- 16.2.9.4. Recent Developments
- 16.2.9.5. Financials (Based on Availability)
- 16.2.10 Merck & Co
- 16.2.10.1. Overview
- 16.2.10.2. Products
- 16.2.10.3. SWOT Analysis
- 16.2.10.4. Recent Developments
- 16.2.10.5. Financials (Based on Availability)
- 16.2.11 Purdue Pharma LP
- 16.2.11.1. Overview
- 16.2.11.2. Products
- 16.2.11.3. SWOT Analysis
- 16.2.11.4. Recent Developments
- 16.2.11.5. Financials (Based on Availability)
- 16.2.12 Paratek Pharmaceuticals Inc
- 16.2.12.1. Overview
- 16.2.12.2. Products
- 16.2.12.3. SWOT Analysis
- 16.2.12.4. Recent Developments
- 16.2.12.5. Financials (Based on Availability)
- 16.2.13 Pfizer Inc
- 16.2.13.1. Overview
- 16.2.13.2. Products
- 16.2.13.3. SWOT Analysis
- 16.2.13.4. Recent Developments
- 16.2.13.5. Financials (Based on Availability)
- 16.2.1 Sanofi SA
List of Figures
- Figure 1: Global Insomnia Treatment Market Revenue Breakdown (Million, %) by Region 2024 & 2032
- Figure 2: Global Insomnia Treatment Market Volume Breakdown (K Unit, %) by Region 2024 & 2032
- Figure 3: North America Insomnia Treatment Market Revenue (Million), by Country 2024 & 2032
- Figure 4: North America Insomnia Treatment Market Volume (K Unit), by Country 2024 & 2032
- Figure 5: North America Insomnia Treatment Market Revenue Share (%), by Country 2024 & 2032
- Figure 6: North America Insomnia Treatment Market Volume Share (%), by Country 2024 & 2032
- Figure 7: Europe Insomnia Treatment Market Revenue (Million), by Country 2024 & 2032
- Figure 8: Europe Insomnia Treatment Market Volume (K Unit), by Country 2024 & 2032
- Figure 9: Europe Insomnia Treatment Market Revenue Share (%), by Country 2024 & 2032
- Figure 10: Europe Insomnia Treatment Market Volume Share (%), by Country 2024 & 2032
- Figure 11: Asia Pacific Insomnia Treatment Market Revenue (Million), by Country 2024 & 2032
- Figure 12: Asia Pacific Insomnia Treatment Market Volume (K Unit), by Country 2024 & 2032
- Figure 13: Asia Pacific Insomnia Treatment Market Revenue Share (%), by Country 2024 & 2032
- Figure 14: Asia Pacific Insomnia Treatment Market Volume Share (%), by Country 2024 & 2032
- Figure 15: Middle East and Africa Insomnia Treatment Market Revenue (Million), by Country 2024 & 2032
- Figure 16: Middle East and Africa Insomnia Treatment Market Volume (K Unit), by Country 2024 & 2032
- Figure 17: Middle East and Africa Insomnia Treatment Market Revenue Share (%), by Country 2024 & 2032
- Figure 18: Middle East and Africa Insomnia Treatment Market Volume Share (%), by Country 2024 & 2032
- Figure 19: South America Insomnia Treatment Market Revenue (Million), by Country 2024 & 2032
- Figure 20: South America Insomnia Treatment Market Volume (K Unit), by Country 2024 & 2032
- Figure 21: South America Insomnia Treatment Market Revenue Share (%), by Country 2024 & 2032
- Figure 22: South America Insomnia Treatment Market Volume Share (%), by Country 2024 & 2032
- Figure 23: North America Insomnia Treatment Market Revenue (Million), by Treatment Type 2024 & 2032
- Figure 24: North America Insomnia Treatment Market Volume (K Unit), by Treatment Type 2024 & 2032
- Figure 25: North America Insomnia Treatment Market Revenue Share (%), by Treatment Type 2024 & 2032
- Figure 26: North America Insomnia Treatment Market Volume Share (%), by Treatment Type 2024 & 2032
- Figure 27: North America Insomnia Treatment Market Revenue (Million), by Distribution Channel 2024 & 2032
- Figure 28: North America Insomnia Treatment Market Volume (K Unit), by Distribution Channel 2024 & 2032
- Figure 29: North America Insomnia Treatment Market Revenue Share (%), by Distribution Channel 2024 & 2032
- Figure 30: North America Insomnia Treatment Market Volume Share (%), by Distribution Channel 2024 & 2032
- Figure 31: North America Insomnia Treatment Market Revenue (Million), by Country 2024 & 2032
- Figure 32: North America Insomnia Treatment Market Volume (K Unit), by Country 2024 & 2032
- Figure 33: North America Insomnia Treatment Market Revenue Share (%), by Country 2024 & 2032
- Figure 34: North America Insomnia Treatment Market Volume Share (%), by Country 2024 & 2032
- Figure 35: Europe Insomnia Treatment Market Revenue (Million), by Treatment Type 2024 & 2032
- Figure 36: Europe Insomnia Treatment Market Volume (K Unit), by Treatment Type 2024 & 2032
- Figure 37: Europe Insomnia Treatment Market Revenue Share (%), by Treatment Type 2024 & 2032
- Figure 38: Europe Insomnia Treatment Market Volume Share (%), by Treatment Type 2024 & 2032
- Figure 39: Europe Insomnia Treatment Market Revenue (Million), by Distribution Channel 2024 & 2032
- Figure 40: Europe Insomnia Treatment Market Volume (K Unit), by Distribution Channel 2024 & 2032
- Figure 41: Europe Insomnia Treatment Market Revenue Share (%), by Distribution Channel 2024 & 2032
- Figure 42: Europe Insomnia Treatment Market Volume Share (%), by Distribution Channel 2024 & 2032
- Figure 43: Europe Insomnia Treatment Market Revenue (Million), by Country 2024 & 2032
- Figure 44: Europe Insomnia Treatment Market Volume (K Unit), by Country 2024 & 2032
- Figure 45: Europe Insomnia Treatment Market Revenue Share (%), by Country 2024 & 2032
- Figure 46: Europe Insomnia Treatment Market Volume Share (%), by Country 2024 & 2032
- Figure 47: Asia Pacific Insomnia Treatment Market Revenue (Million), by Treatment Type 2024 & 2032
- Figure 48: Asia Pacific Insomnia Treatment Market Volume (K Unit), by Treatment Type 2024 & 2032
- Figure 49: Asia Pacific Insomnia Treatment Market Revenue Share (%), by Treatment Type 2024 & 2032
- Figure 50: Asia Pacific Insomnia Treatment Market Volume Share (%), by Treatment Type 2024 & 2032
- Figure 51: Asia Pacific Insomnia Treatment Market Revenue (Million), by Distribution Channel 2024 & 2032
- Figure 52: Asia Pacific Insomnia Treatment Market Volume (K Unit), by Distribution Channel 2024 & 2032
- Figure 53: Asia Pacific Insomnia Treatment Market Revenue Share (%), by Distribution Channel 2024 & 2032
- Figure 54: Asia Pacific Insomnia Treatment Market Volume Share (%), by Distribution Channel 2024 & 2032
- Figure 55: Asia Pacific Insomnia Treatment Market Revenue (Million), by Country 2024 & 2032
- Figure 56: Asia Pacific Insomnia Treatment Market Volume (K Unit), by Country 2024 & 2032
- Figure 57: Asia Pacific Insomnia Treatment Market Revenue Share (%), by Country 2024 & 2032
- Figure 58: Asia Pacific Insomnia Treatment Market Volume Share (%), by Country 2024 & 2032
- Figure 59: Middle East and Africa Insomnia Treatment Market Revenue (Million), by Treatment Type 2024 & 2032
- Figure 60: Middle East and Africa Insomnia Treatment Market Volume (K Unit), by Treatment Type 2024 & 2032
- Figure 61: Middle East and Africa Insomnia Treatment Market Revenue Share (%), by Treatment Type 2024 & 2032
- Figure 62: Middle East and Africa Insomnia Treatment Market Volume Share (%), by Treatment Type 2024 & 2032
- Figure 63: Middle East and Africa Insomnia Treatment Market Revenue (Million), by Distribution Channel 2024 & 2032
- Figure 64: Middle East and Africa Insomnia Treatment Market Volume (K Unit), by Distribution Channel 2024 & 2032
- Figure 65: Middle East and Africa Insomnia Treatment Market Revenue Share (%), by Distribution Channel 2024 & 2032
- Figure 66: Middle East and Africa Insomnia Treatment Market Volume Share (%), by Distribution Channel 2024 & 2032
- Figure 67: Middle East and Africa Insomnia Treatment Market Revenue (Million), by Country 2024 & 2032
- Figure 68: Middle East and Africa Insomnia Treatment Market Volume (K Unit), by Country 2024 & 2032
- Figure 69: Middle East and Africa Insomnia Treatment Market Revenue Share (%), by Country 2024 & 2032
- Figure 70: Middle East and Africa Insomnia Treatment Market Volume Share (%), by Country 2024 & 2032
- Figure 71: South America Insomnia Treatment Market Revenue (Million), by Treatment Type 2024 & 2032
- Figure 72: South America Insomnia Treatment Market Volume (K Unit), by Treatment Type 2024 & 2032
- Figure 73: South America Insomnia Treatment Market Revenue Share (%), by Treatment Type 2024 & 2032
- Figure 74: South America Insomnia Treatment Market Volume Share (%), by Treatment Type 2024 & 2032
- Figure 75: South America Insomnia Treatment Market Revenue (Million), by Distribution Channel 2024 & 2032
- Figure 76: South America Insomnia Treatment Market Volume (K Unit), by Distribution Channel 2024 & 2032
- Figure 77: South America Insomnia Treatment Market Revenue Share (%), by Distribution Channel 2024 & 2032
- Figure 78: South America Insomnia Treatment Market Volume Share (%), by Distribution Channel 2024 & 2032
- Figure 79: South America Insomnia Treatment Market Revenue (Million), by Country 2024 & 2032
- Figure 80: South America Insomnia Treatment Market Volume (K Unit), by Country 2024 & 2032
- Figure 81: South America Insomnia Treatment Market Revenue Share (%), by Country 2024 & 2032
- Figure 82: South America Insomnia Treatment Market Volume Share (%), by Country 2024 & 2032
List of Tables
- Table 1: Global Insomnia Treatment Market Revenue Million Forecast, by Region 2019 & 2032
- Table 2: Global Insomnia Treatment Market Volume K Unit Forecast, by Region 2019 & 2032
- Table 3: Global Insomnia Treatment Market Revenue Million Forecast, by Treatment Type 2019 & 2032
- Table 4: Global Insomnia Treatment Market Volume K Unit Forecast, by Treatment Type 2019 & 2032
- Table 5: Global Insomnia Treatment Market Revenue Million Forecast, by Distribution Channel 2019 & 2032
- Table 6: Global Insomnia Treatment Market Volume K Unit Forecast, by Distribution Channel 2019 & 2032
- Table 7: Global Insomnia Treatment Market Revenue Million Forecast, by Region 2019 & 2032
- Table 8: Global Insomnia Treatment Market Volume K Unit Forecast, by Region 2019 & 2032
- Table 9: Global Insomnia Treatment Market Revenue Million Forecast, by Country 2019 & 2032
- Table 10: Global Insomnia Treatment Market Volume K Unit Forecast, by Country 2019 & 2032
- Table 11: United States Insomnia Treatment Market Revenue (Million) Forecast, by Application 2019 & 2032
- Table 12: United States Insomnia Treatment Market Volume (K Unit) Forecast, by Application 2019 & 2032
- Table 13: Canada Insomnia Treatment Market Revenue (Million) Forecast, by Application 2019 & 2032
- Table 14: Canada Insomnia Treatment Market Volume (K Unit) Forecast, by Application 2019 & 2032
- Table 15: Mexico Insomnia Treatment Market Revenue (Million) Forecast, by Application 2019 & 2032
- Table 16: Mexico Insomnia Treatment Market Volume (K Unit) Forecast, by Application 2019 & 2032
- Table 17: Global Insomnia Treatment Market Revenue Million Forecast, by Country 2019 & 2032
- Table 18: Global Insomnia Treatment Market Volume K Unit Forecast, by Country 2019 & 2032
- Table 19: Germany Insomnia Treatment Market Revenue (Million) Forecast, by Application 2019 & 2032
- Table 20: Germany Insomnia Treatment Market Volume (K Unit) Forecast, by Application 2019 & 2032
- Table 21: United Kingdom Insomnia Treatment Market Revenue (Million) Forecast, by Application 2019 & 2032
- Table 22: United Kingdom Insomnia Treatment Market Volume (K Unit) Forecast, by Application 2019 & 2032
- Table 23: France Insomnia Treatment Market Revenue (Million) Forecast, by Application 2019 & 2032
- Table 24: France Insomnia Treatment Market Volume (K Unit) Forecast, by Application 2019 & 2032
- Table 25: Italy Insomnia Treatment Market Revenue (Million) Forecast, by Application 2019 & 2032
- Table 26: Italy Insomnia Treatment Market Volume (K Unit) Forecast, by Application 2019 & 2032
- Table 27: Spain Insomnia Treatment Market Revenue (Million) Forecast, by Application 2019 & 2032
- Table 28: Spain Insomnia Treatment Market Volume (K Unit) Forecast, by Application 2019 & 2032
- Table 29: Rest of Europe Insomnia Treatment Market Revenue (Million) Forecast, by Application 2019 & 2032
- Table 30: Rest of Europe Insomnia Treatment Market Volume (K Unit) Forecast, by Application 2019 & 2032
- Table 31: Global Insomnia Treatment Market Revenue Million Forecast, by Country 2019 & 2032
- Table 32: Global Insomnia Treatment Market Volume K Unit Forecast, by Country 2019 & 2032
- Table 33: China Insomnia Treatment Market Revenue (Million) Forecast, by Application 2019 & 2032
- Table 34: China Insomnia Treatment Market Volume (K Unit) Forecast, by Application 2019 & 2032
- Table 35: Japan Insomnia Treatment Market Revenue (Million) Forecast, by Application 2019 & 2032
- Table 36: Japan Insomnia Treatment Market Volume (K Unit) Forecast, by Application 2019 & 2032
- Table 37: India Insomnia Treatment Market Revenue (Million) Forecast, by Application 2019 & 2032
- Table 38: India Insomnia Treatment Market Volume (K Unit) Forecast, by Application 2019 & 2032
- Table 39: Australia Insomnia Treatment Market Revenue (Million) Forecast, by Application 2019 & 2032
- Table 40: Australia Insomnia Treatment Market Volume (K Unit) Forecast, by Application 2019 & 2032
- Table 41: South Korea Insomnia Treatment Market Revenue (Million) Forecast, by Application 2019 & 2032
- Table 42: South Korea Insomnia Treatment Market Volume (K Unit) Forecast, by Application 2019 & 2032
- Table 43: Rest of Asia Pacific Insomnia Treatment Market Revenue (Million) Forecast, by Application 2019 & 2032
- Table 44: Rest of Asia Pacific Insomnia Treatment Market Volume (K Unit) Forecast, by Application 2019 & 2032
- Table 45: Global Insomnia Treatment Market Revenue Million Forecast, by Country 2019 & 2032
- Table 46: Global Insomnia Treatment Market Volume K Unit Forecast, by Country 2019 & 2032
- Table 47: GCC Insomnia Treatment Market Revenue (Million) Forecast, by Application 2019 & 2032
- Table 48: GCC Insomnia Treatment Market Volume (K Unit) Forecast, by Application 2019 & 2032
- Table 49: South Africa Insomnia Treatment Market Revenue (Million) Forecast, by Application 2019 & 2032
- Table 50: South Africa Insomnia Treatment Market Volume (K Unit) Forecast, by Application 2019 & 2032
- Table 51: Rest of Middle East and Africa Insomnia Treatment Market Revenue (Million) Forecast, by Application 2019 & 2032
- Table 52: Rest of Middle East and Africa Insomnia Treatment Market Volume (K Unit) Forecast, by Application 2019 & 2032
- Table 53: Global Insomnia Treatment Market Revenue Million Forecast, by Country 2019 & 2032
- Table 54: Global Insomnia Treatment Market Volume K Unit Forecast, by Country 2019 & 2032
- Table 55: Brazil Insomnia Treatment Market Revenue (Million) Forecast, by Application 2019 & 2032
- Table 56: Brazil Insomnia Treatment Market Volume (K Unit) Forecast, by Application 2019 & 2032
- Table 57: Argentina Insomnia Treatment Market Revenue (Million) Forecast, by Application 2019 & 2032
- Table 58: Argentina Insomnia Treatment Market Volume (K Unit) Forecast, by Application 2019 & 2032
- Table 59: Rest of South America Insomnia Treatment Market Revenue (Million) Forecast, by Application 2019 & 2032
- Table 60: Rest of South America Insomnia Treatment Market Volume (K Unit) Forecast, by Application 2019 & 2032
- Table 61: Global Insomnia Treatment Market Revenue Million Forecast, by Treatment Type 2019 & 2032
- Table 62: Global Insomnia Treatment Market Volume K Unit Forecast, by Treatment Type 2019 & 2032
- Table 63: Global Insomnia Treatment Market Revenue Million Forecast, by Distribution Channel 2019 & 2032
- Table 64: Global Insomnia Treatment Market Volume K Unit Forecast, by Distribution Channel 2019 & 2032
- Table 65: Global Insomnia Treatment Market Revenue Million Forecast, by Country 2019 & 2032
- Table 66: Global Insomnia Treatment Market Volume K Unit Forecast, by Country 2019 & 2032
- Table 67: United States Insomnia Treatment Market Revenue (Million) Forecast, by Application 2019 & 2032
- Table 68: United States Insomnia Treatment Market Volume (K Unit) Forecast, by Application 2019 & 2032
- Table 69: Canada Insomnia Treatment Market Revenue (Million) Forecast, by Application 2019 & 2032
- Table 70: Canada Insomnia Treatment Market Volume (K Unit) Forecast, by Application 2019 & 2032
- Table 71: Mexico Insomnia Treatment Market Revenue (Million) Forecast, by Application 2019 & 2032
- Table 72: Mexico Insomnia Treatment Market Volume (K Unit) Forecast, by Application 2019 & 2032
- Table 73: Global Insomnia Treatment Market Revenue Million Forecast, by Treatment Type 2019 & 2032
- Table 74: Global Insomnia Treatment Market Volume K Unit Forecast, by Treatment Type 2019 & 2032
- Table 75: Global Insomnia Treatment Market Revenue Million Forecast, by Distribution Channel 2019 & 2032
- Table 76: Global Insomnia Treatment Market Volume K Unit Forecast, by Distribution Channel 2019 & 2032
- Table 77: Global Insomnia Treatment Market Revenue Million Forecast, by Country 2019 & 2032
- Table 78: Global Insomnia Treatment Market Volume K Unit Forecast, by Country 2019 & 2032
- Table 79: Germany Insomnia Treatment Market Revenue (Million) Forecast, by Application 2019 & 2032
- Table 80: Germany Insomnia Treatment Market Volume (K Unit) Forecast, by Application 2019 & 2032
- Table 81: United Kingdom Insomnia Treatment Market Revenue (Million) Forecast, by Application 2019 & 2032
- Table 82: United Kingdom Insomnia Treatment Market Volume (K Unit) Forecast, by Application 2019 & 2032
- Table 83: France Insomnia Treatment Market Revenue (Million) Forecast, by Application 2019 & 2032
- Table 84: France Insomnia Treatment Market Volume (K Unit) Forecast, by Application 2019 & 2032
- Table 85: Italy Insomnia Treatment Market Revenue (Million) Forecast, by Application 2019 & 2032
- Table 86: Italy Insomnia Treatment Market Volume (K Unit) Forecast, by Application 2019 & 2032
- Table 87: Spain Insomnia Treatment Market Revenue (Million) Forecast, by Application 2019 & 2032
- Table 88: Spain Insomnia Treatment Market Volume (K Unit) Forecast, by Application 2019 & 2032
- Table 89: Rest of Europe Insomnia Treatment Market Revenue (Million) Forecast, by Application 2019 & 2032
- Table 90: Rest of Europe Insomnia Treatment Market Volume (K Unit) Forecast, by Application 2019 & 2032
- Table 91: Global Insomnia Treatment Market Revenue Million Forecast, by Treatment Type 2019 & 2032
- Table 92: Global Insomnia Treatment Market Volume K Unit Forecast, by Treatment Type 2019 & 2032
- Table 93: Global Insomnia Treatment Market Revenue Million Forecast, by Distribution Channel 2019 & 2032
- Table 94: Global Insomnia Treatment Market Volume K Unit Forecast, by Distribution Channel 2019 & 2032
- Table 95: Global Insomnia Treatment Market Revenue Million Forecast, by Country 2019 & 2032
- Table 96: Global Insomnia Treatment Market Volume K Unit Forecast, by Country 2019 & 2032
- Table 97: China Insomnia Treatment Market Revenue (Million) Forecast, by Application 2019 & 2032
- Table 98: China Insomnia Treatment Market Volume (K Unit) Forecast, by Application 2019 & 2032
- Table 99: Japan Insomnia Treatment Market Revenue (Million) Forecast, by Application 2019 & 2032
- Table 100: Japan Insomnia Treatment Market Volume (K Unit) Forecast, by Application 2019 & 2032
- Table 101: India Insomnia Treatment Market Revenue (Million) Forecast, by Application 2019 & 2032
- Table 102: India Insomnia Treatment Market Volume (K Unit) Forecast, by Application 2019 & 2032
- Table 103: Australia Insomnia Treatment Market Revenue (Million) Forecast, by Application 2019 & 2032
- Table 104: Australia Insomnia Treatment Market Volume (K Unit) Forecast, by Application 2019 & 2032
- Table 105: South Korea Insomnia Treatment Market Revenue (Million) Forecast, by Application 2019 & 2032
- Table 106: South Korea Insomnia Treatment Market Volume (K Unit) Forecast, by Application 2019 & 2032
- Table 107: Rest of Asia Pacific Insomnia Treatment Market Revenue (Million) Forecast, by Application 2019 & 2032
- Table 108: Rest of Asia Pacific Insomnia Treatment Market Volume (K Unit) Forecast, by Application 2019 & 2032
- Table 109: Global Insomnia Treatment Market Revenue Million Forecast, by Treatment Type 2019 & 2032
- Table 110: Global Insomnia Treatment Market Volume K Unit Forecast, by Treatment Type 2019 & 2032
- Table 111: Global Insomnia Treatment Market Revenue Million Forecast, by Distribution Channel 2019 & 2032
- Table 112: Global Insomnia Treatment Market Volume K Unit Forecast, by Distribution Channel 2019 & 2032
- Table 113: Global Insomnia Treatment Market Revenue Million Forecast, by Country 2019 & 2032
- Table 114: Global Insomnia Treatment Market Volume K Unit Forecast, by Country 2019 & 2032
- Table 115: GCC Insomnia Treatment Market Revenue (Million) Forecast, by Application 2019 & 2032
- Table 116: GCC Insomnia Treatment Market Volume (K Unit) Forecast, by Application 2019 & 2032
- Table 117: South Africa Insomnia Treatment Market Revenue (Million) Forecast, by Application 2019 & 2032
- Table 118: South Africa Insomnia Treatment Market Volume (K Unit) Forecast, by Application 2019 & 2032
- Table 119: Rest of Middle East and Africa Insomnia Treatment Market Revenue (Million) Forecast, by Application 2019 & 2032
- Table 120: Rest of Middle East and Africa Insomnia Treatment Market Volume (K Unit) Forecast, by Application 2019 & 2032
- Table 121: Global Insomnia Treatment Market Revenue Million Forecast, by Treatment Type 2019 & 2032
- Table 122: Global Insomnia Treatment Market Volume K Unit Forecast, by Treatment Type 2019 & 2032
- Table 123: Global Insomnia Treatment Market Revenue Million Forecast, by Distribution Channel 2019 & 2032
- Table 124: Global Insomnia Treatment Market Volume K Unit Forecast, by Distribution Channel 2019 & 2032
- Table 125: Global Insomnia Treatment Market Revenue Million Forecast, by Country 2019 & 2032
- Table 126: Global Insomnia Treatment Market Volume K Unit Forecast, by Country 2019 & 2032
- Table 127: Brazil Insomnia Treatment Market Revenue (Million) Forecast, by Application 2019 & 2032
- Table 128: Brazil Insomnia Treatment Market Volume (K Unit) Forecast, by Application 2019 & 2032
- Table 129: Argentina Insomnia Treatment Market Revenue (Million) Forecast, by Application 2019 & 2032
- Table 130: Argentina Insomnia Treatment Market Volume (K Unit) Forecast, by Application 2019 & 2032
- Table 131: Rest of South America Insomnia Treatment Market Revenue (Million) Forecast, by Application 2019 & 2032
- Table 132: Rest of South America Insomnia Treatment Market Volume (K Unit) Forecast, by Application 2019 & 2032
Frequently Asked Questions
1. What is the projected Compound Annual Growth Rate (CAGR) of the Insomnia Treatment Market?
The projected CAGR is approximately 5.16%.
2. Which companies are prominent players in the Insomnia Treatment Market?
Key companies in the market include Sanofi SA, Takeda Pharmaceutical Company Ltd, Meda Consumer Healthcare, Cerêve Inc, Innovative Neurological Devices, Pernix Therapeutics, Eisai Co Ltd, Ebb Therapeutics, Electromedical Products International Inc, Merck & Co, Purdue Pharma LP, Paratek Pharmaceuticals Inc, Pfizer Inc.
3. What are the main segments of the Insomnia Treatment Market?
The market segments include Treatment Type, Distribution Channel.
4. Can you provide details about the market size?
The market size is estimated to be USD 3.58 Million as of 2022.
5. What are some drivers contributing to market growth?
Increasing Stress Due to Highly Active Lifestyles of Individuals; Side Effects Due to Certain OTC and Prescription Medication; High Usage of Media Devices Before Sleep.
6. What are the notable trends driving market growth?
Orexin Antagonist Segment is Expected to Hold a Significant Share in the Market During the Forecast Period.
7. Are there any restraints impacting market growth?
Misconceptions about the Seriousness of Insomnia; Patient Non-adherence due to Characteristic Side Effects of Insomnia Drugs.
8. Can you provide examples of recent developments in the market?
February 2024: Nivasorexant (ACT-539313), the first selective orexin-1 receptor antagonist (SO1RA), was investigated during clinical trials.
9. What pricing options are available for accessing the report?
Pricing options include single-user, multi-user, and enterprise licenses priced at USD 4750, USD 5250, and USD 8750 respectively.
10. Is the market size provided in terms of value or volume?
The market size is provided in terms of value, measured in Million and volume, measured in K Unit.
11. Are there any specific market keywords associated with the report?
Yes, the market keyword associated with the report is "Insomnia Treatment Market," which aids in identifying and referencing the specific market segment covered.
12. How do I determine which pricing option suits my needs best?
The pricing options vary based on user requirements and access needs. Individual users may opt for single-user licenses, while businesses requiring broader access may choose multi-user or enterprise licenses for cost-effective access to the report.
13. Are there any additional resources or data provided in the Insomnia Treatment Market report?
While the report offers comprehensive insights, it's advisable to review the specific contents or supplementary materials provided to ascertain if additional resources or data are available.
14. How can I stay updated on further developments or reports in the Insomnia Treatment Market?
To stay informed about further developments, trends, and reports in the Insomnia Treatment Market, consider subscribing to industry newsletters, following relevant companies and organizations, or regularly checking reputable industry news sources and publications.
Methodology
Step 1 - Identification of Relevant Samples Size from Population Database


Step 2 - Approaches for Defining Global Market Size (Value, Volume* & Price*)

Note*: In applicable scenarios
Step 3 - Data Sources
Primary Research
- Web Analytics
- Survey Reports
- Research Institute
- Latest Research Reports
- Opinion Leaders
Secondary Research
- Annual Reports
- White Paper
- Latest Press Release
- Industry Association
- Paid Database
- Investor Presentations

Step 4 - Data Triangulation
Involves using different sources of information in order to increase the validity of a study
These sources are likely to be stakeholders in a program - participants, other researchers, program staff, other community members, and so on.
Then we put all data in single framework & apply various statistical tools to find out the dynamic on the market.
During the analysis stage, feedback from the stakeholder groups would be compared to determine areas of agreement as well as areas of divergence


