
Key Insights
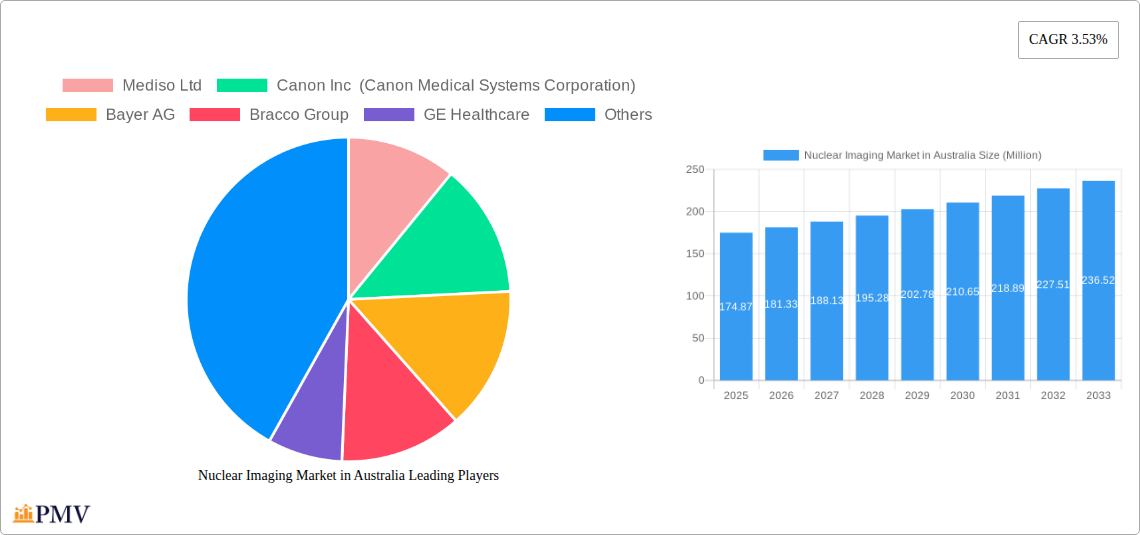
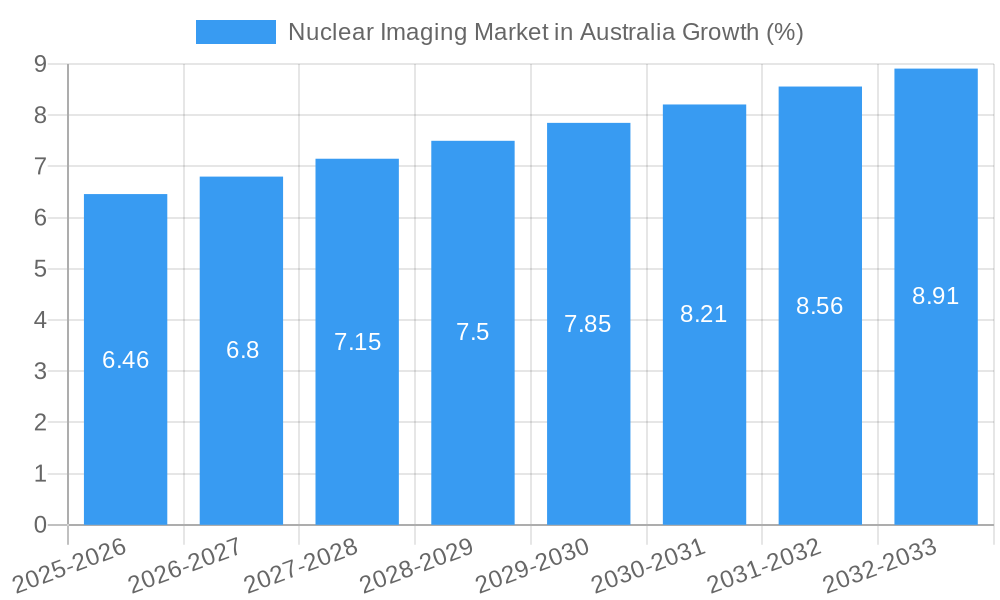
The Australian nuclear imaging market, valued at $174.87 million in 2025, is projected to experience steady growth, driven by factors such as an aging population necessitating increased diagnostic procedures, technological advancements leading to improved image quality and reduced radiation exposure, and rising prevalence of chronic diseases like cancer requiring accurate and timely diagnosis. The market is segmented by product (equipment, diagnostic radioisotopes) and application (SPECT, PET). Equipment, encompassing SPECT and PET scanners, constitutes a significant portion of the market, benefiting from ongoing innovation in scanner technology, including improved resolution and faster scan times. Diagnostic radioisotopes, essential for both SPECT and PET imaging, are another key market segment, with demand closely linked to the increasing utilization of these imaging modalities. Growth in the PET application segment is particularly noteworthy due to its superior image resolution compared to SPECT, making it increasingly preferred for oncology applications.
While the market faces potential restraints like stringent regulatory approvals for new technologies and the relatively high cost of nuclear imaging procedures, the overall growth trajectory remains positive. The increasing focus on preventative healthcare and early disease detection, along with government initiatives promoting improved healthcare infrastructure and access to advanced medical technologies in Australia, are expected to mitigate these challenges. Companies like Mediso Ltd, Canon Inc, Bayer AG, and others are actively contributing to market growth through continuous product development, strategic partnerships, and expansion of their distribution networks within the Australian healthcare landscape. The forecast period of 2025-2033 promises further expansion, fueled by the aforementioned drivers and a sustained CAGR of 3.53%. This steady growth will likely see the Australian nuclear imaging market exceed $250 million by 2033.
This in-depth report provides a comprehensive analysis of the Nuclear Imaging Market in Australia, covering the period 2019-2033. With a base year of 2025 and a forecast period spanning 2025-2033, this study offers invaluable insights into market size, segmentation, growth drivers, challenges, and competitive dynamics. The report features detailed analysis of key players including Mediso Ltd, Canon Inc (Canon Medical Systems Corporation), Bayer AG, Bracco Group, GE Healthcare, Koninklijke Philips N V, Novartis AG (Advanced Accelerator Applications), Siemens Healthineers AG, and Fujifilm Holdings Corporation. This report is essential for industry stakeholders, investors, and anyone seeking to understand the evolving landscape of nuclear imaging in Australia.
Nuclear Imaging Market in Australia Market Structure & Competitive Dynamics
The Australian nuclear imaging market exhibits a moderately concentrated structure, with a handful of multinational corporations holding significant market share. The market is characterized by a dynamic interplay of innovation, stringent regulatory frameworks, and the increasing adoption of advanced imaging technologies. Market concentration is estimated at xx%, with the top five players accounting for approximately xx Million in revenue in 2025. The presence of established players and emerging companies fosters a competitive landscape driven by technological advancements and strategic partnerships.
- Market Share: GE Healthcare and Siemens Healthineers are projected to hold the largest market share in 2025, followed by Philips and Canon Medical Systems. Exact figures are detailed within the full report.
- Innovation Ecosystems: Collaboration between research institutions like ANSTO (Australian Nuclear Science and Technology Organisation) and industry players fuels innovation in radioisotope development and equipment technology.
- Regulatory Frameworks: The Therapeutic Goods Administration (TGA) plays a crucial role in regulating the safety and efficacy of nuclear imaging products and procedures. Stringent regulations influence market entry and product development.
- Product Substitutes: While nuclear imaging remains the gold standard for many applications, advancements in other imaging modalities like MRI and CT scans present some level of substitution, particularly in specific clinical scenarios.
- End-User Trends: An aging population and increasing prevalence of chronic diseases drive demand for advanced diagnostic capabilities, benefiting the growth of the nuclear imaging market.
- M&A Activities: The Australian nuclear imaging market has witnessed moderate M&A activity in recent years, primarily focusing on expanding product portfolios and strengthening market presence. The total value of M&A deals over the historical period is estimated at xx Million.
Nuclear Imaging Market in Australia Industry Trends & Insights
The Australian nuclear imaging market is experiencing steady growth, driven by several key factors. The increasing prevalence of cancer and cardiovascular diseases necessitates advanced diagnostic tools, fueling market expansion. Technological advancements, such as the development of more sensitive and specific radiotracers and improved imaging equipment, also contribute significantly to market growth. Furthermore, government initiatives aimed at improving healthcare infrastructure and accessibility enhance market prospects. The market is projected to register a CAGR of xx% during the forecast period (2025-2033). Market penetration of PET/CT scanners, for instance, is gradually increasing, driven by their superior image quality and diagnostic capabilities. Consumer preference for minimally invasive diagnostic procedures further supports market growth. However, the high cost of equipment and radioisotopes, along with the need for specialized personnel, present challenges.
Dominant Markets & Segments in Nuclear Imaging Market in Australia
While detailed regional breakdown is provided in the full report, the market is largely driven by major metropolitan areas with established healthcare infrastructure. Within the segmentation:
Product:
- Equipment: PET/CT systems are witnessing the highest demand driven by superior image quality and diagnostic capabilities.
- Diagnostic Radioisotopes: Technetium-99m remains a dominant radioisotope, however, demand for newer, more specific radiotracers is on the rise.
Application:
- SPECT Application: SPECT continues to hold a significant market share, driven by its widespread use in cardiology and oncology. However, PET is gaining traction due to its superior sensitivity and specificity.
- PET Application: The PET application segment is projected to exhibit robust growth, driven by advancements in PET tracers and increasing use in oncology.
Key Drivers for Dominance:
- Economic Policies: Government investments in healthcare infrastructure and initiatives promoting early cancer detection drive market growth.
- Infrastructure: The concentration of specialized hospitals and diagnostic centers in major cities fuels the dominance of these regions.
Nuclear Imaging Market in Australia Product Innovations
Significant advancements in nuclear imaging technology continue to emerge. This includes the development of novel radiotracers with improved sensitivity and specificity, as well as the introduction of hybrid imaging systems like PET/MR and PET/CT that offer enhanced diagnostic capabilities. These innovations enhance diagnostic accuracy, reduce invasiveness, and streamline workflows, strengthening market competitiveness. Furthermore, advancements in image processing and analysis tools further optimize diagnostic outcomes.
Report Segmentation & Scope
The report segments the Australian nuclear imaging market based on product type (Equipment and Diagnostic Radioisotopes) and application (SPECT, PET). Each segment's growth projections, market sizes, and competitive dynamics are meticulously analyzed, providing a granular understanding of the market landscape. For instance, the equipment segment shows higher growth compared to the radioisotope segment, particularly driven by the increasing demand for advanced imaging systems. Similarly, the PET application segment demonstrates faster growth than the SPECT segment, fueled by its superior sensitivity and improved image resolution.
Key Drivers of Nuclear Imaging Market in Australia Growth
The growth of the Australian nuclear imaging market is driven by several key factors: rising prevalence of chronic diseases like cancer and cardiovascular disorders requiring advanced diagnosis; technological advancements in radiotracers and imaging equipment leading to improved image quality and diagnostic accuracy; increasing government investments in healthcare infrastructure and initiatives promoting early disease detection; and growing awareness and adoption of nuclear imaging among healthcare professionals.
Challenges in the Nuclear Imaging Market in Australia Sector
Several challenges hinder the growth of the Australian nuclear imaging market. High costs associated with equipment acquisition and maintenance, along with the need for specialized personnel, restrict market expansion. Stringent regulatory procedures also present barriers to market entry for new players. Additionally, the potential for radiation exposure and associated safety concerns necessitate ongoing investment in safety protocols and training. Competition from alternative imaging modalities also impacts market growth.
Leading Players in the Nuclear Imaging Market in Australia Market
- Mediso Ltd
- Canon Inc (Canon Medical Systems Corporation)
- Bayer AG
- Bracco Group
- GE Healthcare
- Koninklijke Philips N V
- Novartis AG (Advanced Accelerator Applications)
- Siemens Healthineers AG
- Fujifilm Holdings Corporation
Key Developments in Nuclear Imaging Market in Australia Sector
- May 2021: Mediso's reference laboratory at ANSTO installed nanoScan PET/CT and SPECT/CT preclinical molecular imaging systems, signifying advancements in preclinical research and potential future clinical applications.
- April 2021: Telix Pharmaceuticals partnered with the Oncidium Foundation, establishing the NOBLE Registry to support SPECT imaging for prostate cancer, expanding the clinical application of SPECT.
Strategic Nuclear Imaging Market in Australia Market Outlook
The Australian nuclear imaging market presents significant growth potential. Continued advancements in technology, rising prevalence of chronic diseases, and increasing healthcare expenditure will drive market expansion. Strategic partnerships between technology providers and healthcare institutions will be crucial for fostering innovation and improving accessibility. Focus on developing cost-effective and user-friendly solutions will further enhance market growth and penetration.
Nuclear Imaging Market in Australia Segmentation
-
1. Product
- 1.1. Equipment
-
1.2. Diagnostic Radioisotope
- 1.2.1. SPECT Radioisotopes
- 1.2.2. PET Radioisotopes
-
2. Application
-
2.1. SPECT Application
- 2.1.1. Cardiology
- 2.1.2. Neurology
- 2.1.3. Thyroid
- 2.1.4. Other SPECT Applications
-
2.2. PET Application
- 2.2.1. Oncology
- 2.2.2. Other PET Applications
-
2.1. SPECT Application
Nuclear Imaging Market in Australia Segmentation By Geography
-
1. North America
- 1.1. United States
- 1.2. Canada
- 1.3. Mexico
-
2. South America
- 2.1. Brazil
- 2.2. Argentina
- 2.3. Rest of South America
-
3. Europe
- 3.1. United Kingdom
- 3.2. Germany
- 3.3. France
- 3.4. Italy
- 3.5. Spain
- 3.6. Russia
- 3.7. Benelux
- 3.8. Nordics
- 3.9. Rest of Europe
-
4. Middle East & Africa
- 4.1. Turkey
- 4.2. Israel
- 4.3. GCC
- 4.4. North Africa
- 4.5. South Africa
- 4.6. Rest of Middle East & Africa
-
5. Asia Pacific
- 5.1. China
- 5.2. India
- 5.3. Japan
- 5.4. South Korea
- 5.5. ASEAN
- 5.6. Oceania
- 5.7. Rest of Asia Pacific
Nuclear Imaging Market in Australia REPORT HIGHLIGHTS
| Aspects | Details |
|---|---|
| Study Period | 2019-2033 |
| Base Year | 2024 |
| Estimated Year | 2025 |
| Forecast Period | 2025-2033 |
| Historical Period | 2019-2024 |
| Growth Rate | CAGR of 3.53% from 2019-2033 |
| Segmentation |
|
Table of Contents
- 1. Introduction
- 1.1. Research Scope
- 1.2. Market Segmentation
- 1.3. Research Methodology
- 1.4. Definitions and Assumptions
- 2. Executive Summary
- 2.1. Introduction
- 3. Market Dynamics
- 3.1. Introduction
- 3.2. Market Drivers
- 3.2.1. Increasing Prevalence of Chronic Diseases; Rising Geriatric Population; Increasing Technological Advancements
- 3.3. Market Restrains
- 3.3.1. Lack Of Proper Reimbursement And Stringent Regulatory Approval Procedures; High Cost of Equipment
- 3.4. Market Trends
- 3.4.1. Equipment Segment is Expected to Hold a Significant Market Share Over the Forecast Period
- 4. Market Factor Analysis
- 4.1. Porters Five Forces
- 4.2. Supply/Value Chain
- 4.3. PESTEL analysis
- 4.4. Market Entropy
- 4.5. Patent/Trademark Analysis
- 5. Global Nuclear Imaging Market in Australia Analysis, Insights and Forecast, 2019-2031
- 5.1. Market Analysis, Insights and Forecast - by Product
- 5.1.1. Equipment
- 5.1.2. Diagnostic Radioisotope
- 5.1.2.1. SPECT Radioisotopes
- 5.1.2.2. PET Radioisotopes
- 5.2. Market Analysis, Insights and Forecast - by Application
- 5.2.1. SPECT Application
- 5.2.1.1. Cardiology
- 5.2.1.2. Neurology
- 5.2.1.3. Thyroid
- 5.2.1.4. Other SPECT Applications
- 5.2.2. PET Application
- 5.2.2.1. Oncology
- 5.2.2.2. Other PET Applications
- 5.2.1. SPECT Application
- 5.3. Market Analysis, Insights and Forecast - by Region
- 5.3.1. North America
- 5.3.2. South America
- 5.3.3. Europe
- 5.3.4. Middle East & Africa
- 5.3.5. Asia Pacific
- 5.1. Market Analysis, Insights and Forecast - by Product
- 6. North America Nuclear Imaging Market in Australia Analysis, Insights and Forecast, 2019-2031
- 6.1. Market Analysis, Insights and Forecast - by Product
- 6.1.1. Equipment
- 6.1.2. Diagnostic Radioisotope
- 6.1.2.1. SPECT Radioisotopes
- 6.1.2.2. PET Radioisotopes
- 6.2. Market Analysis, Insights and Forecast - by Application
- 6.2.1. SPECT Application
- 6.2.1.1. Cardiology
- 6.2.1.2. Neurology
- 6.2.1.3. Thyroid
- 6.2.1.4. Other SPECT Applications
- 6.2.2. PET Application
- 6.2.2.1. Oncology
- 6.2.2.2. Other PET Applications
- 6.2.1. SPECT Application
- 6.1. Market Analysis, Insights and Forecast - by Product
- 7. South America Nuclear Imaging Market in Australia Analysis, Insights and Forecast, 2019-2031
- 7.1. Market Analysis, Insights and Forecast - by Product
- 7.1.1. Equipment
- 7.1.2. Diagnostic Radioisotope
- 7.1.2.1. SPECT Radioisotopes
- 7.1.2.2. PET Radioisotopes
- 7.2. Market Analysis, Insights and Forecast - by Application
- 7.2.1. SPECT Application
- 7.2.1.1. Cardiology
- 7.2.1.2. Neurology
- 7.2.1.3. Thyroid
- 7.2.1.4. Other SPECT Applications
- 7.2.2. PET Application
- 7.2.2.1. Oncology
- 7.2.2.2. Other PET Applications
- 7.2.1. SPECT Application
- 7.1. Market Analysis, Insights and Forecast - by Product
- 8. Europe Nuclear Imaging Market in Australia Analysis, Insights and Forecast, 2019-2031
- 8.1. Market Analysis, Insights and Forecast - by Product
- 8.1.1. Equipment
- 8.1.2. Diagnostic Radioisotope
- 8.1.2.1. SPECT Radioisotopes
- 8.1.2.2. PET Radioisotopes
- 8.2. Market Analysis, Insights and Forecast - by Application
- 8.2.1. SPECT Application
- 8.2.1.1. Cardiology
- 8.2.1.2. Neurology
- 8.2.1.3. Thyroid
- 8.2.1.4. Other SPECT Applications
- 8.2.2. PET Application
- 8.2.2.1. Oncology
- 8.2.2.2. Other PET Applications
- 8.2.1. SPECT Application
- 8.1. Market Analysis, Insights and Forecast - by Product
- 9. Middle East & Africa Nuclear Imaging Market in Australia Analysis, Insights and Forecast, 2019-2031
- 9.1. Market Analysis, Insights and Forecast - by Product
- 9.1.1. Equipment
- 9.1.2. Diagnostic Radioisotope
- 9.1.2.1. SPECT Radioisotopes
- 9.1.2.2. PET Radioisotopes
- 9.2. Market Analysis, Insights and Forecast - by Application
- 9.2.1. SPECT Application
- 9.2.1.1. Cardiology
- 9.2.1.2. Neurology
- 9.2.1.3. Thyroid
- 9.2.1.4. Other SPECT Applications
- 9.2.2. PET Application
- 9.2.2.1. Oncology
- 9.2.2.2. Other PET Applications
- 9.2.1. SPECT Application
- 9.1. Market Analysis, Insights and Forecast - by Product
- 10. Asia Pacific Nuclear Imaging Market in Australia Analysis, Insights and Forecast, 2019-2031
- 10.1. Market Analysis, Insights and Forecast - by Product
- 10.1.1. Equipment
- 10.1.2. Diagnostic Radioisotope
- 10.1.2.1. SPECT Radioisotopes
- 10.1.2.2. PET Radioisotopes
- 10.2. Market Analysis, Insights and Forecast - by Application
- 10.2.1. SPECT Application
- 10.2.1.1. Cardiology
- 10.2.1.2. Neurology
- 10.2.1.3. Thyroid
- 10.2.1.4. Other SPECT Applications
- 10.2.2. PET Application
- 10.2.2.1. Oncology
- 10.2.2.2. Other PET Applications
- 10.2.1. SPECT Application
- 10.1. Market Analysis, Insights and Forecast - by Product
- 11. Competitive Analysis
- 11.1. Global Market Share Analysis 2024
- 11.2. Company Profiles
- 11.2.1 Mediso Ltd
- 11.2.1.1. Overview
- 11.2.1.2. Products
- 11.2.1.3. SWOT Analysis
- 11.2.1.4. Recent Developments
- 11.2.1.5. Financials (Based on Availability)
- 11.2.2 Canon Inc (Canon Medical Systems Corporation)
- 11.2.2.1. Overview
- 11.2.2.2. Products
- 11.2.2.3. SWOT Analysis
- 11.2.2.4. Recent Developments
- 11.2.2.5. Financials (Based on Availability)
- 11.2.3 Bayer AG
- 11.2.3.1. Overview
- 11.2.3.2. Products
- 11.2.3.3. SWOT Analysis
- 11.2.3.4. Recent Developments
- 11.2.3.5. Financials (Based on Availability)
- 11.2.4 Bracco Group
- 11.2.4.1. Overview
- 11.2.4.2. Products
- 11.2.4.3. SWOT Analysis
- 11.2.4.4. Recent Developments
- 11.2.4.5. Financials (Based on Availability)
- 11.2.5 GE Healthcare
- 11.2.5.1. Overview
- 11.2.5.2. Products
- 11.2.5.3. SWOT Analysis
- 11.2.5.4. Recent Developments
- 11.2.5.5. Financials (Based on Availability)
- 11.2.6 Koninklijke Philips N V
- 11.2.6.1. Overview
- 11.2.6.2. Products
- 11.2.6.3. SWOT Analysis
- 11.2.6.4. Recent Developments
- 11.2.6.5. Financials (Based on Availability)
- 11.2.7 Novartis AG (Advanced Accelerator Applications)
- 11.2.7.1. Overview
- 11.2.7.2. Products
- 11.2.7.3. SWOT Analysis
- 11.2.7.4. Recent Developments
- 11.2.7.5. Financials (Based on Availability)
- 11.2.8 Siemens Healthineers AG
- 11.2.8.1. Overview
- 11.2.8.2. Products
- 11.2.8.3. SWOT Analysis
- 11.2.8.4. Recent Developments
- 11.2.8.5. Financials (Based on Availability)
- 11.2.9 Fujifilm Holdings Corporation
- 11.2.9.1. Overview
- 11.2.9.2. Products
- 11.2.9.3. SWOT Analysis
- 11.2.9.4. Recent Developments
- 11.2.9.5. Financials (Based on Availability)
- 11.2.1 Mediso Ltd
List of Figures
- Figure 1: Global Nuclear Imaging Market in Australia Revenue Breakdown (Million, %) by Region 2024 & 2032
- Figure 2: Australia Nuclear Imaging Market in Australia Revenue (Million), by Country 2024 & 2032
- Figure 3: Australia Nuclear Imaging Market in Australia Revenue Share (%), by Country 2024 & 2032
- Figure 4: North America Nuclear Imaging Market in Australia Revenue (Million), by Product 2024 & 2032
- Figure 5: North America Nuclear Imaging Market in Australia Revenue Share (%), by Product 2024 & 2032
- Figure 6: North America Nuclear Imaging Market in Australia Revenue (Million), by Application 2024 & 2032
- Figure 7: North America Nuclear Imaging Market in Australia Revenue Share (%), by Application 2024 & 2032
- Figure 8: North America Nuclear Imaging Market in Australia Revenue (Million), by Country 2024 & 2032
- Figure 9: North America Nuclear Imaging Market in Australia Revenue Share (%), by Country 2024 & 2032
- Figure 10: South America Nuclear Imaging Market in Australia Revenue (Million), by Product 2024 & 2032
- Figure 11: South America Nuclear Imaging Market in Australia Revenue Share (%), by Product 2024 & 2032
- Figure 12: South America Nuclear Imaging Market in Australia Revenue (Million), by Application 2024 & 2032
- Figure 13: South America Nuclear Imaging Market in Australia Revenue Share (%), by Application 2024 & 2032
- Figure 14: South America Nuclear Imaging Market in Australia Revenue (Million), by Country 2024 & 2032
- Figure 15: South America Nuclear Imaging Market in Australia Revenue Share (%), by Country 2024 & 2032
- Figure 16: Europe Nuclear Imaging Market in Australia Revenue (Million), by Product 2024 & 2032
- Figure 17: Europe Nuclear Imaging Market in Australia Revenue Share (%), by Product 2024 & 2032
- Figure 18: Europe Nuclear Imaging Market in Australia Revenue (Million), by Application 2024 & 2032
- Figure 19: Europe Nuclear Imaging Market in Australia Revenue Share (%), by Application 2024 & 2032
- Figure 20: Europe Nuclear Imaging Market in Australia Revenue (Million), by Country 2024 & 2032
- Figure 21: Europe Nuclear Imaging Market in Australia Revenue Share (%), by Country 2024 & 2032
- Figure 22: Middle East & Africa Nuclear Imaging Market in Australia Revenue (Million), by Product 2024 & 2032
- Figure 23: Middle East & Africa Nuclear Imaging Market in Australia Revenue Share (%), by Product 2024 & 2032
- Figure 24: Middle East & Africa Nuclear Imaging Market in Australia Revenue (Million), by Application 2024 & 2032
- Figure 25: Middle East & Africa Nuclear Imaging Market in Australia Revenue Share (%), by Application 2024 & 2032
- Figure 26: Middle East & Africa Nuclear Imaging Market in Australia Revenue (Million), by Country 2024 & 2032
- Figure 27: Middle East & Africa Nuclear Imaging Market in Australia Revenue Share (%), by Country 2024 & 2032
- Figure 28: Asia Pacific Nuclear Imaging Market in Australia Revenue (Million), by Product 2024 & 2032
- Figure 29: Asia Pacific Nuclear Imaging Market in Australia Revenue Share (%), by Product 2024 & 2032
- Figure 30: Asia Pacific Nuclear Imaging Market in Australia Revenue (Million), by Application 2024 & 2032
- Figure 31: Asia Pacific Nuclear Imaging Market in Australia Revenue Share (%), by Application 2024 & 2032
- Figure 32: Asia Pacific Nuclear Imaging Market in Australia Revenue (Million), by Country 2024 & 2032
- Figure 33: Asia Pacific Nuclear Imaging Market in Australia Revenue Share (%), by Country 2024 & 2032
List of Tables
- Table 1: Global Nuclear Imaging Market in Australia Revenue Million Forecast, by Region 2019 & 2032
- Table 2: Global Nuclear Imaging Market in Australia Revenue Million Forecast, by Product 2019 & 2032
- Table 3: Global Nuclear Imaging Market in Australia Revenue Million Forecast, by Application 2019 & 2032
- Table 4: Global Nuclear Imaging Market in Australia Revenue Million Forecast, by Region 2019 & 2032
- Table 5: Global Nuclear Imaging Market in Australia Revenue Million Forecast, by Country 2019 & 2032
- Table 6: Global Nuclear Imaging Market in Australia Revenue Million Forecast, by Product 2019 & 2032
- Table 7: Global Nuclear Imaging Market in Australia Revenue Million Forecast, by Application 2019 & 2032
- Table 8: Global Nuclear Imaging Market in Australia Revenue Million Forecast, by Country 2019 & 2032
- Table 9: United States Nuclear Imaging Market in Australia Revenue (Million) Forecast, by Application 2019 & 2032
- Table 10: Canada Nuclear Imaging Market in Australia Revenue (Million) Forecast, by Application 2019 & 2032
- Table 11: Mexico Nuclear Imaging Market in Australia Revenue (Million) Forecast, by Application 2019 & 2032
- Table 12: Global Nuclear Imaging Market in Australia Revenue Million Forecast, by Product 2019 & 2032
- Table 13: Global Nuclear Imaging Market in Australia Revenue Million Forecast, by Application 2019 & 2032
- Table 14: Global Nuclear Imaging Market in Australia Revenue Million Forecast, by Country 2019 & 2032
- Table 15: Brazil Nuclear Imaging Market in Australia Revenue (Million) Forecast, by Application 2019 & 2032
- Table 16: Argentina Nuclear Imaging Market in Australia Revenue (Million) Forecast, by Application 2019 & 2032
- Table 17: Rest of South America Nuclear Imaging Market in Australia Revenue (Million) Forecast, by Application 2019 & 2032
- Table 18: Global Nuclear Imaging Market in Australia Revenue Million Forecast, by Product 2019 & 2032
- Table 19: Global Nuclear Imaging Market in Australia Revenue Million Forecast, by Application 2019 & 2032
- Table 20: Global Nuclear Imaging Market in Australia Revenue Million Forecast, by Country 2019 & 2032
- Table 21: United Kingdom Nuclear Imaging Market in Australia Revenue (Million) Forecast, by Application 2019 & 2032
- Table 22: Germany Nuclear Imaging Market in Australia Revenue (Million) Forecast, by Application 2019 & 2032
- Table 23: France Nuclear Imaging Market in Australia Revenue (Million) Forecast, by Application 2019 & 2032
- Table 24: Italy Nuclear Imaging Market in Australia Revenue (Million) Forecast, by Application 2019 & 2032
- Table 25: Spain Nuclear Imaging Market in Australia Revenue (Million) Forecast, by Application 2019 & 2032
- Table 26: Russia Nuclear Imaging Market in Australia Revenue (Million) Forecast, by Application 2019 & 2032
- Table 27: Benelux Nuclear Imaging Market in Australia Revenue (Million) Forecast, by Application 2019 & 2032
- Table 28: Nordics Nuclear Imaging Market in Australia Revenue (Million) Forecast, by Application 2019 & 2032
- Table 29: Rest of Europe Nuclear Imaging Market in Australia Revenue (Million) Forecast, by Application 2019 & 2032
- Table 30: Global Nuclear Imaging Market in Australia Revenue Million Forecast, by Product 2019 & 2032
- Table 31: Global Nuclear Imaging Market in Australia Revenue Million Forecast, by Application 2019 & 2032
- Table 32: Global Nuclear Imaging Market in Australia Revenue Million Forecast, by Country 2019 & 2032
- Table 33: Turkey Nuclear Imaging Market in Australia Revenue (Million) Forecast, by Application 2019 & 2032
- Table 34: Israel Nuclear Imaging Market in Australia Revenue (Million) Forecast, by Application 2019 & 2032
- Table 35: GCC Nuclear Imaging Market in Australia Revenue (Million) Forecast, by Application 2019 & 2032
- Table 36: North Africa Nuclear Imaging Market in Australia Revenue (Million) Forecast, by Application 2019 & 2032
- Table 37: South Africa Nuclear Imaging Market in Australia Revenue (Million) Forecast, by Application 2019 & 2032
- Table 38: Rest of Middle East & Africa Nuclear Imaging Market in Australia Revenue (Million) Forecast, by Application 2019 & 2032
- Table 39: Global Nuclear Imaging Market in Australia Revenue Million Forecast, by Product 2019 & 2032
- Table 40: Global Nuclear Imaging Market in Australia Revenue Million Forecast, by Application 2019 & 2032
- Table 41: Global Nuclear Imaging Market in Australia Revenue Million Forecast, by Country 2019 & 2032
- Table 42: China Nuclear Imaging Market in Australia Revenue (Million) Forecast, by Application 2019 & 2032
- Table 43: India Nuclear Imaging Market in Australia Revenue (Million) Forecast, by Application 2019 & 2032
- Table 44: Japan Nuclear Imaging Market in Australia Revenue (Million) Forecast, by Application 2019 & 2032
- Table 45: South Korea Nuclear Imaging Market in Australia Revenue (Million) Forecast, by Application 2019 & 2032
- Table 46: ASEAN Nuclear Imaging Market in Australia Revenue (Million) Forecast, by Application 2019 & 2032
- Table 47: Oceania Nuclear Imaging Market in Australia Revenue (Million) Forecast, by Application 2019 & 2032
- Table 48: Rest of Asia Pacific Nuclear Imaging Market in Australia Revenue (Million) Forecast, by Application 2019 & 2032
Frequently Asked Questions
1. What is the projected Compound Annual Growth Rate (CAGR) of the Nuclear Imaging Market in Australia?
The projected CAGR is approximately 3.53%.
2. Which companies are prominent players in the Nuclear Imaging Market in Australia?
Key companies in the market include Mediso Ltd, Canon Inc (Canon Medical Systems Corporation), Bayer AG, Bracco Group, GE Healthcare, Koninklijke Philips N V, Novartis AG (Advanced Accelerator Applications), Siemens Healthineers AG, Fujifilm Holdings Corporation.
3. What are the main segments of the Nuclear Imaging Market in Australia?
The market segments include Product, Application.
4. Can you provide details about the market size?
The market size is estimated to be USD 174.87 Million as of 2022.
5. What are some drivers contributing to market growth?
Increasing Prevalence of Chronic Diseases; Rising Geriatric Population; Increasing Technological Advancements.
6. What are the notable trends driving market growth?
Equipment Segment is Expected to Hold a Significant Market Share Over the Forecast Period.
7. Are there any restraints impacting market growth?
Lack Of Proper Reimbursement And Stringent Regulatory Approval Procedures; High Cost of Equipment.
8. Can you provide examples of recent developments in the market?
In May 2021, Mediso's reference laboratory at ANSTO, Australia's Nuclear Science and Technology Organization installed the newly acquired nanoScan PET/CT and SPECT/CT preclinical molecular imaging systems.
9. What pricing options are available for accessing the report?
Pricing options include single-user, multi-user, and enterprise licenses priced at USD 3800, USD 4500, and USD 5800 respectively.
10. Is the market size provided in terms of value or volume?
The market size is provided in terms of value, measured in Million.
11. Are there any specific market keywords associated with the report?
Yes, the market keyword associated with the report is "Nuclear Imaging Market in Australia," which aids in identifying and referencing the specific market segment covered.
12. How do I determine which pricing option suits my needs best?
The pricing options vary based on user requirements and access needs. Individual users may opt for single-user licenses, while businesses requiring broader access may choose multi-user or enterprise licenses for cost-effective access to the report.
13. Are there any additional resources or data provided in the Nuclear Imaging Market in Australia report?
While the report offers comprehensive insights, it's advisable to review the specific contents or supplementary materials provided to ascertain if additional resources or data are available.
14. How can I stay updated on further developments or reports in the Nuclear Imaging Market in Australia?
To stay informed about further developments, trends, and reports in the Nuclear Imaging Market in Australia, consider subscribing to industry newsletters, following relevant companies and organizations, or regularly checking reputable industry news sources and publications.
Methodology
Step 1 - Identification of Relevant Samples Size from Population Database


Step 2 - Approaches for Defining Global Market Size (Value, Volume* & Price*)

Note*: In applicable scenarios
Step 3 - Data Sources
Primary Research
- Web Analytics
- Survey Reports
- Research Institute
- Latest Research Reports
- Opinion Leaders
Secondary Research
- Annual Reports
- White Paper
- Latest Press Release
- Industry Association
- Paid Database
- Investor Presentations

Step 4 - Data Triangulation
Involves using different sources of information in order to increase the validity of a study
These sources are likely to be stakeholders in a program - participants, other researchers, program staff, other community members, and so on.
Then we put all data in single framework & apply various statistical tools to find out the dynamic on the market.
During the analysis stage, feedback from the stakeholder groups would be compared to determine areas of agreement as well as areas of divergence


