
Key Insights
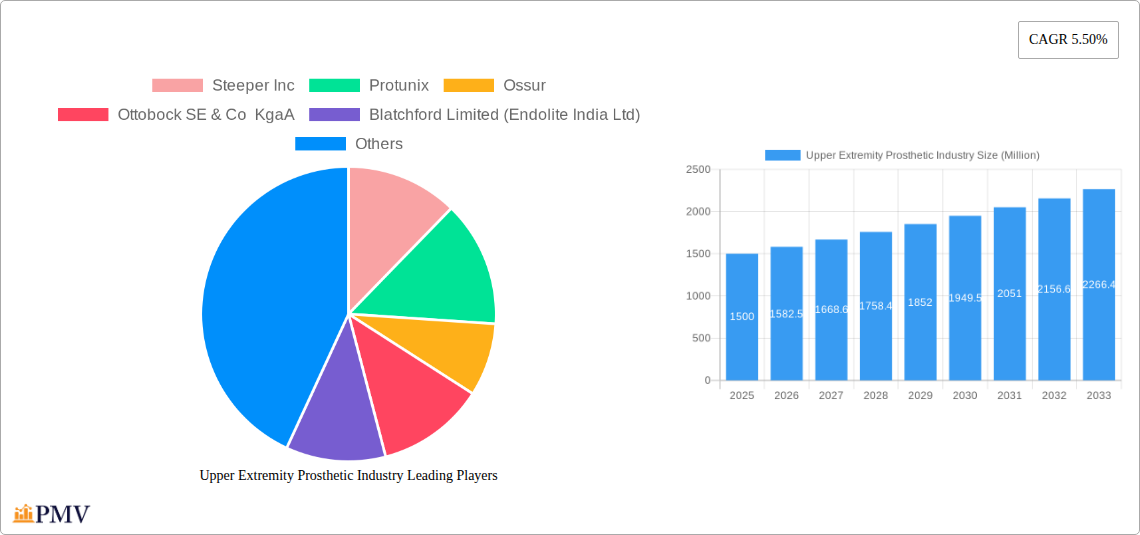
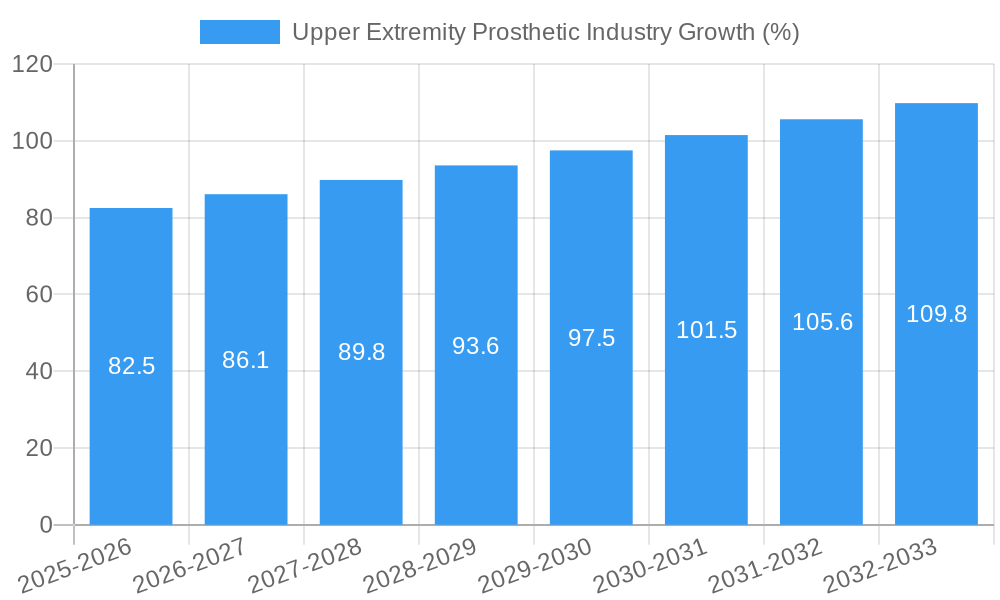
The global upper extremity prosthetic market, valued at approximately $1.5 billion in 2025, is poised for significant growth, exhibiting a Compound Annual Growth Rate (CAGR) of 5.5% from 2025 to 2033. This expansion is driven by several key factors. Technological advancements in prosthetic design, leading to lighter, more functional, and aesthetically pleasing devices, are significantly increasing adoption rates. The rising prevalence of limb loss due to accidents, diabetes, and congenital conditions fuels market demand. Furthermore, increasing awareness of advanced prosthetic options, coupled with improved healthcare infrastructure and insurance coverage in several regions, particularly North America and Europe, are contributing to market growth. The shift towards body-powered prosthetics, offering enhanced dexterity and cost-effectiveness compared to myoelectric options, is also creating opportunities within specific segments.
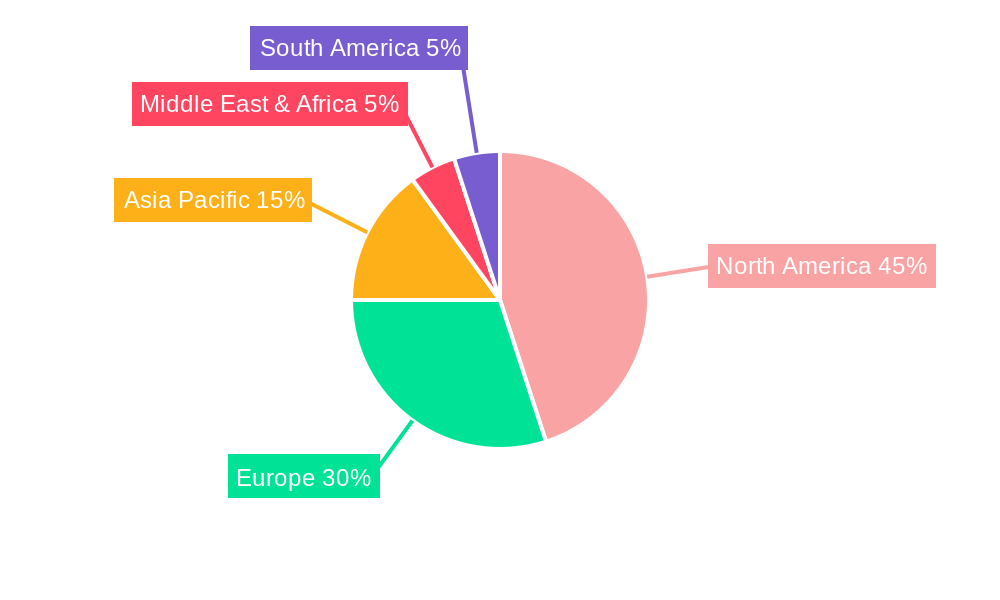
However, the market faces certain restraints. The high cost associated with advanced prosthetic devices, particularly myoelectric and hybrid options, remains a barrier for many patients. Limited access to skilled prosthetists and rehabilitation services, especially in developing countries, restricts market penetration. Moreover, the need for frequent adjustments and maintenance contributes to overall expenses. The market segmentation, primarily by device type (body-powered, passive, hybrid, myoelectric), component (elbow, wrist, arm, shoulder), and end-user (hospitals, clinics), reveals distinct growth patterns. The myoelectric segment is projected to witness the fastest growth due to technological improvements, while body-powered prosthetics will maintain a substantial market share due to affordability and simplicity. North America and Europe currently dominate the market due to higher healthcare spending and technological advancements, but the Asia-Pacific region is expected to experience rapid growth driven by increasing awareness and rising disposable incomes.
Upper Extremity Prosthetic Industry: A Comprehensive Market Report (2019-2033)
This detailed report provides a comprehensive analysis of the Upper Extremity Prosthetic Industry, offering invaluable insights for stakeholders seeking to understand market dynamics, competitive landscapes, and future growth opportunities. The study period covers 2019-2033, with 2025 as the base and estimated year. The forecast period spans 2025-2033, and the historical period encompasses 2019-2024. The global market size is projected to reach xx Million by 2033, exhibiting a CAGR of xx% during the forecast period.
Upper Extremity Prosthetic Industry Market Structure & Competitive Dynamics
The Upper Extremity Prosthetic market is characterized by a moderately concentrated structure with several key players holding significant market share. Competition is fierce, driven by innovation in prosthetic design, materials, and control systems. The industry landscape is shaped by robust regulatory frameworks, focusing on safety and efficacy. Product substitution is limited, with the primary alternatives being traditional body-powered prosthetics. However, technological advancements are continually driving the adoption of more sophisticated myoelectric and hybrid devices. End-user trends reveal a growing preference for lighter, more intuitive, and cosmetically appealing prosthetics. Mergers and acquisitions (M&A) activity is moderate, with deals primarily focused on expanding product portfolios and geographical reach. For example, a significant M&A deal in 2022 involved xx company acquiring yy company for approximately xx Million USD, significantly impacting market share distribution. The overall market share is as follows (estimated 2025):
- Ossur: xx%
- Ottobock: xx%
- Steeper: xx%
- Others: xx%
Upper Extremity Prosthetic Industry Industry Trends & Insights
The Upper Extremity Prosthetic market is experiencing robust growth, fueled by several key factors. Technological advancements, such as the development of advanced sensors, microprocessors, and AI-powered control systems, are driving the adoption of sophisticated myoelectric prosthetics offering enhanced functionality and dexterity. Increasing prevalence of limb loss due to accidents, diseases (e.g., diabetes), and amputations is another significant driver. Consumer preferences are shifting towards more natural-looking, comfortable, and intuitive devices, leading to increased demand for advanced prosthetics. Furthermore, rising healthcare expenditure and increased awareness about prosthetic technology are contributing to market growth. The market is also witnessing a growing trend towards personalized prosthetics, tailored to individual needs and preferences. Competitive dynamics are shaped by technological innovation, product differentiation, and strategic partnerships. The market is expected to witness continuous innovation in materials, designs, and control systems, further driving growth.
Dominant Markets & Segments in Upper Extremity Prosthetic Industry
The North American region currently dominates the Upper Extremity Prosthetic market, driven by high healthcare expenditure, advanced technological infrastructure, and a large patient population. Within the segment breakdown, the Myoelectric device type holds a significant share, reflecting the growing preference for advanced prosthetic technology. The Prosthetic Arm segment is the largest by component, followed by the Prosthetic Wrist. Hospitals and specialized prosthetic clinics represent the most significant end-user segments.
Key Drivers for North American Dominance:
- High healthcare expenditure.
- Well-established healthcare infrastructure.
- High prevalence of limb loss.
- Favorable regulatory environment.
- Significant investments in R&D.
Myoelectric Device Type Dominance: Driven by advanced features and improved functionality compared to body-powered or passive prosthetics.
Prosthetic Arm Segment Dominance: Arms are the most commonly affected limb, leading to higher demand for arm prosthetics.
Upper Extremity Prosthetic Industry Product Innovations
Recent years have witnessed significant advancements in upper extremity prosthetics. The industry has seen the introduction of advanced myoelectric devices with improved control, grip strength, and dexterity. Biometric sensors, 3D printing technology, and AI-powered algorithms are transforming prosthetic design, enabling increased personalization and improved functionality. The focus is on developing lighter, more intuitive, and cosmetically appealing prosthetics that better meet the needs and preferences of users. This is driving increased market penetration and enhanced user satisfaction.
Report Segmentation & Scope
This report segments the Upper Extremity Prosthetic market across various parameters:
- By Device Type: Body Powered, Passive, Hybrid, Myoelectric. The myoelectric segment is projected to exhibit the highest growth rate due to technological advancements and improved functionality.
- By Component: Prosthetic Elbow, Prosthetic Wrist, Prosthetic Arm, Prosthetic Shoulder, Other Components. The prosthetic arm segment accounts for the largest market share.
- By End User: Hospitals, Prosthetic Clinics, Other End Users. Hospitals and specialized prosthetic clinics are the major end-users.
Each segment is thoroughly analyzed, providing detailed growth projections, market sizes, and competitive dynamics for the forecast period.
Key Drivers of Upper Extremity Prosthetic Industry Growth
The growth of the upper extremity prosthetic market is primarily driven by technological advancements in materials, sensors, and control systems; a rising prevalence of limb loss due to accidents, injuries, and diseases; increasing healthcare expenditure globally; and a growing awareness among amputees about advanced prosthetic options. Government initiatives supporting assistive technologies also contribute to market expansion.
Challenges in the Upper Extremity Prosthetic Industry Sector
The industry faces challenges such as high production costs limiting accessibility, complex regulatory procedures impacting product launches, supply chain disruptions affecting manufacturing, and the need for continuous innovation to stay competitive. These factors impact profitability and market growth. The average cost of a myoelectric prosthetic arm can range from xx Million to xx Million USD, creating affordability challenges for many patients.
Leading Players in the Upper Extremity Prosthetic Industry Market
- Steeper Inc
- Protunix
- Ossur
- Ottobock SE & Co KgaA
- Blatchford Limited (Endolite India Ltd)
- WillowWood Global LLC
- Fillauer LLC
- Open Bionics Ltd
- Ortho Europe
- COAPT LLC
Key Developments in Upper Extremity Prosthetic Industry Sector
- July 2021: Stryker launched the Tornier shoulder arthroplasty portfolio, including the Perform Humeral Stem, enhancing surgical options for shoulder replacements. This indirectly impacts the upper extremity prosthetic market by improving surgical outcomes and potentially reducing the need for prosthetics in some cases.
- July 2021: Össur launched the Rebound Post-Op Elbow Brace, a non-invasive brace improving patient recovery and potentially impacting the market by reducing the need for long-term prosthetics.
Strategic Upper Extremity Prosthetic Industry Market Outlook
The future of the upper extremity prosthetic market is promising, with continued growth driven by technological innovation, improving healthcare infrastructure, and growing awareness. Strategic opportunities exist in developing personalized prosthetics, incorporating advanced AI and machine learning, and expanding into emerging markets. Companies focusing on cost-effective solutions and enhanced user experiences will have a significant competitive advantage.
Upper Extremity Prosthetic Industry Segmentation
-
1. Device Type
- 1.1. Body Powered
- 1.2. Passive
- 1.3. Hybrid
- 1.4. Myoelectric
-
2. Component
- 2.1. Prosthetic Elbow
- 2.2. Prosthetic Wrist
- 2.3. Prosthetic Arm
- 2.4. Prosthetic Shoulder
- 2.5. Other Components
-
3. End User
- 3.1. Hospitals
- 3.2. Prosthetic Clinics
- 3.3. Other End Users
Upper Extremity Prosthetic Industry Segmentation By Geography
-
1. North America
- 1.1. United States
- 1.2. Canada
- 1.3. Mexico
-
2. Europe
- 2.1. Germany
- 2.2. United Kingdom
- 2.3. France
- 2.4. Italy
- 2.5. Spain
- 2.6. Rest of Europe
-
3. Asia Pacific
- 3.1. China
- 3.2. Japan
- 3.3. India
- 3.4. Australia
- 3.5. South Korea
- 3.6. Rest of Asia Pacific
-
4. Middle East and Africa
- 4.1. GCC
- 4.2. South Africa
- 4.3. Rest of Middle East and Africa
-
5. South America
- 5.1. Brazil
- 5.2. Argentina
- 5.3. Rest of South America
Upper Extremity Prosthetic Industry REPORT HIGHLIGHTS
| Aspects | Details |
|---|---|
| Study Period | 2019-2033 |
| Base Year | 2024 |
| Estimated Year | 2025 |
| Forecast Period | 2025-2033 |
| Historical Period | 2019-2024 |
| Growth Rate | CAGR of 5.50% from 2019-2033 |
| Segmentation |
|
Table of Contents
- 1. Introduction
- 1.1. Research Scope
- 1.2. Market Segmentation
- 1.3. Research Methodology
- 1.4. Definitions and Assumptions
- 2. Executive Summary
- 2.1. Introduction
- 3. Market Dynamics
- 3.1. Introduction
- 3.2. Market Drivers
- 3.2.1. Increasing Number of Serious Injuries and Rise in Number of Amputations; Technological Advancements
- 3.3. Market Restrains
- 3.3.1. High Prices of Prosthetics; Lack of Awareness in Developing Regions
- 3.4. Market Trends
- 3.4.1. Myoelectric Expected to Hold Significant Share in the Upper Limb Prosthetics Market
- 4. Market Factor Analysis
- 4.1. Porters Five Forces
- 4.2. Supply/Value Chain
- 4.3. PESTEL analysis
- 4.4. Market Entropy
- 4.5. Patent/Trademark Analysis
- 5. Global Upper Extremity Prosthetic Industry Analysis, Insights and Forecast, 2019-2031
- 5.1. Market Analysis, Insights and Forecast - by Device Type
- 5.1.1. Body Powered
- 5.1.2. Passive
- 5.1.3. Hybrid
- 5.1.4. Myoelectric
- 5.2. Market Analysis, Insights and Forecast - by Component
- 5.2.1. Prosthetic Elbow
- 5.2.2. Prosthetic Wrist
- 5.2.3. Prosthetic Arm
- 5.2.4. Prosthetic Shoulder
- 5.2.5. Other Components
- 5.3. Market Analysis, Insights and Forecast - by End User
- 5.3.1. Hospitals
- 5.3.2. Prosthetic Clinics
- 5.3.3. Other End Users
- 5.4. Market Analysis, Insights and Forecast - by Region
- 5.4.1. North America
- 5.4.2. Europe
- 5.4.3. Asia Pacific
- 5.4.4. Middle East and Africa
- 5.4.5. South America
- 5.1. Market Analysis, Insights and Forecast - by Device Type
- 6. North America Upper Extremity Prosthetic Industry Analysis, Insights and Forecast, 2019-2031
- 6.1. Market Analysis, Insights and Forecast - by Device Type
- 6.1.1. Body Powered
- 6.1.2. Passive
- 6.1.3. Hybrid
- 6.1.4. Myoelectric
- 6.2. Market Analysis, Insights and Forecast - by Component
- 6.2.1. Prosthetic Elbow
- 6.2.2. Prosthetic Wrist
- 6.2.3. Prosthetic Arm
- 6.2.4. Prosthetic Shoulder
- 6.2.5. Other Components
- 6.3. Market Analysis, Insights and Forecast - by End User
- 6.3.1. Hospitals
- 6.3.2. Prosthetic Clinics
- 6.3.3. Other End Users
- 6.1. Market Analysis, Insights and Forecast - by Device Type
- 7. Europe Upper Extremity Prosthetic Industry Analysis, Insights and Forecast, 2019-2031
- 7.1. Market Analysis, Insights and Forecast - by Device Type
- 7.1.1. Body Powered
- 7.1.2. Passive
- 7.1.3. Hybrid
- 7.1.4. Myoelectric
- 7.2. Market Analysis, Insights and Forecast - by Component
- 7.2.1. Prosthetic Elbow
- 7.2.2. Prosthetic Wrist
- 7.2.3. Prosthetic Arm
- 7.2.4. Prosthetic Shoulder
- 7.2.5. Other Components
- 7.3. Market Analysis, Insights and Forecast - by End User
- 7.3.1. Hospitals
- 7.3.2. Prosthetic Clinics
- 7.3.3. Other End Users
- 7.1. Market Analysis, Insights and Forecast - by Device Type
- 8. Asia Pacific Upper Extremity Prosthetic Industry Analysis, Insights and Forecast, 2019-2031
- 8.1. Market Analysis, Insights and Forecast - by Device Type
- 8.1.1. Body Powered
- 8.1.2. Passive
- 8.1.3. Hybrid
- 8.1.4. Myoelectric
- 8.2. Market Analysis, Insights and Forecast - by Component
- 8.2.1. Prosthetic Elbow
- 8.2.2. Prosthetic Wrist
- 8.2.3. Prosthetic Arm
- 8.2.4. Prosthetic Shoulder
- 8.2.5. Other Components
- 8.3. Market Analysis, Insights and Forecast - by End User
- 8.3.1. Hospitals
- 8.3.2. Prosthetic Clinics
- 8.3.3. Other End Users
- 8.1. Market Analysis, Insights and Forecast - by Device Type
- 9. Middle East and Africa Upper Extremity Prosthetic Industry Analysis, Insights and Forecast, 2019-2031
- 9.1. Market Analysis, Insights and Forecast - by Device Type
- 9.1.1. Body Powered
- 9.1.2. Passive
- 9.1.3. Hybrid
- 9.1.4. Myoelectric
- 9.2. Market Analysis, Insights and Forecast - by Component
- 9.2.1. Prosthetic Elbow
- 9.2.2. Prosthetic Wrist
- 9.2.3. Prosthetic Arm
- 9.2.4. Prosthetic Shoulder
- 9.2.5. Other Components
- 9.3. Market Analysis, Insights and Forecast - by End User
- 9.3.1. Hospitals
- 9.3.2. Prosthetic Clinics
- 9.3.3. Other End Users
- 9.1. Market Analysis, Insights and Forecast - by Device Type
- 10. South America Upper Extremity Prosthetic Industry Analysis, Insights and Forecast, 2019-2031
- 10.1. Market Analysis, Insights and Forecast - by Device Type
- 10.1.1. Body Powered
- 10.1.2. Passive
- 10.1.3. Hybrid
- 10.1.4. Myoelectric
- 10.2. Market Analysis, Insights and Forecast - by Component
- 10.2.1. Prosthetic Elbow
- 10.2.2. Prosthetic Wrist
- 10.2.3. Prosthetic Arm
- 10.2.4. Prosthetic Shoulder
- 10.2.5. Other Components
- 10.3. Market Analysis, Insights and Forecast - by End User
- 10.3.1. Hospitals
- 10.3.2. Prosthetic Clinics
- 10.3.3. Other End Users
- 10.1. Market Analysis, Insights and Forecast - by Device Type
- 11. North America Upper Extremity Prosthetic Industry Analysis, Insights and Forecast, 2019-2031
- 11.1. Market Analysis, Insights and Forecast - By Country/Sub-region
- 11.1.1 United States
- 11.1.2 Canada
- 11.1.3 Mexico
- 12. Europe Upper Extremity Prosthetic Industry Analysis, Insights and Forecast, 2019-2031
- 12.1. Market Analysis, Insights and Forecast - By Country/Sub-region
- 12.1.1 Germany
- 12.1.2 United Kingdom
- 12.1.3 France
- 12.1.4 Italy
- 12.1.5 Spain
- 12.1.6 Rest of Europe
- 13. Asia Pacific Upper Extremity Prosthetic Industry Analysis, Insights and Forecast, 2019-2031
- 13.1. Market Analysis, Insights and Forecast - By Country/Sub-region
- 13.1.1 China
- 13.1.2 Japan
- 13.1.3 India
- 13.1.4 Australia
- 13.1.5 South Korea
- 13.1.6 Rest of Asia Pacific
- 14. Middle East and Africa Upper Extremity Prosthetic Industry Analysis, Insights and Forecast, 2019-2031
- 14.1. Market Analysis, Insights and Forecast - By Country/Sub-region
- 14.1.1 GCC
- 14.1.2 South Africa
- 14.1.3 Rest of Middle East and Africa
- 15. South America Upper Extremity Prosthetic Industry Analysis, Insights and Forecast, 2019-2031
- 15.1. Market Analysis, Insights and Forecast - By Country/Sub-region
- 15.1.1 Brazil
- 15.1.2 Argentina
- 15.1.3 Rest of South America
- 16. Competitive Analysis
- 16.1. Global Market Share Analysis 2024
- 16.2. Company Profiles
- 16.2.1 Steeper Inc
- 16.2.1.1. Overview
- 16.2.1.2. Products
- 16.2.1.3. SWOT Analysis
- 16.2.1.4. Recent Developments
- 16.2.1.5. Financials (Based on Availability)
- 16.2.2 Protunix
- 16.2.2.1. Overview
- 16.2.2.2. Products
- 16.2.2.3. SWOT Analysis
- 16.2.2.4. Recent Developments
- 16.2.2.5. Financials (Based on Availability)
- 16.2.3 Ossur
- 16.2.3.1. Overview
- 16.2.3.2. Products
- 16.2.3.3. SWOT Analysis
- 16.2.3.4. Recent Developments
- 16.2.3.5. Financials (Based on Availability)
- 16.2.4 Ottobock SE & Co KgaA
- 16.2.4.1. Overview
- 16.2.4.2. Products
- 16.2.4.3. SWOT Analysis
- 16.2.4.4. Recent Developments
- 16.2.4.5. Financials (Based on Availability)
- 16.2.5 Blatchford Limited (Endolite India Ltd)
- 16.2.5.1. Overview
- 16.2.5.2. Products
- 16.2.5.3. SWOT Analysis
- 16.2.5.4. Recent Developments
- 16.2.5.5. Financials (Based on Availability)
- 16.2.6 WillowWood Global LLC
- 16.2.6.1. Overview
- 16.2.6.2. Products
- 16.2.6.3. SWOT Analysis
- 16.2.6.4. Recent Developments
- 16.2.6.5. Financials (Based on Availability)
- 16.2.7 Fillauer LLC
- 16.2.7.1. Overview
- 16.2.7.2. Products
- 16.2.7.3. SWOT Analysis
- 16.2.7.4. Recent Developments
- 16.2.7.5. Financials (Based on Availability)
- 16.2.8 Open Bionics Ltd*List Not Exhaustive
- 16.2.8.1. Overview
- 16.2.8.2. Products
- 16.2.8.3. SWOT Analysis
- 16.2.8.4. Recent Developments
- 16.2.8.5. Financials (Based on Availability)
- 16.2.9 Ortho Europe
- 16.2.9.1. Overview
- 16.2.9.2. Products
- 16.2.9.3. SWOT Analysis
- 16.2.9.4. Recent Developments
- 16.2.9.5. Financials (Based on Availability)
- 16.2.10 COAPT LLC
- 16.2.10.1. Overview
- 16.2.10.2. Products
- 16.2.10.3. SWOT Analysis
- 16.2.10.4. Recent Developments
- 16.2.10.5. Financials (Based on Availability)
- 16.2.1 Steeper Inc
List of Figures
- Figure 1: Global Upper Extremity Prosthetic Industry Revenue Breakdown (Million, %) by Region 2024 & 2032
- Figure 2: North America Upper Extremity Prosthetic Industry Revenue (Million), by Country 2024 & 2032
- Figure 3: North America Upper Extremity Prosthetic Industry Revenue Share (%), by Country 2024 & 2032
- Figure 4: Europe Upper Extremity Prosthetic Industry Revenue (Million), by Country 2024 & 2032
- Figure 5: Europe Upper Extremity Prosthetic Industry Revenue Share (%), by Country 2024 & 2032
- Figure 6: Asia Pacific Upper Extremity Prosthetic Industry Revenue (Million), by Country 2024 & 2032
- Figure 7: Asia Pacific Upper Extremity Prosthetic Industry Revenue Share (%), by Country 2024 & 2032
- Figure 8: Middle East and Africa Upper Extremity Prosthetic Industry Revenue (Million), by Country 2024 & 2032
- Figure 9: Middle East and Africa Upper Extremity Prosthetic Industry Revenue Share (%), by Country 2024 & 2032
- Figure 10: South America Upper Extremity Prosthetic Industry Revenue (Million), by Country 2024 & 2032
- Figure 11: South America Upper Extremity Prosthetic Industry Revenue Share (%), by Country 2024 & 2032
- Figure 12: North America Upper Extremity Prosthetic Industry Revenue (Million), by Device Type 2024 & 2032
- Figure 13: North America Upper Extremity Prosthetic Industry Revenue Share (%), by Device Type 2024 & 2032
- Figure 14: North America Upper Extremity Prosthetic Industry Revenue (Million), by Component 2024 & 2032
- Figure 15: North America Upper Extremity Prosthetic Industry Revenue Share (%), by Component 2024 & 2032
- Figure 16: North America Upper Extremity Prosthetic Industry Revenue (Million), by End User 2024 & 2032
- Figure 17: North America Upper Extremity Prosthetic Industry Revenue Share (%), by End User 2024 & 2032
- Figure 18: North America Upper Extremity Prosthetic Industry Revenue (Million), by Country 2024 & 2032
- Figure 19: North America Upper Extremity Prosthetic Industry Revenue Share (%), by Country 2024 & 2032
- Figure 20: Europe Upper Extremity Prosthetic Industry Revenue (Million), by Device Type 2024 & 2032
- Figure 21: Europe Upper Extremity Prosthetic Industry Revenue Share (%), by Device Type 2024 & 2032
- Figure 22: Europe Upper Extremity Prosthetic Industry Revenue (Million), by Component 2024 & 2032
- Figure 23: Europe Upper Extremity Prosthetic Industry Revenue Share (%), by Component 2024 & 2032
- Figure 24: Europe Upper Extremity Prosthetic Industry Revenue (Million), by End User 2024 & 2032
- Figure 25: Europe Upper Extremity Prosthetic Industry Revenue Share (%), by End User 2024 & 2032
- Figure 26: Europe Upper Extremity Prosthetic Industry Revenue (Million), by Country 2024 & 2032
- Figure 27: Europe Upper Extremity Prosthetic Industry Revenue Share (%), by Country 2024 & 2032
- Figure 28: Asia Pacific Upper Extremity Prosthetic Industry Revenue (Million), by Device Type 2024 & 2032
- Figure 29: Asia Pacific Upper Extremity Prosthetic Industry Revenue Share (%), by Device Type 2024 & 2032
- Figure 30: Asia Pacific Upper Extremity Prosthetic Industry Revenue (Million), by Component 2024 & 2032
- Figure 31: Asia Pacific Upper Extremity Prosthetic Industry Revenue Share (%), by Component 2024 & 2032
- Figure 32: Asia Pacific Upper Extremity Prosthetic Industry Revenue (Million), by End User 2024 & 2032
- Figure 33: Asia Pacific Upper Extremity Prosthetic Industry Revenue Share (%), by End User 2024 & 2032
- Figure 34: Asia Pacific Upper Extremity Prosthetic Industry Revenue (Million), by Country 2024 & 2032
- Figure 35: Asia Pacific Upper Extremity Prosthetic Industry Revenue Share (%), by Country 2024 & 2032
- Figure 36: Middle East and Africa Upper Extremity Prosthetic Industry Revenue (Million), by Device Type 2024 & 2032
- Figure 37: Middle East and Africa Upper Extremity Prosthetic Industry Revenue Share (%), by Device Type 2024 & 2032
- Figure 38: Middle East and Africa Upper Extremity Prosthetic Industry Revenue (Million), by Component 2024 & 2032
- Figure 39: Middle East and Africa Upper Extremity Prosthetic Industry Revenue Share (%), by Component 2024 & 2032
- Figure 40: Middle East and Africa Upper Extremity Prosthetic Industry Revenue (Million), by End User 2024 & 2032
- Figure 41: Middle East and Africa Upper Extremity Prosthetic Industry Revenue Share (%), by End User 2024 & 2032
- Figure 42: Middle East and Africa Upper Extremity Prosthetic Industry Revenue (Million), by Country 2024 & 2032
- Figure 43: Middle East and Africa Upper Extremity Prosthetic Industry Revenue Share (%), by Country 2024 & 2032
- Figure 44: South America Upper Extremity Prosthetic Industry Revenue (Million), by Device Type 2024 & 2032
- Figure 45: South America Upper Extremity Prosthetic Industry Revenue Share (%), by Device Type 2024 & 2032
- Figure 46: South America Upper Extremity Prosthetic Industry Revenue (Million), by Component 2024 & 2032
- Figure 47: South America Upper Extremity Prosthetic Industry Revenue Share (%), by Component 2024 & 2032
- Figure 48: South America Upper Extremity Prosthetic Industry Revenue (Million), by End User 2024 & 2032
- Figure 49: South America Upper Extremity Prosthetic Industry Revenue Share (%), by End User 2024 & 2032
- Figure 50: South America Upper Extremity Prosthetic Industry Revenue (Million), by Country 2024 & 2032
- Figure 51: South America Upper Extremity Prosthetic Industry Revenue Share (%), by Country 2024 & 2032
List of Tables
- Table 1: Global Upper Extremity Prosthetic Industry Revenue Million Forecast, by Region 2019 & 2032
- Table 2: Global Upper Extremity Prosthetic Industry Revenue Million Forecast, by Device Type 2019 & 2032
- Table 3: Global Upper Extremity Prosthetic Industry Revenue Million Forecast, by Component 2019 & 2032
- Table 4: Global Upper Extremity Prosthetic Industry Revenue Million Forecast, by End User 2019 & 2032
- Table 5: Global Upper Extremity Prosthetic Industry Revenue Million Forecast, by Region 2019 & 2032
- Table 6: Global Upper Extremity Prosthetic Industry Revenue Million Forecast, by Country 2019 & 2032
- Table 7: United States Upper Extremity Prosthetic Industry Revenue (Million) Forecast, by Application 2019 & 2032
- Table 8: Canada Upper Extremity Prosthetic Industry Revenue (Million) Forecast, by Application 2019 & 2032
- Table 9: Mexico Upper Extremity Prosthetic Industry Revenue (Million) Forecast, by Application 2019 & 2032
- Table 10: Global Upper Extremity Prosthetic Industry Revenue Million Forecast, by Country 2019 & 2032
- Table 11: Germany Upper Extremity Prosthetic Industry Revenue (Million) Forecast, by Application 2019 & 2032
- Table 12: United Kingdom Upper Extremity Prosthetic Industry Revenue (Million) Forecast, by Application 2019 & 2032
- Table 13: France Upper Extremity Prosthetic Industry Revenue (Million) Forecast, by Application 2019 & 2032
- Table 14: Italy Upper Extremity Prosthetic Industry Revenue (Million) Forecast, by Application 2019 & 2032
- Table 15: Spain Upper Extremity Prosthetic Industry Revenue (Million) Forecast, by Application 2019 & 2032
- Table 16: Rest of Europe Upper Extremity Prosthetic Industry Revenue (Million) Forecast, by Application 2019 & 2032
- Table 17: Global Upper Extremity Prosthetic Industry Revenue Million Forecast, by Country 2019 & 2032
- Table 18: China Upper Extremity Prosthetic Industry Revenue (Million) Forecast, by Application 2019 & 2032
- Table 19: Japan Upper Extremity Prosthetic Industry Revenue (Million) Forecast, by Application 2019 & 2032
- Table 20: India Upper Extremity Prosthetic Industry Revenue (Million) Forecast, by Application 2019 & 2032
- Table 21: Australia Upper Extremity Prosthetic Industry Revenue (Million) Forecast, by Application 2019 & 2032
- Table 22: South Korea Upper Extremity Prosthetic Industry Revenue (Million) Forecast, by Application 2019 & 2032
- Table 23: Rest of Asia Pacific Upper Extremity Prosthetic Industry Revenue (Million) Forecast, by Application 2019 & 2032
- Table 24: Global Upper Extremity Prosthetic Industry Revenue Million Forecast, by Country 2019 & 2032
- Table 25: GCC Upper Extremity Prosthetic Industry Revenue (Million) Forecast, by Application 2019 & 2032
- Table 26: South Africa Upper Extremity Prosthetic Industry Revenue (Million) Forecast, by Application 2019 & 2032
- Table 27: Rest of Middle East and Africa Upper Extremity Prosthetic Industry Revenue (Million) Forecast, by Application 2019 & 2032
- Table 28: Global Upper Extremity Prosthetic Industry Revenue Million Forecast, by Country 2019 & 2032
- Table 29: Brazil Upper Extremity Prosthetic Industry Revenue (Million) Forecast, by Application 2019 & 2032
- Table 30: Argentina Upper Extremity Prosthetic Industry Revenue (Million) Forecast, by Application 2019 & 2032
- Table 31: Rest of South America Upper Extremity Prosthetic Industry Revenue (Million) Forecast, by Application 2019 & 2032
- Table 32: Global Upper Extremity Prosthetic Industry Revenue Million Forecast, by Device Type 2019 & 2032
- Table 33: Global Upper Extremity Prosthetic Industry Revenue Million Forecast, by Component 2019 & 2032
- Table 34: Global Upper Extremity Prosthetic Industry Revenue Million Forecast, by End User 2019 & 2032
- Table 35: Global Upper Extremity Prosthetic Industry Revenue Million Forecast, by Country 2019 & 2032
- Table 36: United States Upper Extremity Prosthetic Industry Revenue (Million) Forecast, by Application 2019 & 2032
- Table 37: Canada Upper Extremity Prosthetic Industry Revenue (Million) Forecast, by Application 2019 & 2032
- Table 38: Mexico Upper Extremity Prosthetic Industry Revenue (Million) Forecast, by Application 2019 & 2032
- Table 39: Global Upper Extremity Prosthetic Industry Revenue Million Forecast, by Device Type 2019 & 2032
- Table 40: Global Upper Extremity Prosthetic Industry Revenue Million Forecast, by Component 2019 & 2032
- Table 41: Global Upper Extremity Prosthetic Industry Revenue Million Forecast, by End User 2019 & 2032
- Table 42: Global Upper Extremity Prosthetic Industry Revenue Million Forecast, by Country 2019 & 2032
- Table 43: Germany Upper Extremity Prosthetic Industry Revenue (Million) Forecast, by Application 2019 & 2032
- Table 44: United Kingdom Upper Extremity Prosthetic Industry Revenue (Million) Forecast, by Application 2019 & 2032
- Table 45: France Upper Extremity Prosthetic Industry Revenue (Million) Forecast, by Application 2019 & 2032
- Table 46: Italy Upper Extremity Prosthetic Industry Revenue (Million) Forecast, by Application 2019 & 2032
- Table 47: Spain Upper Extremity Prosthetic Industry Revenue (Million) Forecast, by Application 2019 & 2032
- Table 48: Rest of Europe Upper Extremity Prosthetic Industry Revenue (Million) Forecast, by Application 2019 & 2032
- Table 49: Global Upper Extremity Prosthetic Industry Revenue Million Forecast, by Device Type 2019 & 2032
- Table 50: Global Upper Extremity Prosthetic Industry Revenue Million Forecast, by Component 2019 & 2032
- Table 51: Global Upper Extremity Prosthetic Industry Revenue Million Forecast, by End User 2019 & 2032
- Table 52: Global Upper Extremity Prosthetic Industry Revenue Million Forecast, by Country 2019 & 2032
- Table 53: China Upper Extremity Prosthetic Industry Revenue (Million) Forecast, by Application 2019 & 2032
- Table 54: Japan Upper Extremity Prosthetic Industry Revenue (Million) Forecast, by Application 2019 & 2032
- Table 55: India Upper Extremity Prosthetic Industry Revenue (Million) Forecast, by Application 2019 & 2032
- Table 56: Australia Upper Extremity Prosthetic Industry Revenue (Million) Forecast, by Application 2019 & 2032
- Table 57: South Korea Upper Extremity Prosthetic Industry Revenue (Million) Forecast, by Application 2019 & 2032
- Table 58: Rest of Asia Pacific Upper Extremity Prosthetic Industry Revenue (Million) Forecast, by Application 2019 & 2032
- Table 59: Global Upper Extremity Prosthetic Industry Revenue Million Forecast, by Device Type 2019 & 2032
- Table 60: Global Upper Extremity Prosthetic Industry Revenue Million Forecast, by Component 2019 & 2032
- Table 61: Global Upper Extremity Prosthetic Industry Revenue Million Forecast, by End User 2019 & 2032
- Table 62: Global Upper Extremity Prosthetic Industry Revenue Million Forecast, by Country 2019 & 2032
- Table 63: GCC Upper Extremity Prosthetic Industry Revenue (Million) Forecast, by Application 2019 & 2032
- Table 64: South Africa Upper Extremity Prosthetic Industry Revenue (Million) Forecast, by Application 2019 & 2032
- Table 65: Rest of Middle East and Africa Upper Extremity Prosthetic Industry Revenue (Million) Forecast, by Application 2019 & 2032
- Table 66: Global Upper Extremity Prosthetic Industry Revenue Million Forecast, by Device Type 2019 & 2032
- Table 67: Global Upper Extremity Prosthetic Industry Revenue Million Forecast, by Component 2019 & 2032
- Table 68: Global Upper Extremity Prosthetic Industry Revenue Million Forecast, by End User 2019 & 2032
- Table 69: Global Upper Extremity Prosthetic Industry Revenue Million Forecast, by Country 2019 & 2032
- Table 70: Brazil Upper Extremity Prosthetic Industry Revenue (Million) Forecast, by Application 2019 & 2032
- Table 71: Argentina Upper Extremity Prosthetic Industry Revenue (Million) Forecast, by Application 2019 & 2032
- Table 72: Rest of South America Upper Extremity Prosthetic Industry Revenue (Million) Forecast, by Application 2019 & 2032
Frequently Asked Questions
1. What is the projected Compound Annual Growth Rate (CAGR) of the Upper Extremity Prosthetic Industry?
The projected CAGR is approximately 5.50%.
2. Which companies are prominent players in the Upper Extremity Prosthetic Industry?
Key companies in the market include Steeper Inc, Protunix, Ossur, Ottobock SE & Co KgaA, Blatchford Limited (Endolite India Ltd), WillowWood Global LLC, Fillauer LLC, Open Bionics Ltd*List Not Exhaustive, Ortho Europe, COAPT LLC.
3. What are the main segments of the Upper Extremity Prosthetic Industry?
The market segments include Device Type, Component, End User.
4. Can you provide details about the market size?
The market size is estimated to be USD XX Million as of 2022.
5. What are some drivers contributing to market growth?
Increasing Number of Serious Injuries and Rise in Number of Amputations; Technological Advancements.
6. What are the notable trends driving market growth?
Myoelectric Expected to Hold Significant Share in the Upper Limb Prosthetics Market.
7. Are there any restraints impacting market growth?
High Prices of Prosthetics; Lack of Awareness in Developing Regions.
8. Can you provide examples of recent developments in the market?
In July 2021, stryker launched the Tornier shoulder arthroplasty portfolio and launched its Tornier product, the Perform Humeral Stem, which is designed with four collar diameters and is available in multiple lengths to optimize humeral fit and give surgeons the power to perform and the options to choose.
9. What pricing options are available for accessing the report?
Pricing options include single-user, multi-user, and enterprise licenses priced at USD 4750, USD 5250, and USD 8750 respectively.
10. Is the market size provided in terms of value or volume?
The market size is provided in terms of value, measured in Million.
11. Are there any specific market keywords associated with the report?
Yes, the market keyword associated with the report is "Upper Extremity Prosthetic Industry," which aids in identifying and referencing the specific market segment covered.
12. How do I determine which pricing option suits my needs best?
The pricing options vary based on user requirements and access needs. Individual users may opt for single-user licenses, while businesses requiring broader access may choose multi-user or enterprise licenses for cost-effective access to the report.
13. Are there any additional resources or data provided in the Upper Extremity Prosthetic Industry report?
While the report offers comprehensive insights, it's advisable to review the specific contents or supplementary materials provided to ascertain if additional resources or data are available.
14. How can I stay updated on further developments or reports in the Upper Extremity Prosthetic Industry?
To stay informed about further developments, trends, and reports in the Upper Extremity Prosthetic Industry, consider subscribing to industry newsletters, following relevant companies and organizations, or regularly checking reputable industry news sources and publications.
Methodology
Step 1 - Identification of Relevant Samples Size from Population Database


Step 2 - Approaches for Defining Global Market Size (Value, Volume* & Price*)

Note*: In applicable scenarios
Step 3 - Data Sources
Primary Research
- Web Analytics
- Survey Reports
- Research Institute
- Latest Research Reports
- Opinion Leaders
Secondary Research
- Annual Reports
- White Paper
- Latest Press Release
- Industry Association
- Paid Database
- Investor Presentations

Step 4 - Data Triangulation
Involves using different sources of information in order to increase the validity of a study
These sources are likely to be stakeholders in a program - participants, other researchers, program staff, other community members, and so on.
Then we put all data in single framework & apply various statistical tools to find out the dynamic on the market.
During the analysis stage, feedback from the stakeholder groups would be compared to determine areas of agreement as well as areas of divergence


