
Key Insights
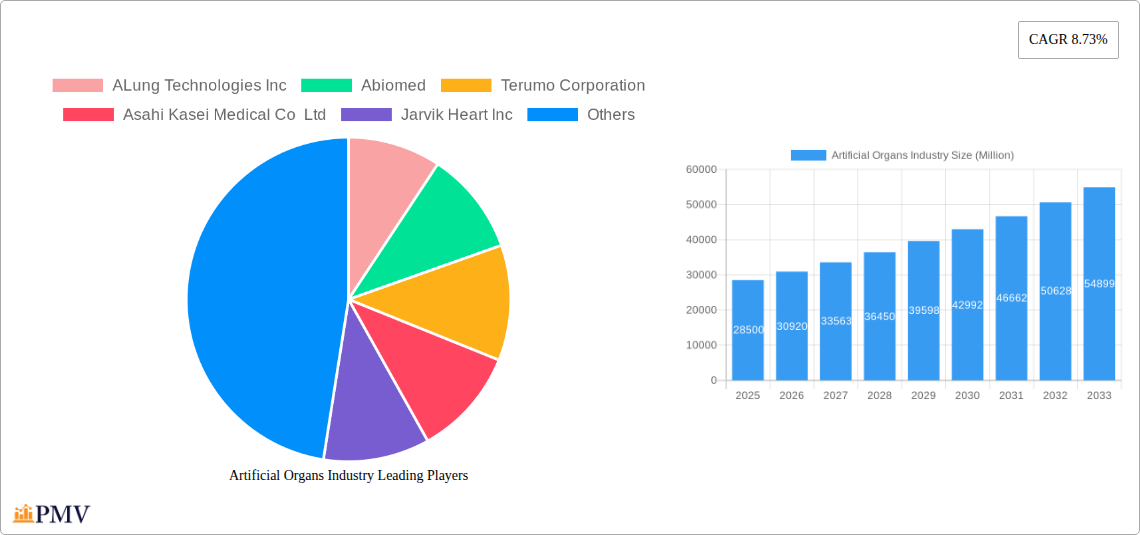
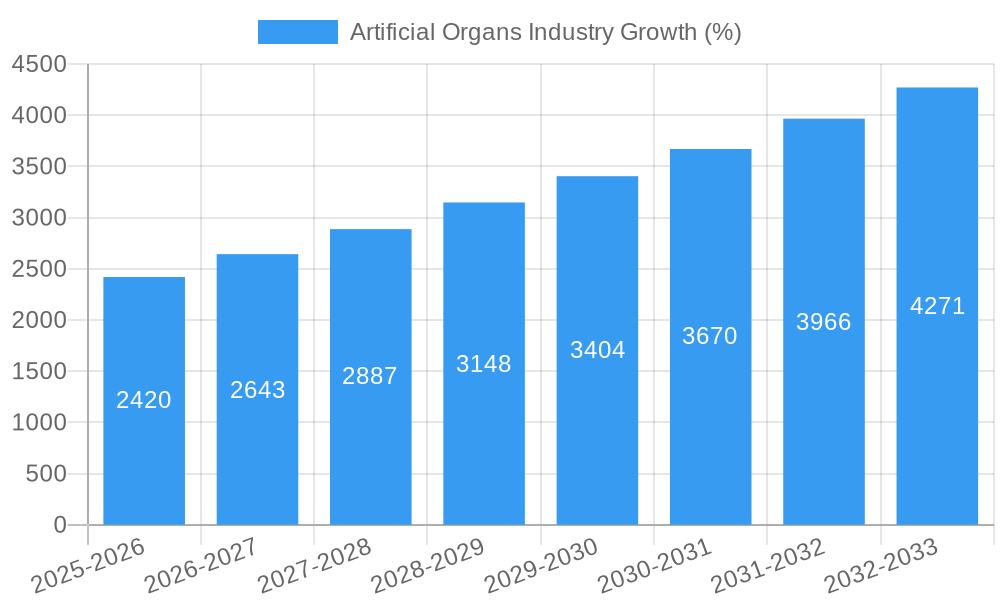
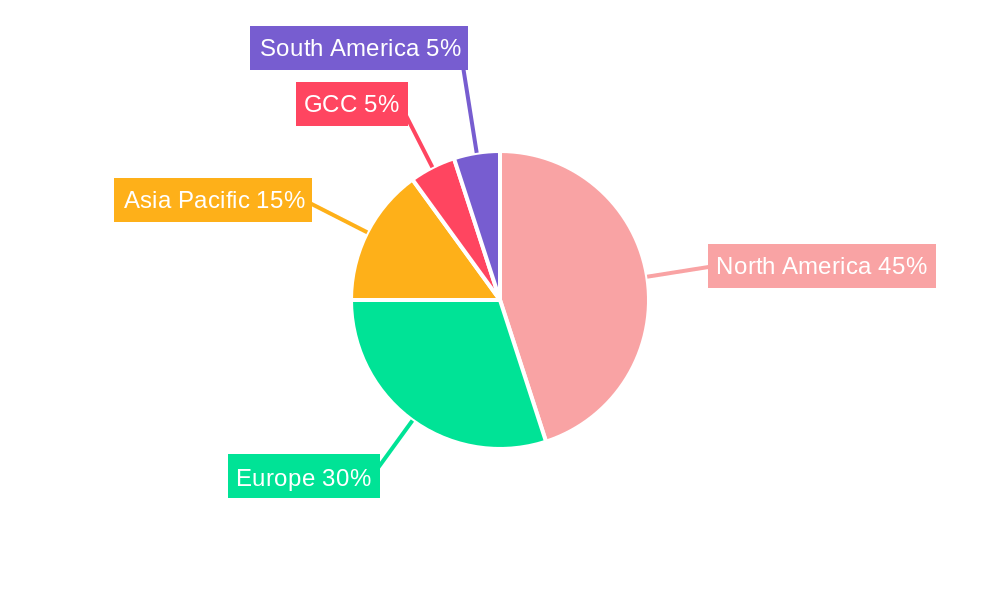
The global artificial organs market, valued at $28.5 billion in 2025, is projected to experience robust growth, driven by a compound annual growth rate (CAGR) of 8.73% from 2025 to 2033. This expansion is fueled by several key factors. The increasing prevalence of chronic organ failure, coupled with advancements in biomaterials science and surgical techniques, is leading to higher demand for artificial organs. Technological innovations, such as the development of more biocompatible and durable artificial organs, are extending patient lifespans and improving quality of life. Furthermore, rising geriatric populations in developed and developing nations contribute significantly to the market's growth trajectory. The market is segmented by organ type (primarily artificial hearts, but also encompassing other developing areas such as artificial kidneys and livers), end-user (hospitals, clinics, and ambulatory surgical centers), and geographic region. North America currently holds a dominant market share due to advanced healthcare infrastructure and high adoption rates of innovative medical technologies. However, Asia-Pacific is anticipated to witness significant growth in the coming years, driven by increasing healthcare expenditure and rising awareness of available treatment options.
The competitive landscape is characterized by a mix of established multinational corporations and innovative startups. Companies like Medtronic, Boston Scientific, and Abbott Laboratories are major players, leveraging their existing infrastructure and research capabilities. Smaller companies are focusing on niche areas and developing cutting-edge technologies, fostering competition and accelerating innovation within the sector. Regulatory approvals and reimbursement policies play a crucial role in market penetration, particularly in the artificial heart segment, which requires stringent regulatory scrutiny. While high initial costs associated with artificial organ implantation represent a restraint, the long-term cost-effectiveness compared to traditional treatments is increasingly recognized, potentially driving greater adoption in the future. Challenges remain in terms of long-term biocompatibility and rejection issues, but ongoing research and development initiatives are continuously addressing these concerns.
Artificial Organs Industry: Market Analysis & Forecast, 2019-2033
This comprehensive report provides a detailed analysis of the Artificial Organs Industry, offering invaluable insights for stakeholders across the value chain. The study period covers 2019-2033, with a base year of 2025 and a forecast period of 2025-2033. The historical period analyzed is 2019-2024. The report values are in Millions USD.
Artificial Organs Industry Market Structure & Competitive Dynamics
The artificial organs market is characterized by a moderately concentrated structure with a few dominant players and several smaller specialized companies. Market share is largely influenced by technological innovation, regulatory approvals, and strategic partnerships. The industry witnesses significant M&A activity, driven by the need to expand product portfolios and geographical reach. Deal values vary significantly, ranging from tens of Millions to several hundred Millions, depending on the size and scope of the acquired company or technology. Innovation ecosystems are largely driven by academic research institutions and government funding initiatives, as evidenced by recent grants like the USD 87 Million award to develop an artificial lung platform (February 2022).
Key factors influencing market dynamics include:
- Market Concentration: The top 5 players account for approximately xx% of the global market.
- Innovation Ecosystems: Strong collaboration between research institutions and industry players.
- Regulatory Frameworks: Stringent regulatory approvals influence market entry and product lifecycles.
- Product Substitutes: Limited substitutes currently exist for many artificial organs, however, advancements in regenerative medicine pose a potential long-term threat.
- End-User Trends: Increasing demand from aging populations and improved surgical techniques are driving growth.
- M&A Activities: Recent deals valued at xx Million have reshaped the competitive landscape. Further consolidation is expected.
Artificial Organs Industry Industry Trends & Insights
The artificial organs market is experiencing robust growth, driven by factors such as increasing prevalence of chronic diseases requiring organ replacement, advancements in biomaterials and miniaturization technologies, and rising disposable incomes in emerging markets. The global market is expected to witness a CAGR of xx% during the forecast period (2025-2033). Market penetration remains relatively low in several regions due to high costs and limited awareness, however, growing government support and insurance coverage is expected to enhance accessibility in the future. Technological advancements such as 3D printing, bioprinting and AI are impacting the manufacturing process and product design, fostering more customized solutions. Consumer preferences are shifting towards minimally invasive procedures and improved longevity and functionality of implants. Competitive dynamics are marked by ongoing innovation, strategic partnerships, and a focus on developing technologically superior and cost-effective products.
Dominant Markets & Segments in Artificial Organs Industry
The North American region currently dominates the global artificial organs market, driven by higher healthcare expenditure, technological advancements, and a sizable aging population. Within organ types, the artificial heart segment holds the largest market share due to the high prevalence of cardiovascular diseases. The hospital end-user segment accounts for the largest share, but the ambulatory surgical centers segment is experiencing significant growth due to rising preference for less invasive procedures.
Key Drivers of North American Dominance:
- Strong regulatory framework supporting medical innovation.
- High healthcare expenditure and insurance coverage.
- Presence of leading manufacturers and research institutions.
- Well-developed healthcare infrastructure.
Key Drivers of Artificial Heart Segment Dominance:
- High prevalence of cardiovascular diseases.
- Technological advancements in artificial heart design.
- Increased funding for cardiovascular research.
Key Drivers of Hospital Segment Dominance:
- Availability of advanced medical facilities and expertise.
- Complex procedures generally requiring hospital settings.
Artificial Organs Industry Product Innovations
Recent advancements have focused on biocompatible materials that minimize rejection rates, improved miniaturization for less invasive surgeries, and incorporation of sensors and actuators for enhanced functionality and remote monitoring. These innovations are enabling better patient outcomes and expanding the range of applications for artificial organs, increasing their market acceptance.
Report Segmentation & Scope
The report segments the artificial organs market by organ type (Artificial Heart, Artificial Lung, Artificial Kidney, etc.) and end-user (Hospitals, Clinics, Ambulatory Surgical Centers). Each segment is analyzed in terms of its size, growth rate, and competitive dynamics, providing a comprehensive overview of the market landscape. Growth projections are provided for each segment over the forecast period (2025-2033).
Key Drivers of Artificial Organs Industry Growth
Technological advancements in biomaterials and device design, increased prevalence of chronic diseases requiring organ replacements, rising healthcare expenditure, and supportive government initiatives are primary drivers of market growth. The growing geriatric population further fuels demand for artificial organs.
Challenges in the Artificial Organs Industry Sector
High cost of devices, stringent regulatory approvals, complex manufacturing processes, and potential ethical concerns related to the use of artificial organs represent significant challenges. Supply chain disruptions and the risk of device malfunctions also pose challenges. These factors can significantly impact market penetration and profitability.
Leading Players in the Artificial Organs Industry Market
- ALung Technologies Inc
- Abiomed
- Terumo Corporation
- Asahi Kasei Medical Co Ltd
- Jarvik Heart Inc
- Edward Lifesciences Corporation
- Medtronic PLC
- Carmat SA
- Getinge AB
- B Braun Melsungen AG
- Boston Scientific Corporation
- Baxter International Inc
- Berlin Heart GmbH
Key Developments in Artificial Organs Industry Sector
- February 2022: USD 87 Million grant awarded to Vanderbilt University, Carnegie Mellon University, and Cornell University for artificial lung platform development. This significantly impacts the R&D landscape.
- January 2022: IIT Kanpur launches Hridyantra program for advanced artificial heart development. This signifies increased academic and governmental focus on the sector.
Strategic Artificial Organs Industry Market Outlook
The artificial organs market is poised for significant growth, driven by technological innovation, increased funding for research, and the rising prevalence of chronic diseases. Strategic opportunities exist for companies focused on developing biocompatible materials, minimally invasive surgical techniques, and personalized medicine approaches. The market holds considerable potential for expansion in emerging economies with growing healthcare infrastructure.
Artificial Organs Industry Segmentation
-
1. Organ Type
-
1.1. Artificial Heart
- 1.1.1. Prosthetic Heart Valves
- 1.1.2. Ventricular Assist Devices
- 1.1.3. Cardiac Pacemakers
- 1.2. Artificial Kidney
- 1.3. Artificial Pancreas
- 1.4. Artificial Lungs
- 1.5. Cochlear Implants
- 1.6. Other Organ Types
-
1.1. Artificial Heart
Artificial Organs Industry Segmentation By Geography
-
1. North America
- 1.1. United States
- 1.2. Canada
- 1.3. Mexico
-
2. Europe
- 2.1. Germany
- 2.2. United Kingdom
- 2.3. France
- 2.4. Italy
- 2.5. Spain
- 2.6. Rest of Europe
-
3. Asia Pacific
- 3.1. China
- 3.2. Japan
- 3.3. India
- 3.4. Australia
- 3.5. South Korea
- 3.6. Rest of Asia Pacific
- 4. Middle East
-
5. GCC
- 5.1. South Africa
- 5.2. Rest of Middle East
-
6. South America
- 6.1. Brazil
- 6.2. Argentina
- 6.3. Rest of South America
Artificial Organs Industry REPORT HIGHLIGHTS
| Aspects | Details |
|---|---|
| Study Period | 2019-2033 |
| Base Year | 2024 |
| Estimated Year | 2025 |
| Forecast Period | 2025-2033 |
| Historical Period | 2019-2024 |
| Growth Rate | CAGR of 8.73% from 2019-2033 |
| Segmentation |
|
Table of Contents
- 1. Introduction
- 1.1. Research Scope
- 1.2. Market Segmentation
- 1.3. Research Methodology
- 1.4. Definitions and Assumptions
- 2. Executive Summary
- 2.1. Introduction
- 3. Market Dynamics
- 3.1. Introduction
- 3.2. Market Drivers
- 3.2.1. Rising Geriatric Population; Scarcity of Donor Organs; Technological Advancements in the Artificial Organ Sector
- 3.3. Market Restrains
- 3.3.1. Expensive Procedures; Risks Associated With Artificial Organs
- 3.4. Market Trends
- 3.4.1. Ventricular Assist Devices Subsegment Within Artificial Heart Segment is Expected to hold its Major Market Share in the Organ Type
- 4. Market Factor Analysis
- 4.1. Porters Five Forces
- 4.2. Supply/Value Chain
- 4.3. PESTEL analysis
- 4.4. Market Entropy
- 4.5. Patent/Trademark Analysis
- 5. Global Artificial Organs Industry Analysis, Insights and Forecast, 2019-2031
- 5.1. Market Analysis, Insights and Forecast - by Organ Type
- 5.1.1. Artificial Heart
- 5.1.1.1. Prosthetic Heart Valves
- 5.1.1.2. Ventricular Assist Devices
- 5.1.1.3. Cardiac Pacemakers
- 5.1.2. Artificial Kidney
- 5.1.3. Artificial Pancreas
- 5.1.4. Artificial Lungs
- 5.1.5. Cochlear Implants
- 5.1.6. Other Organ Types
- 5.1.1. Artificial Heart
- 5.2. Market Analysis, Insights and Forecast - by Region
- 5.2.1. North America
- 5.2.2. Europe
- 5.2.3. Asia Pacific
- 5.2.4. Middle East
- 5.2.5. GCC
- 5.2.6. South America
- 5.1. Market Analysis, Insights and Forecast - by Organ Type
- 6. North America Artificial Organs Industry Analysis, Insights and Forecast, 2019-2031
- 6.1. Market Analysis, Insights and Forecast - by Organ Type
- 6.1.1. Artificial Heart
- 6.1.1.1. Prosthetic Heart Valves
- 6.1.1.2. Ventricular Assist Devices
- 6.1.1.3. Cardiac Pacemakers
- 6.1.2. Artificial Kidney
- 6.1.3. Artificial Pancreas
- 6.1.4. Artificial Lungs
- 6.1.5. Cochlear Implants
- 6.1.6. Other Organ Types
- 6.1.1. Artificial Heart
- 6.1. Market Analysis, Insights and Forecast - by Organ Type
- 7. Europe Artificial Organs Industry Analysis, Insights and Forecast, 2019-2031
- 7.1. Market Analysis, Insights and Forecast - by Organ Type
- 7.1.1. Artificial Heart
- 7.1.1.1. Prosthetic Heart Valves
- 7.1.1.2. Ventricular Assist Devices
- 7.1.1.3. Cardiac Pacemakers
- 7.1.2. Artificial Kidney
- 7.1.3. Artificial Pancreas
- 7.1.4. Artificial Lungs
- 7.1.5. Cochlear Implants
- 7.1.6. Other Organ Types
- 7.1.1. Artificial Heart
- 7.1. Market Analysis, Insights and Forecast - by Organ Type
- 8. Asia Pacific Artificial Organs Industry Analysis, Insights and Forecast, 2019-2031
- 8.1. Market Analysis, Insights and Forecast - by Organ Type
- 8.1.1. Artificial Heart
- 8.1.1.1. Prosthetic Heart Valves
- 8.1.1.2. Ventricular Assist Devices
- 8.1.1.3. Cardiac Pacemakers
- 8.1.2. Artificial Kidney
- 8.1.3. Artificial Pancreas
- 8.1.4. Artificial Lungs
- 8.1.5. Cochlear Implants
- 8.1.6. Other Organ Types
- 8.1.1. Artificial Heart
- 8.1. Market Analysis, Insights and Forecast - by Organ Type
- 9. Middle East Artificial Organs Industry Analysis, Insights and Forecast, 2019-2031
- 9.1. Market Analysis, Insights and Forecast - by Organ Type
- 9.1.1. Artificial Heart
- 9.1.1.1. Prosthetic Heart Valves
- 9.1.1.2. Ventricular Assist Devices
- 9.1.1.3. Cardiac Pacemakers
- 9.1.2. Artificial Kidney
- 9.1.3. Artificial Pancreas
- 9.1.4. Artificial Lungs
- 9.1.5. Cochlear Implants
- 9.1.6. Other Organ Types
- 9.1.1. Artificial Heart
- 9.1. Market Analysis, Insights and Forecast - by Organ Type
- 10. GCC Artificial Organs Industry Analysis, Insights and Forecast, 2019-2031
- 10.1. Market Analysis, Insights and Forecast - by Organ Type
- 10.1.1. Artificial Heart
- 10.1.1.1. Prosthetic Heart Valves
- 10.1.1.2. Ventricular Assist Devices
- 10.1.1.3. Cardiac Pacemakers
- 10.1.2. Artificial Kidney
- 10.1.3. Artificial Pancreas
- 10.1.4. Artificial Lungs
- 10.1.5. Cochlear Implants
- 10.1.6. Other Organ Types
- 10.1.1. Artificial Heart
- 10.1. Market Analysis, Insights and Forecast - by Organ Type
- 11. South America Artificial Organs Industry Analysis, Insights and Forecast, 2019-2031
- 11.1. Market Analysis, Insights and Forecast - by Organ Type
- 11.1.1. Artificial Heart
- 11.1.1.1. Prosthetic Heart Valves
- 11.1.1.2. Ventricular Assist Devices
- 11.1.1.3. Cardiac Pacemakers
- 11.1.2. Artificial Kidney
- 11.1.3. Artificial Pancreas
- 11.1.4. Artificial Lungs
- 11.1.5. Cochlear Implants
- 11.1.6. Other Organ Types
- 11.1.1. Artificial Heart
- 11.1. Market Analysis, Insights and Forecast - by Organ Type
- 12. North America Artificial Organs Industry Analysis, Insights and Forecast, 2019-2031
- 12.1. Market Analysis, Insights and Forecast - By Country/Sub-region
- 12.1.1. undefined
- 13. Europe Artificial Organs Industry Analysis, Insights and Forecast, 2019-2031
- 13.1. Market Analysis, Insights and Forecast - By Country/Sub-region
- 13.1.1. undefined
- 14. Asia Pacific Artificial Organs Industry Analysis, Insights and Forecast, 2019-2031
- 14.1. Market Analysis, Insights and Forecast - By Country/Sub-region
- 14.1.1. undefined
- 15. GCC Artificial Organs Industry Analysis, Insights and Forecast, 2019-2031
- 15.1. Market Analysis, Insights and Forecast - By Country/Sub-region
- 15.1.1. undefined
- 16. South America Artificial Organs Industry Analysis, Insights and Forecast, 2019-2031
- 16.1. Market Analysis, Insights and Forecast - By Country/Sub-region
- 16.1.1. undefined
- 17. Competitive Analysis
- 17.1. Global Market Share Analysis 2024
- 17.2. Company Profiles
- 17.2.1 ALung Technologies Inc
- 17.2.1.1. Overview
- 17.2.1.2. Products
- 17.2.1.3. SWOT Analysis
- 17.2.1.4. Recent Developments
- 17.2.1.5. Financials (Based on Availability)
- 17.2.2 Abiomed
- 17.2.2.1. Overview
- 17.2.2.2. Products
- 17.2.2.3. SWOT Analysis
- 17.2.2.4. Recent Developments
- 17.2.2.5. Financials (Based on Availability)
- 17.2.3 Terumo Corporation
- 17.2.3.1. Overview
- 17.2.3.2. Products
- 17.2.3.3. SWOT Analysis
- 17.2.3.4. Recent Developments
- 17.2.3.5. Financials (Based on Availability)
- 17.2.4 Asahi Kasei Medical Co Ltd
- 17.2.4.1. Overview
- 17.2.4.2. Products
- 17.2.4.3. SWOT Analysis
- 17.2.4.4. Recent Developments
- 17.2.4.5. Financials (Based on Availability)
- 17.2.5 Jarvik Heart Inc
- 17.2.5.1. Overview
- 17.2.5.2. Products
- 17.2.5.3. SWOT Analysis
- 17.2.5.4. Recent Developments
- 17.2.5.5. Financials (Based on Availability)
- 17.2.6 Edward Lifesciences Corporation
- 17.2.6.1. Overview
- 17.2.6.2. Products
- 17.2.6.3. SWOT Analysis
- 17.2.6.4. Recent Developments
- 17.2.6.5. Financials (Based on Availability)
- 17.2.7 Medtronic PLC
- 17.2.7.1. Overview
- 17.2.7.2. Products
- 17.2.7.3. SWOT Analysis
- 17.2.7.4. Recent Developments
- 17.2.7.5. Financials (Based on Availability)
- 17.2.8 Carmat SA
- 17.2.8.1. Overview
- 17.2.8.2. Products
- 17.2.8.3. SWOT Analysis
- 17.2.8.4. Recent Developments
- 17.2.8.5. Financials (Based on Availability)
- 17.2.9 Getinge AB
- 17.2.9.1. Overview
- 17.2.9.2. Products
- 17.2.9.3. SWOT Analysis
- 17.2.9.4. Recent Developments
- 17.2.9.5. Financials (Based on Availability)
- 17.2.10 B Braun Melsungen AG
- 17.2.10.1. Overview
- 17.2.10.2. Products
- 17.2.10.3. SWOT Analysis
- 17.2.10.4. Recent Developments
- 17.2.10.5. Financials (Based on Availability)
- 17.2.11 Boston Scientific Corporation
- 17.2.11.1. Overview
- 17.2.11.2. Products
- 17.2.11.3. SWOT Analysis
- 17.2.11.4. Recent Developments
- 17.2.11.5. Financials (Based on Availability)
- 17.2.12 Baxter International Inc
- 17.2.12.1. Overview
- 17.2.12.2. Products
- 17.2.12.3. SWOT Analysis
- 17.2.12.4. Recent Developments
- 17.2.12.5. Financials (Based on Availability)
- 17.2.13 Berlin Heart GmbH
- 17.2.13.1. Overview
- 17.2.13.2. Products
- 17.2.13.3. SWOT Analysis
- 17.2.13.4. Recent Developments
- 17.2.13.5. Financials (Based on Availability)
- 17.2.1 ALung Technologies Inc
List of Figures
- Figure 1: Global Artificial Organs Industry Revenue Breakdown (Million, %) by Region 2024 & 2032
- Figure 2: Global Artificial Organs Industry Volume Breakdown (K Unit, %) by Region 2024 & 2032
- Figure 3: North America Artificial Organs Industry Revenue (Million), by Country 2024 & 2032
- Figure 4: North America Artificial Organs Industry Volume (K Unit), by Country 2024 & 2032
- Figure 5: North America Artificial Organs Industry Revenue Share (%), by Country 2024 & 2032
- Figure 6: North America Artificial Organs Industry Volume Share (%), by Country 2024 & 2032
- Figure 7: Europe Artificial Organs Industry Revenue (Million), by Country 2024 & 2032
- Figure 8: Europe Artificial Organs Industry Volume (K Unit), by Country 2024 & 2032
- Figure 9: Europe Artificial Organs Industry Revenue Share (%), by Country 2024 & 2032
- Figure 10: Europe Artificial Organs Industry Volume Share (%), by Country 2024 & 2032
- Figure 11: Asia Pacific Artificial Organs Industry Revenue (Million), by Country 2024 & 2032
- Figure 12: Asia Pacific Artificial Organs Industry Volume (K Unit), by Country 2024 & 2032
- Figure 13: Asia Pacific Artificial Organs Industry Revenue Share (%), by Country 2024 & 2032
- Figure 14: Asia Pacific Artificial Organs Industry Volume Share (%), by Country 2024 & 2032
- Figure 15: GCC Artificial Organs Industry Revenue (Million), by Country 2024 & 2032
- Figure 16: GCC Artificial Organs Industry Volume (K Unit), by Country 2024 & 2032
- Figure 17: GCC Artificial Organs Industry Revenue Share (%), by Country 2024 & 2032
- Figure 18: GCC Artificial Organs Industry Volume Share (%), by Country 2024 & 2032
- Figure 19: South America Artificial Organs Industry Revenue (Million), by Country 2024 & 2032
- Figure 20: South America Artificial Organs Industry Volume (K Unit), by Country 2024 & 2032
- Figure 21: South America Artificial Organs Industry Revenue Share (%), by Country 2024 & 2032
- Figure 22: South America Artificial Organs Industry Volume Share (%), by Country 2024 & 2032
- Figure 23: North America Artificial Organs Industry Revenue (Million), by Organ Type 2024 & 2032
- Figure 24: North America Artificial Organs Industry Volume (K Unit), by Organ Type 2024 & 2032
- Figure 25: North America Artificial Organs Industry Revenue Share (%), by Organ Type 2024 & 2032
- Figure 26: North America Artificial Organs Industry Volume Share (%), by Organ Type 2024 & 2032
- Figure 27: North America Artificial Organs Industry Revenue (Million), by Country 2024 & 2032
- Figure 28: North America Artificial Organs Industry Volume (K Unit), by Country 2024 & 2032
- Figure 29: North America Artificial Organs Industry Revenue Share (%), by Country 2024 & 2032
- Figure 30: North America Artificial Organs Industry Volume Share (%), by Country 2024 & 2032
- Figure 31: Europe Artificial Organs Industry Revenue (Million), by Organ Type 2024 & 2032
- Figure 32: Europe Artificial Organs Industry Volume (K Unit), by Organ Type 2024 & 2032
- Figure 33: Europe Artificial Organs Industry Revenue Share (%), by Organ Type 2024 & 2032
- Figure 34: Europe Artificial Organs Industry Volume Share (%), by Organ Type 2024 & 2032
- Figure 35: Europe Artificial Organs Industry Revenue (Million), by Country 2024 & 2032
- Figure 36: Europe Artificial Organs Industry Volume (K Unit), by Country 2024 & 2032
- Figure 37: Europe Artificial Organs Industry Revenue Share (%), by Country 2024 & 2032
- Figure 38: Europe Artificial Organs Industry Volume Share (%), by Country 2024 & 2032
- Figure 39: Asia Pacific Artificial Organs Industry Revenue (Million), by Organ Type 2024 & 2032
- Figure 40: Asia Pacific Artificial Organs Industry Volume (K Unit), by Organ Type 2024 & 2032
- Figure 41: Asia Pacific Artificial Organs Industry Revenue Share (%), by Organ Type 2024 & 2032
- Figure 42: Asia Pacific Artificial Organs Industry Volume Share (%), by Organ Type 2024 & 2032
- Figure 43: Asia Pacific Artificial Organs Industry Revenue (Million), by Country 2024 & 2032
- Figure 44: Asia Pacific Artificial Organs Industry Volume (K Unit), by Country 2024 & 2032
- Figure 45: Asia Pacific Artificial Organs Industry Revenue Share (%), by Country 2024 & 2032
- Figure 46: Asia Pacific Artificial Organs Industry Volume Share (%), by Country 2024 & 2032
- Figure 47: Middle East Artificial Organs Industry Revenue (Million), by Organ Type 2024 & 2032
- Figure 48: Middle East Artificial Organs Industry Volume (K Unit), by Organ Type 2024 & 2032
- Figure 49: Middle East Artificial Organs Industry Revenue Share (%), by Organ Type 2024 & 2032
- Figure 50: Middle East Artificial Organs Industry Volume Share (%), by Organ Type 2024 & 2032
- Figure 51: Middle East Artificial Organs Industry Revenue (Million), by Country 2024 & 2032
- Figure 52: Middle East Artificial Organs Industry Volume (K Unit), by Country 2024 & 2032
- Figure 53: Middle East Artificial Organs Industry Revenue Share (%), by Country 2024 & 2032
- Figure 54: Middle East Artificial Organs Industry Volume Share (%), by Country 2024 & 2032
- Figure 55: GCC Artificial Organs Industry Revenue (Million), by Organ Type 2024 & 2032
- Figure 56: GCC Artificial Organs Industry Volume (K Unit), by Organ Type 2024 & 2032
- Figure 57: GCC Artificial Organs Industry Revenue Share (%), by Organ Type 2024 & 2032
- Figure 58: GCC Artificial Organs Industry Volume Share (%), by Organ Type 2024 & 2032
- Figure 59: GCC Artificial Organs Industry Revenue (Million), by Country 2024 & 2032
- Figure 60: GCC Artificial Organs Industry Volume (K Unit), by Country 2024 & 2032
- Figure 61: GCC Artificial Organs Industry Revenue Share (%), by Country 2024 & 2032
- Figure 62: GCC Artificial Organs Industry Volume Share (%), by Country 2024 & 2032
- Figure 63: South America Artificial Organs Industry Revenue (Million), by Organ Type 2024 & 2032
- Figure 64: South America Artificial Organs Industry Volume (K Unit), by Organ Type 2024 & 2032
- Figure 65: South America Artificial Organs Industry Revenue Share (%), by Organ Type 2024 & 2032
- Figure 66: South America Artificial Organs Industry Volume Share (%), by Organ Type 2024 & 2032
- Figure 67: South America Artificial Organs Industry Revenue (Million), by Country 2024 & 2032
- Figure 68: South America Artificial Organs Industry Volume (K Unit), by Country 2024 & 2032
- Figure 69: South America Artificial Organs Industry Revenue Share (%), by Country 2024 & 2032
- Figure 70: South America Artificial Organs Industry Volume Share (%), by Country 2024 & 2032
List of Tables
- Table 1: Global Artificial Organs Industry Revenue Million Forecast, by Region 2019 & 2032
- Table 2: Global Artificial Organs Industry Volume K Unit Forecast, by Region 2019 & 2032
- Table 3: Global Artificial Organs Industry Revenue Million Forecast, by Organ Type 2019 & 2032
- Table 4: Global Artificial Organs Industry Volume K Unit Forecast, by Organ Type 2019 & 2032
- Table 5: Global Artificial Organs Industry Revenue Million Forecast, by Region 2019 & 2032
- Table 6: Global Artificial Organs Industry Volume K Unit Forecast, by Region 2019 & 2032
- Table 7: Global Artificial Organs Industry Revenue Million Forecast, by Country 2019 & 2032
- Table 8: Global Artificial Organs Industry Volume K Unit Forecast, by Country 2019 & 2032
- Table 9: Global Artificial Organs Industry Revenue Million Forecast, by Country 2019 & 2032
- Table 10: Global Artificial Organs Industry Volume K Unit Forecast, by Country 2019 & 2032
- Table 11: Global Artificial Organs Industry Revenue Million Forecast, by Country 2019 & 2032
- Table 12: Global Artificial Organs Industry Volume K Unit Forecast, by Country 2019 & 2032
- Table 13: Global Artificial Organs Industry Revenue Million Forecast, by Country 2019 & 2032
- Table 14: Global Artificial Organs Industry Volume K Unit Forecast, by Country 2019 & 2032
- Table 15: Global Artificial Organs Industry Revenue Million Forecast, by Country 2019 & 2032
- Table 16: Global Artificial Organs Industry Volume K Unit Forecast, by Country 2019 & 2032
- Table 17: Global Artificial Organs Industry Revenue Million Forecast, by Organ Type 2019 & 2032
- Table 18: Global Artificial Organs Industry Volume K Unit Forecast, by Organ Type 2019 & 2032
- Table 19: Global Artificial Organs Industry Revenue Million Forecast, by Country 2019 & 2032
- Table 20: Global Artificial Organs Industry Volume K Unit Forecast, by Country 2019 & 2032
- Table 21: United States Artificial Organs Industry Revenue (Million) Forecast, by Application 2019 & 2032
- Table 22: United States Artificial Organs Industry Volume (K Unit) Forecast, by Application 2019 & 2032
- Table 23: Canada Artificial Organs Industry Revenue (Million) Forecast, by Application 2019 & 2032
- Table 24: Canada Artificial Organs Industry Volume (K Unit) Forecast, by Application 2019 & 2032
- Table 25: Mexico Artificial Organs Industry Revenue (Million) Forecast, by Application 2019 & 2032
- Table 26: Mexico Artificial Organs Industry Volume (K Unit) Forecast, by Application 2019 & 2032
- Table 27: Global Artificial Organs Industry Revenue Million Forecast, by Organ Type 2019 & 2032
- Table 28: Global Artificial Organs Industry Volume K Unit Forecast, by Organ Type 2019 & 2032
- Table 29: Global Artificial Organs Industry Revenue Million Forecast, by Country 2019 & 2032
- Table 30: Global Artificial Organs Industry Volume K Unit Forecast, by Country 2019 & 2032
- Table 31: Germany Artificial Organs Industry Revenue (Million) Forecast, by Application 2019 & 2032
- Table 32: Germany Artificial Organs Industry Volume (K Unit) Forecast, by Application 2019 & 2032
- Table 33: United Kingdom Artificial Organs Industry Revenue (Million) Forecast, by Application 2019 & 2032
- Table 34: United Kingdom Artificial Organs Industry Volume (K Unit) Forecast, by Application 2019 & 2032
- Table 35: France Artificial Organs Industry Revenue (Million) Forecast, by Application 2019 & 2032
- Table 36: France Artificial Organs Industry Volume (K Unit) Forecast, by Application 2019 & 2032
- Table 37: Italy Artificial Organs Industry Revenue (Million) Forecast, by Application 2019 & 2032
- Table 38: Italy Artificial Organs Industry Volume (K Unit) Forecast, by Application 2019 & 2032
- Table 39: Spain Artificial Organs Industry Revenue (Million) Forecast, by Application 2019 & 2032
- Table 40: Spain Artificial Organs Industry Volume (K Unit) Forecast, by Application 2019 & 2032
- Table 41: Rest of Europe Artificial Organs Industry Revenue (Million) Forecast, by Application 2019 & 2032
- Table 42: Rest of Europe Artificial Organs Industry Volume (K Unit) Forecast, by Application 2019 & 2032
- Table 43: Global Artificial Organs Industry Revenue Million Forecast, by Organ Type 2019 & 2032
- Table 44: Global Artificial Organs Industry Volume K Unit Forecast, by Organ Type 2019 & 2032
- Table 45: Global Artificial Organs Industry Revenue Million Forecast, by Country 2019 & 2032
- Table 46: Global Artificial Organs Industry Volume K Unit Forecast, by Country 2019 & 2032
- Table 47: China Artificial Organs Industry Revenue (Million) Forecast, by Application 2019 & 2032
- Table 48: China Artificial Organs Industry Volume (K Unit) Forecast, by Application 2019 & 2032
- Table 49: Japan Artificial Organs Industry Revenue (Million) Forecast, by Application 2019 & 2032
- Table 50: Japan Artificial Organs Industry Volume (K Unit) Forecast, by Application 2019 & 2032
- Table 51: India Artificial Organs Industry Revenue (Million) Forecast, by Application 2019 & 2032
- Table 52: India Artificial Organs Industry Volume (K Unit) Forecast, by Application 2019 & 2032
- Table 53: Australia Artificial Organs Industry Revenue (Million) Forecast, by Application 2019 & 2032
- Table 54: Australia Artificial Organs Industry Volume (K Unit) Forecast, by Application 2019 & 2032
- Table 55: South Korea Artificial Organs Industry Revenue (Million) Forecast, by Application 2019 & 2032
- Table 56: South Korea Artificial Organs Industry Volume (K Unit) Forecast, by Application 2019 & 2032
- Table 57: Rest of Asia Pacific Artificial Organs Industry Revenue (Million) Forecast, by Application 2019 & 2032
- Table 58: Rest of Asia Pacific Artificial Organs Industry Volume (K Unit) Forecast, by Application 2019 & 2032
- Table 59: Global Artificial Organs Industry Revenue Million Forecast, by Organ Type 2019 & 2032
- Table 60: Global Artificial Organs Industry Volume K Unit Forecast, by Organ Type 2019 & 2032
- Table 61: Global Artificial Organs Industry Revenue Million Forecast, by Country 2019 & 2032
- Table 62: Global Artificial Organs Industry Volume K Unit Forecast, by Country 2019 & 2032
- Table 63: Global Artificial Organs Industry Revenue Million Forecast, by Organ Type 2019 & 2032
- Table 64: Global Artificial Organs Industry Volume K Unit Forecast, by Organ Type 2019 & 2032
- Table 65: Global Artificial Organs Industry Revenue Million Forecast, by Country 2019 & 2032
- Table 66: Global Artificial Organs Industry Volume K Unit Forecast, by Country 2019 & 2032
- Table 67: South Africa Artificial Organs Industry Revenue (Million) Forecast, by Application 2019 & 2032
- Table 68: South Africa Artificial Organs Industry Volume (K Unit) Forecast, by Application 2019 & 2032
- Table 69: Rest of Middle East Artificial Organs Industry Revenue (Million) Forecast, by Application 2019 & 2032
- Table 70: Rest of Middle East Artificial Organs Industry Volume (K Unit) Forecast, by Application 2019 & 2032
- Table 71: Global Artificial Organs Industry Revenue Million Forecast, by Organ Type 2019 & 2032
- Table 72: Global Artificial Organs Industry Volume K Unit Forecast, by Organ Type 2019 & 2032
- Table 73: Global Artificial Organs Industry Revenue Million Forecast, by Country 2019 & 2032
- Table 74: Global Artificial Organs Industry Volume K Unit Forecast, by Country 2019 & 2032
- Table 75: Brazil Artificial Organs Industry Revenue (Million) Forecast, by Application 2019 & 2032
- Table 76: Brazil Artificial Organs Industry Volume (K Unit) Forecast, by Application 2019 & 2032
- Table 77: Argentina Artificial Organs Industry Revenue (Million) Forecast, by Application 2019 & 2032
- Table 78: Argentina Artificial Organs Industry Volume (K Unit) Forecast, by Application 2019 & 2032
- Table 79: Rest of South America Artificial Organs Industry Revenue (Million) Forecast, by Application 2019 & 2032
- Table 80: Rest of South America Artificial Organs Industry Volume (K Unit) Forecast, by Application 2019 & 2032
Frequently Asked Questions
1. What is the projected Compound Annual Growth Rate (CAGR) of the Artificial Organs Industry?
The projected CAGR is approximately 8.73%.
2. Which companies are prominent players in the Artificial Organs Industry?
Key companies in the market include ALung Technologies Inc, Abiomed, Terumo Corporation, Asahi Kasei Medical Co Ltd, Jarvik Heart Inc, Edward Lifesciences Corporation, Medtronic PLC, Carmat SA, Getinge AB, B Braun Melsungen AG, Boston Scientific Corporation, Baxter International Inc, Berlin Heart GmbH.
3. What are the main segments of the Artificial Organs Industry?
The market segments include Organ Type.
4. Can you provide details about the market size?
The market size is estimated to be USD 28.50 Million as of 2022.
5. What are some drivers contributing to market growth?
Rising Geriatric Population; Scarcity of Donor Organs; Technological Advancements in the Artificial Organ Sector.
6. What are the notable trends driving market growth?
Ventricular Assist Devices Subsegment Within Artificial Heart Segment is Expected to hold its Major Market Share in the Organ Type.
7. Are there any restraints impacting market growth?
Expensive Procedures; Risks Associated With Artificial Organs.
8. Can you provide examples of recent developments in the market?
In February 2022, Vanderbilt University Medical Center, Carnegie Mellon University, and Cornell University received a four-year, USD 87 million grant from the Department of Defense Congressionally Directed Medical Research Program (CDMRP) to create the artificial lung platform, which would allow patients with incurable lung disease who can't wait for a lung transplant.
9. What pricing options are available for accessing the report?
Pricing options include single-user, multi-user, and enterprise licenses priced at USD 4750, USD 5250, and USD 8750 respectively.
10. Is the market size provided in terms of value or volume?
The market size is provided in terms of value, measured in Million and volume, measured in K Unit.
11. Are there any specific market keywords associated with the report?
Yes, the market keyword associated with the report is "Artificial Organs Industry," which aids in identifying and referencing the specific market segment covered.
12. How do I determine which pricing option suits my needs best?
The pricing options vary based on user requirements and access needs. Individual users may opt for single-user licenses, while businesses requiring broader access may choose multi-user or enterprise licenses for cost-effective access to the report.
13. Are there any additional resources or data provided in the Artificial Organs Industry report?
While the report offers comprehensive insights, it's advisable to review the specific contents or supplementary materials provided to ascertain if additional resources or data are available.
14. How can I stay updated on further developments or reports in the Artificial Organs Industry?
To stay informed about further developments, trends, and reports in the Artificial Organs Industry, consider subscribing to industry newsletters, following relevant companies and organizations, or regularly checking reputable industry news sources and publications.
Methodology
Step 1 - Identification of Relevant Samples Size from Population Database


Step 2 - Approaches for Defining Global Market Size (Value, Volume* & Price*)

Note*: In applicable scenarios
Step 3 - Data Sources
Primary Research
- Web Analytics
- Survey Reports
- Research Institute
- Latest Research Reports
- Opinion Leaders
Secondary Research
- Annual Reports
- White Paper
- Latest Press Release
- Industry Association
- Paid Database
- Investor Presentations

Step 4 - Data Triangulation
Involves using different sources of information in order to increase the validity of a study
These sources are likely to be stakeholders in a program - participants, other researchers, program staff, other community members, and so on.
Then we put all data in single framework & apply various statistical tools to find out the dynamic on the market.
During the analysis stage, feedback from the stakeholder groups would be compared to determine areas of agreement as well as areas of divergence


