
Key Insights
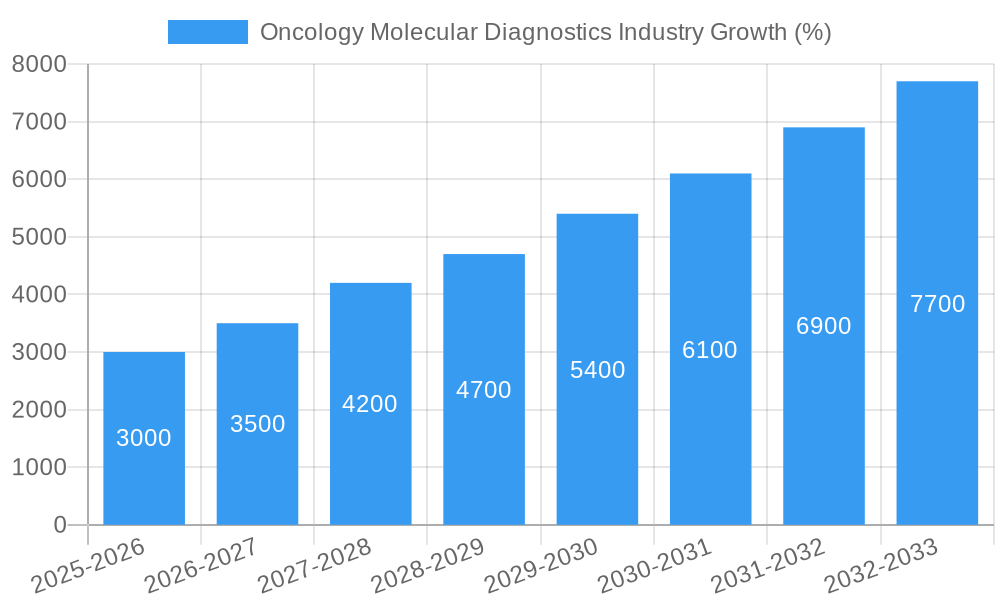
The oncology molecular diagnostics market is experiencing robust growth, driven by the increasing prevalence of cancer globally, advancements in diagnostic technologies, and a rising demand for personalized medicine. The market's Compound Annual Growth Rate (CAGR) exceeding 12% signifies a substantial expansion over the forecast period (2025-2033). Key drivers include the escalating incidence of various cancers like breast, prostate, colorectal, and lung cancers, along with the growing adoption of early detection strategies. Technological advancements, such as Polymerase Chain Reaction (PCR), Next-Generation Sequencing (NGS), and other molecular diagnostic techniques, are enhancing diagnostic accuracy and enabling targeted therapies. The market segmentation reveals significant opportunities across application types (breast cancer holding a substantial share due to its high prevalence and ongoing research), end-users (hospitals and diagnostic centers dominating due to their established infrastructure and expertise), and product types (reagents and instruments being crucial components of the diagnostic workflow). While regulatory hurdles and high costs associated with advanced technologies pose some restraints, the overall market trajectory remains strongly positive.
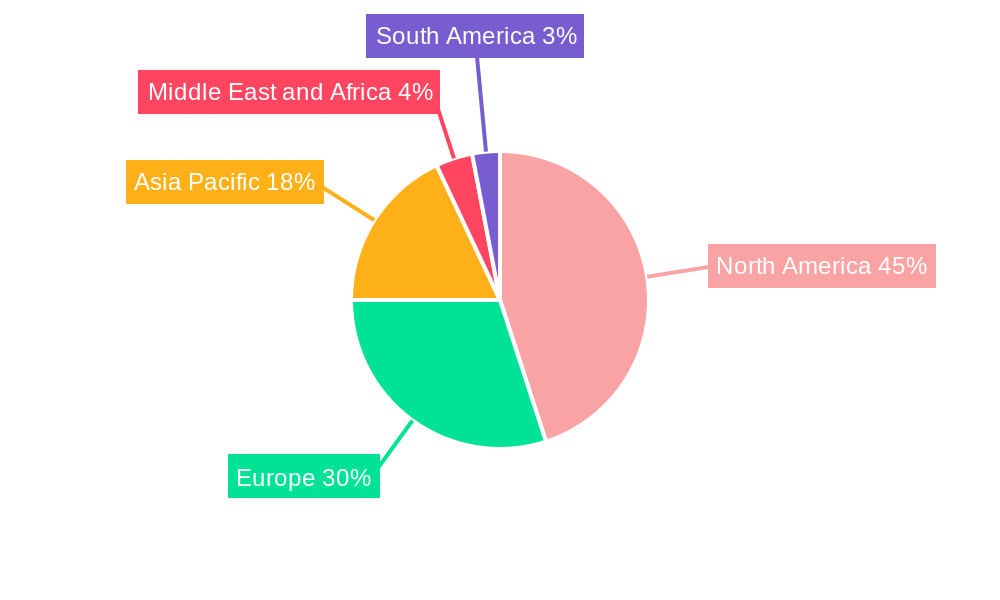
The competitive landscape is characterized by a mix of large multinational corporations and specialized biotechnology companies. Major players like Agilent Technologies, Danaher Corporation, QIAGEN, and Thermo Fisher Scientific are leveraging their extensive research and development capabilities and global reach to maintain market leadership. However, the market also presents opportunities for smaller, innovative companies specializing in niche technologies or applications to gain traction. Regional variations exist, with North America and Europe currently holding significant market shares due to established healthcare infrastructure and higher per capita healthcare spending. However, Asia Pacific is anticipated to witness rapid growth owing to rising cancer incidence, expanding healthcare infrastructure, and increasing adoption of advanced diagnostic techniques. The market's future growth will depend on factors such as technological innovations, regulatory approvals, reimbursement policies, and the continued expansion of cancer screening programs worldwide.
Oncology Molecular Diagnostics Industry: A Comprehensive Market Report (2019-2033)
This in-depth report provides a comprehensive analysis of the Oncology Molecular Diagnostics industry, offering invaluable insights for stakeholders seeking to navigate this rapidly evolving landscape. The study period covers 2019-2033, with 2025 serving as the base and estimated year. The report meticulously examines market size, segmentation, competitive dynamics, and future growth potential, incorporating detailed financial projections and qualitative assessments. The global market is expected to reach xx Million by 2033.
Oncology Molecular Diagnostics Industry Market Structure & Competitive Dynamics
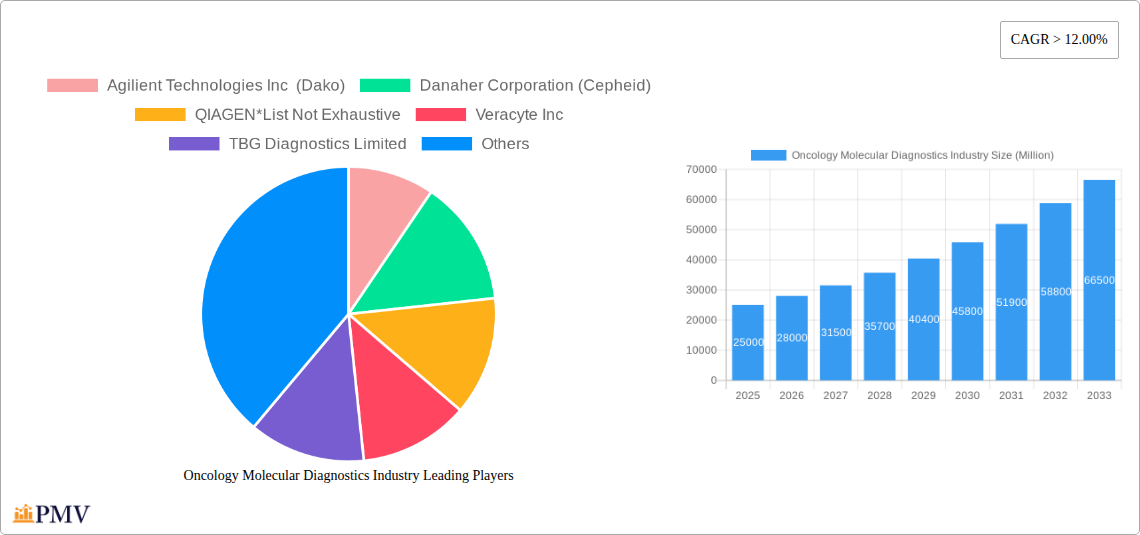
The Oncology Molecular Diagnostics market is characterized by a moderately concentrated structure, with key players like Agilent Technologies Inc (Dako), Danaher Corporation (Cepheid), QIAGEN, Veracyte Inc, and Thermo Fisher Scientific Inc holding significant market share. The industry is witnessing intense competition, driven by continuous technological advancements and the increasing demand for precise and personalized cancer diagnostics. Innovation ecosystems play a crucial role, fostering collaborations between research institutions, technology providers, and healthcare providers. Stringent regulatory frameworks, particularly concerning FDA approvals and reimbursement policies, significantly impact market entry and product lifecycle. Substitute products, such as traditional histopathology methods, pose a competitive challenge. End-user trends increasingly favor minimally invasive techniques and rapid turnaround times. Significant M&A activity, with deals valuing xx Million in recent years, has reshaped the competitive landscape, leading to consolidation and enhanced market access for larger players.
- Market Concentration: Moderately concentrated, with top 5 players holding approximately xx% market share in 2025.
- Innovation Ecosystems: Strong collaborations between research institutions and industry players.
- Regulatory Frameworks: Stringent regulatory approvals influence market entry and product development.
- M&A Activity: Significant consolidation through mergers and acquisitions, with total deal value exceeding xx Million during 2019-2024.
- End-User Trends: Increasing preference for rapid, minimally invasive diagnostic solutions.
Oncology Molecular Diagnostics Industry Industry Trends & Insights
The Oncology Molecular Diagnostics market exhibits robust growth, driven by several key factors. The rising incidence of cancer globally, coupled with the increasing adoption of targeted therapies and personalized medicine approaches, fuels the demand for accurate and timely diagnostic tools. Technological advancements, particularly in Next-Generation Sequencing (NGS) and other molecular diagnostic techniques, are revolutionizing cancer detection and treatment strategies. Consumer preferences are shifting towards non-invasive tests and faster results, which impacts the market’s product development trajectory. The market is also witnessing increased investment in research and development, furthering the development of innovative diagnostic solutions. The Compound Annual Growth Rate (CAGR) during the forecast period (2025-2033) is projected to be xx%, while market penetration is expected to reach xx% by 2033. Competitive dynamics are shaped by technological innovation, pricing strategies, and the development of comprehensive diagnostic panels.
Dominant Markets & Segments in Oncology Molecular Diagnostics Industry
The Oncology Molecular Diagnostics market demonstrates strong regional variations, with North America currently dominating the landscape due to high healthcare expenditure, advanced infrastructure, and early adoption of new technologies. However, the Asia-Pacific region is predicted to experience significant growth in the coming years driven by rising cancer incidence, increasing healthcare investments, and expanding access to advanced diagnostic technologies.
By Application Type: Breast cancer remains the largest segment due to its high prevalence, followed closely by lung and colorectal cancers.
- Key Drivers (Breast Cancer): High prevalence, increased screening, and targeted therapies.
- Key Drivers (Lung Cancer): High mortality rates, focus on early detection, and advanced treatment options.
By End User: Hospitals constitute the largest end-user segment due to their established infrastructure and comprehensive diagnostic capabilities.
- Key Drivers (Hospitals): Established infrastructure, high patient volume, and integration with treatment pathways.
By Product Type: Reagents dominate the market due to their continuous consumption in various diagnostic procedures.
- Key Drivers (Reagents): High consumable nature and critical role in diagnostic workflows.
By Technology Type: PCR remains widely used but NGS is gaining traction due to its high throughput and ability for comprehensive genomic analysis.
- Key Drivers (NGS): Potential for comprehensive genomic profiling and personalized medicine.
Oncology Molecular Diagnostics Industry Product Innovations
Recent years have witnessed significant advancements in oncology molecular diagnostics, including the development of liquid biopsy technologies, improved multiplex assays, and highly sensitive detection methods. These innovations offer increased accuracy, faster turnaround times, and reduced invasiveness, aligning perfectly with the growing demand for personalized medicine. Furthermore, the integration of artificial intelligence (AI) and machine learning (ML) is enhancing diagnostic capabilities and data analysis, leading to more effective treatment strategies. The market is seeing a continuous introduction of advanced platforms and assays tailored to specific cancer types and subtypes, further driving market growth.
Report Segmentation & Scope
This report segments the Oncology Molecular Diagnostics market across several key parameters:
By Application Type: Breast, Prostate, Colorectal, Lung, Blood, Liver, Cervical, and Other cancers. Each segment is analyzed based on market size, growth rate, and competitive dynamics. Projections for 2033 indicate that breast cancer will continue to lead, followed by lung and colorectal cancers.
By End User: Hospitals, Diagnostic Centers, and Other End Users. Hospitals currently command the largest market share due to their established infrastructure and higher patient volumes.
By Product Type: Instruments, Reagents, and Other Product Types. Reagents represent the largest market segment due to their continuous consumption in diagnostic tests.
By Technology Type: Polymerase Chain Reaction (PCR), Isothermal Nucleic Acid Amplification Technology (INAAT), DNA Sequencing and Next-Generation Sequencing (NGS), In-situ Hybridization (ISH), Mass Spectrometry, Transcription Mediated Amplification (TMA), Chips and Microarrays, and Other Technology Types. NGS is expected to witness the fastest growth over the forecast period.
Key Drivers of Oncology Molecular Diagnostics Industry Growth
Several factors contribute to the growth of the Oncology Molecular Diagnostics market: The rising global cancer burden, the increasing demand for personalized medicine, and technological advancements in molecular diagnostic techniques are key drivers. Government initiatives promoting early cancer detection and improved healthcare infrastructure further stimulate market expansion. Additionally, favorable reimbursement policies and increasing healthcare spending contribute significantly to the market's growth trajectory.
Challenges in the Oncology Molecular Diagnostics Industry Sector
The Oncology Molecular Diagnostics industry faces challenges, including high R&D costs, stringent regulatory requirements, and the complexities associated with reimbursement policies. The need for highly skilled personnel to operate sophisticated equipment and interpret results poses another barrier. Competition from established players and the emergence of new entrants also create pressure on pricing and market share. Supply chain disruptions can also impact the availability of essential reagents and instruments. These challenges contribute to high market entry barriers and influence overall industry profitability.
Leading Players in the Oncology Molecular Diagnostics Industry Market
- Agilent Technologies Inc (Dako)
- Danaher Corporation (Cepheid)
- QIAGEN
- Veracyte Inc
- TBG Diagnostics Limited
- HTG Molecular Diagnostics Inc
- Thermo Fisher Scientific Inc
- Abbott Laboratories
- F Hoffmann La-Roche Ltd
- bioMérieux SA
- Illumina Inc
- Sysmex Corporation (Sysmex Europe GmbH)
Key Developments in Oncology Molecular Diagnostics Industry Sector
- January 2023: Illumina launched a new NGS platform, significantly improving sequencing speed and cost-effectiveness.
- March 2022: QIAGEN acquired a smaller molecular diagnostics company, expanding its product portfolio.
- June 2021: Roche received FDA approval for a new companion diagnostic test for a targeted cancer therapy.
- October 2020: Thermo Fisher Scientific launched a new PCR-based assay for early cancer detection.
Strategic Oncology Molecular Diagnostics Industry Market Outlook
The future of the Oncology Molecular Diagnostics market is promising, with significant growth potential driven by technological advancements, personalized medicine's continued rise, and the increasing prevalence of cancer globally. Strategic opportunities exist in the development of innovative diagnostic tools, expansion into emerging markets, and strategic partnerships with healthcare providers. The market is poised for substantial growth, fueled by advancements in liquid biopsy, AI-driven diagnostics, and the increasing adoption of comprehensive genomic profiling. Companies that invest in research and development, cultivate strong regulatory relationships, and adapt to the evolving needs of the healthcare industry are best positioned to capitalize on the considerable growth opportunities within this dynamic sector.
Oncology Molecular Diagnostics Industry Segmentation
-
1. Product Type
- 1.1. Instrument
- 1.2. Reagents
- 1.3. Other Product Types
-
2. Technology Type
- 2.1. Polymerase Chain Reaction (PCR)
- 2.2. Isotherm
- 2.3. DNA Sequencing and Next-Generation Sequencing
- 2.4. In-situ Hybridization
- 2.5. Mass Spectrometry
- 2.6. Transcription Mediated Amplification (TMA)
- 2.7. Chips and Microarrays
- 2.8. Other Technology Types
-
3. Application Type
- 3.1. Breast Cancer
- 3.2. Prostate Cancer
- 3.3. Colorectal Cancer
- 3.4. Lung Cancer
- 3.5. Blood Cancer
- 3.6. Liver Cancer
- 3.7. Cervical Cancer
- 3.8. Other Application Types
-
4. End User
- 4.1. Hospitals
- 4.2. Diagnostic Centers
- 4.3. Other End Users
Oncology Molecular Diagnostics Industry Segmentation By Geography
-
1. North America
- 1.1. United States
- 1.2. Canada
- 1.3. Mexico
-
2. Europe
- 2.1. Germany
- 2.2. United Kingdom
- 2.3. France
- 2.4. Italy
- 2.5. Spain
- 2.6. Rest of Europe
-
3. Asia Pacific
- 3.1. China
- 3.2. Japan
- 3.3. India
- 3.4. Australia
- 3.5. South Korea
- 3.6. Rest of Asia Pacific
-
4. Middle East and Africa
- 4.1. GCC
- 4.2. South Africa
- 4.3. Rest of Middle East and Africa
-
5. South America
- 5.1. Brazil
- 5.2. Argentina
- 5.3. Rest of South America
Oncology Molecular Diagnostics Industry REPORT HIGHLIGHTS
| Aspects | Details |
|---|---|
| Study Period | 2019-2033 |
| Base Year | 2024 |
| Estimated Year | 2025 |
| Forecast Period | 2025-2033 |
| Historical Period | 2019-2024 |
| Growth Rate | CAGR of > 12.00% from 2019-2033 |
| Segmentation |
|
Table of Contents
- 1. Introduction
- 1.1. Research Scope
- 1.2. Market Segmentation
- 1.3. Research Methodology
- 1.4. Definitions and Assumptions
- 2. Executive Summary
- 2.1. Introduction
- 3. Market Dynamics
- 3.1. Introduction
- 3.2. Market Drivers
- 3.2.1. Rising Prevalence of Cancer Worldwide; Technological Advancements in Diagnostic Testing; Increasing Demand for Point-of-care Treatment
- 3.3. Market Restrains
- 3.3.1. High Cost of Molecular Diagnostic Tests; Lack of Skilled Workforce and Stringent Regulatory Framework
- 3.4. Market Trends
- 3.4.1. Polymerase Chain Reaction (PCR) is Anticipated to Observe a Significant Growth
- 4. Market Factor Analysis
- 4.1. Porters Five Forces
- 4.2. Supply/Value Chain
- 4.3. PESTEL analysis
- 4.4. Market Entropy
- 4.5. Patent/Trademark Analysis
- 5. Global Oncology Molecular Diagnostics Industry Analysis, Insights and Forecast, 2019-2031
- 5.1. Market Analysis, Insights and Forecast - by Product Type
- 5.1.1. Instrument
- 5.1.2. Reagents
- 5.1.3. Other Product Types
- 5.2. Market Analysis, Insights and Forecast - by Technology Type
- 5.2.1. Polymerase Chain Reaction (PCR)
- 5.2.2. Isotherm
- 5.2.3. DNA Sequencing and Next-Generation Sequencing
- 5.2.4. In-situ Hybridization
- 5.2.5. Mass Spectrometry
- 5.2.6. Transcription Mediated Amplification (TMA)
- 5.2.7. Chips and Microarrays
- 5.2.8. Other Technology Types
- 5.3. Market Analysis, Insights and Forecast - by Application Type
- 5.3.1. Breast Cancer
- 5.3.2. Prostate Cancer
- 5.3.3. Colorectal Cancer
- 5.3.4. Lung Cancer
- 5.3.5. Blood Cancer
- 5.3.6. Liver Cancer
- 5.3.7. Cervical Cancer
- 5.3.8. Other Application Types
- 5.4. Market Analysis, Insights and Forecast - by End User
- 5.4.1. Hospitals
- 5.4.2. Diagnostic Centers
- 5.4.3. Other End Users
- 5.5. Market Analysis, Insights and Forecast - by Region
- 5.5.1. North America
- 5.5.2. Europe
- 5.5.3. Asia Pacific
- 5.5.4. Middle East and Africa
- 5.5.5. South America
- 5.1. Market Analysis, Insights and Forecast - by Product Type
- 6. North America Oncology Molecular Diagnostics Industry Analysis, Insights and Forecast, 2019-2031
- 6.1. Market Analysis, Insights and Forecast - by Product Type
- 6.1.1. Instrument
- 6.1.2. Reagents
- 6.1.3. Other Product Types
- 6.2. Market Analysis, Insights and Forecast - by Technology Type
- 6.2.1. Polymerase Chain Reaction (PCR)
- 6.2.2. Isotherm
- 6.2.3. DNA Sequencing and Next-Generation Sequencing
- 6.2.4. In-situ Hybridization
- 6.2.5. Mass Spectrometry
- 6.2.6. Transcription Mediated Amplification (TMA)
- 6.2.7. Chips and Microarrays
- 6.2.8. Other Technology Types
- 6.3. Market Analysis, Insights and Forecast - by Application Type
- 6.3.1. Breast Cancer
- 6.3.2. Prostate Cancer
- 6.3.3. Colorectal Cancer
- 6.3.4. Lung Cancer
- 6.3.5. Blood Cancer
- 6.3.6. Liver Cancer
- 6.3.7. Cervical Cancer
- 6.3.8. Other Application Types
- 6.4. Market Analysis, Insights and Forecast - by End User
- 6.4.1. Hospitals
- 6.4.2. Diagnostic Centers
- 6.4.3. Other End Users
- 6.1. Market Analysis, Insights and Forecast - by Product Type
- 7. Europe Oncology Molecular Diagnostics Industry Analysis, Insights and Forecast, 2019-2031
- 7.1. Market Analysis, Insights and Forecast - by Product Type
- 7.1.1. Instrument
- 7.1.2. Reagents
- 7.1.3. Other Product Types
- 7.2. Market Analysis, Insights and Forecast - by Technology Type
- 7.2.1. Polymerase Chain Reaction (PCR)
- 7.2.2. Isotherm
- 7.2.3. DNA Sequencing and Next-Generation Sequencing
- 7.2.4. In-situ Hybridization
- 7.2.5. Mass Spectrometry
- 7.2.6. Transcription Mediated Amplification (TMA)
- 7.2.7. Chips and Microarrays
- 7.2.8. Other Technology Types
- 7.3. Market Analysis, Insights and Forecast - by Application Type
- 7.3.1. Breast Cancer
- 7.3.2. Prostate Cancer
- 7.3.3. Colorectal Cancer
- 7.3.4. Lung Cancer
- 7.3.5. Blood Cancer
- 7.3.6. Liver Cancer
- 7.3.7. Cervical Cancer
- 7.3.8. Other Application Types
- 7.4. Market Analysis, Insights and Forecast - by End User
- 7.4.1. Hospitals
- 7.4.2. Diagnostic Centers
- 7.4.3. Other End Users
- 7.1. Market Analysis, Insights and Forecast - by Product Type
- 8. Asia Pacific Oncology Molecular Diagnostics Industry Analysis, Insights and Forecast, 2019-2031
- 8.1. Market Analysis, Insights and Forecast - by Product Type
- 8.1.1. Instrument
- 8.1.2. Reagents
- 8.1.3. Other Product Types
- 8.2. Market Analysis, Insights and Forecast - by Technology Type
- 8.2.1. Polymerase Chain Reaction (PCR)
- 8.2.2. Isotherm
- 8.2.3. DNA Sequencing and Next-Generation Sequencing
- 8.2.4. In-situ Hybridization
- 8.2.5. Mass Spectrometry
- 8.2.6. Transcription Mediated Amplification (TMA)
- 8.2.7. Chips and Microarrays
- 8.2.8. Other Technology Types
- 8.3. Market Analysis, Insights and Forecast - by Application Type
- 8.3.1. Breast Cancer
- 8.3.2. Prostate Cancer
- 8.3.3. Colorectal Cancer
- 8.3.4. Lung Cancer
- 8.3.5. Blood Cancer
- 8.3.6. Liver Cancer
- 8.3.7. Cervical Cancer
- 8.3.8. Other Application Types
- 8.4. Market Analysis, Insights and Forecast - by End User
- 8.4.1. Hospitals
- 8.4.2. Diagnostic Centers
- 8.4.3. Other End Users
- 8.1. Market Analysis, Insights and Forecast - by Product Type
- 9. Middle East and Africa Oncology Molecular Diagnostics Industry Analysis, Insights and Forecast, 2019-2031
- 9.1. Market Analysis, Insights and Forecast - by Product Type
- 9.1.1. Instrument
- 9.1.2. Reagents
- 9.1.3. Other Product Types
- 9.2. Market Analysis, Insights and Forecast - by Technology Type
- 9.2.1. Polymerase Chain Reaction (PCR)
- 9.2.2. Isotherm
- 9.2.3. DNA Sequencing and Next-Generation Sequencing
- 9.2.4. In-situ Hybridization
- 9.2.5. Mass Spectrometry
- 9.2.6. Transcription Mediated Amplification (TMA)
- 9.2.7. Chips and Microarrays
- 9.2.8. Other Technology Types
- 9.3. Market Analysis, Insights and Forecast - by Application Type
- 9.3.1. Breast Cancer
- 9.3.2. Prostate Cancer
- 9.3.3. Colorectal Cancer
- 9.3.4. Lung Cancer
- 9.3.5. Blood Cancer
- 9.3.6. Liver Cancer
- 9.3.7. Cervical Cancer
- 9.3.8. Other Application Types
- 9.4. Market Analysis, Insights and Forecast - by End User
- 9.4.1. Hospitals
- 9.4.2. Diagnostic Centers
- 9.4.3. Other End Users
- 9.1. Market Analysis, Insights and Forecast - by Product Type
- 10. South America Oncology Molecular Diagnostics Industry Analysis, Insights and Forecast, 2019-2031
- 10.1. Market Analysis, Insights and Forecast - by Product Type
- 10.1.1. Instrument
- 10.1.2. Reagents
- 10.1.3. Other Product Types
- 10.2. Market Analysis, Insights and Forecast - by Technology Type
- 10.2.1. Polymerase Chain Reaction (PCR)
- 10.2.2. Isotherm
- 10.2.3. DNA Sequencing and Next-Generation Sequencing
- 10.2.4. In-situ Hybridization
- 10.2.5. Mass Spectrometry
- 10.2.6. Transcription Mediated Amplification (TMA)
- 10.2.7. Chips and Microarrays
- 10.2.8. Other Technology Types
- 10.3. Market Analysis, Insights and Forecast - by Application Type
- 10.3.1. Breast Cancer
- 10.3.2. Prostate Cancer
- 10.3.3. Colorectal Cancer
- 10.3.4. Lung Cancer
- 10.3.5. Blood Cancer
- 10.3.6. Liver Cancer
- 10.3.7. Cervical Cancer
- 10.3.8. Other Application Types
- 10.4. Market Analysis, Insights and Forecast - by End User
- 10.4.1. Hospitals
- 10.4.2. Diagnostic Centers
- 10.4.3. Other End Users
- 10.1. Market Analysis, Insights and Forecast - by Product Type
- 11. North America Oncology Molecular Diagnostics Industry Analysis, Insights and Forecast, 2019-2031
- 11.1. Market Analysis, Insights and Forecast - By Country/Sub-region
- 11.1.1 United States
- 11.1.2 Canada
- 11.1.3 Mexico
- 12. Europe Oncology Molecular Diagnostics Industry Analysis, Insights and Forecast, 2019-2031
- 12.1. Market Analysis, Insights and Forecast - By Country/Sub-region
- 12.1.1 Germany
- 12.1.2 United Kingdom
- 12.1.3 France
- 12.1.4 Italy
- 12.1.5 Spain
- 12.1.6 Rest of Europe
- 13. Asia Pacific Oncology Molecular Diagnostics Industry Analysis, Insights and Forecast, 2019-2031
- 13.1. Market Analysis, Insights and Forecast - By Country/Sub-region
- 13.1.1 China
- 13.1.2 Japan
- 13.1.3 India
- 13.1.4 Australia
- 13.1.5 South Korea
- 13.1.6 Rest of Asia Pacific
- 14. Middle East and Africa Oncology Molecular Diagnostics Industry Analysis, Insights and Forecast, 2019-2031
- 14.1. Market Analysis, Insights and Forecast - By Country/Sub-region
- 14.1.1 GCC
- 14.1.2 South Africa
- 14.1.3 Rest of Middle East and Africa
- 15. South America Oncology Molecular Diagnostics Industry Analysis, Insights and Forecast, 2019-2031
- 15.1. Market Analysis, Insights and Forecast - By Country/Sub-region
- 15.1.1 Brazil
- 15.1.2 Argentina
- 15.1.3 Rest of South America
- 16. Competitive Analysis
- 16.1. Global Market Share Analysis 2024
- 16.2. Company Profiles
- 16.2.1 Agilient Technologies Inc (Dako)
- 16.2.1.1. Overview
- 16.2.1.2. Products
- 16.2.1.3. SWOT Analysis
- 16.2.1.4. Recent Developments
- 16.2.1.5. Financials (Based on Availability)
- 16.2.2 Danaher Corporation (Cepheid)
- 16.2.2.1. Overview
- 16.2.2.2. Products
- 16.2.2.3. SWOT Analysis
- 16.2.2.4. Recent Developments
- 16.2.2.5. Financials (Based on Availability)
- 16.2.3 QIAGEN*List Not Exhaustive
- 16.2.3.1. Overview
- 16.2.3.2. Products
- 16.2.3.3. SWOT Analysis
- 16.2.3.4. Recent Developments
- 16.2.3.5. Financials (Based on Availability)
- 16.2.4 Veracyte Inc
- 16.2.4.1. Overview
- 16.2.4.2. Products
- 16.2.4.3. SWOT Analysis
- 16.2.4.4. Recent Developments
- 16.2.4.5. Financials (Based on Availability)
- 16.2.5 TBG Diagnostics Limited
- 16.2.5.1. Overview
- 16.2.5.2. Products
- 16.2.5.3. SWOT Analysis
- 16.2.5.4. Recent Developments
- 16.2.5.5. Financials (Based on Availability)
- 16.2.6 HTG Molecular Diagnostics Inc
- 16.2.6.1. Overview
- 16.2.6.2. Products
- 16.2.6.3. SWOT Analysis
- 16.2.6.4. Recent Developments
- 16.2.6.5. Financials (Based on Availability)
- 16.2.7 Thermo Fisher Scientific Inc
- 16.2.7.1. Overview
- 16.2.7.2. Products
- 16.2.7.3. SWOT Analysis
- 16.2.7.4. Recent Developments
- 16.2.7.5. Financials (Based on Availability)
- 16.2.8 Abbott Laboratories
- 16.2.8.1. Overview
- 16.2.8.2. Products
- 16.2.8.3. SWOT Analysis
- 16.2.8.4. Recent Developments
- 16.2.8.5. Financials (Based on Availability)
- 16.2.9 F Hoffmann La-Roche Ltd
- 16.2.9.1. Overview
- 16.2.9.2. Products
- 16.2.9.3. SWOT Analysis
- 16.2.9.4. Recent Developments
- 16.2.9.5. Financials (Based on Availability)
- 16.2.10 bioMérieux SA
- 16.2.10.1. Overview
- 16.2.10.2. Products
- 16.2.10.3. SWOT Analysis
- 16.2.10.4. Recent Developments
- 16.2.10.5. Financials (Based on Availability)
- 16.2.11 Illumina Inc
- 16.2.11.1. Overview
- 16.2.11.2. Products
- 16.2.11.3. SWOT Analysis
- 16.2.11.4. Recent Developments
- 16.2.11.5. Financials (Based on Availability)
- 16.2.12 Sysmex Corporation (Sysmex Europe GmbH)
- 16.2.12.1. Overview
- 16.2.12.2. Products
- 16.2.12.3. SWOT Analysis
- 16.2.12.4. Recent Developments
- 16.2.12.5. Financials (Based on Availability)
- 16.2.1 Agilient Technologies Inc (Dako)
List of Figures
- Figure 1: Global Oncology Molecular Diagnostics Industry Revenue Breakdown (Million, %) by Region 2024 & 2032
- Figure 2: North America Oncology Molecular Diagnostics Industry Revenue (Million), by Country 2024 & 2032
- Figure 3: North America Oncology Molecular Diagnostics Industry Revenue Share (%), by Country 2024 & 2032
- Figure 4: Europe Oncology Molecular Diagnostics Industry Revenue (Million), by Country 2024 & 2032
- Figure 5: Europe Oncology Molecular Diagnostics Industry Revenue Share (%), by Country 2024 & 2032
- Figure 6: Asia Pacific Oncology Molecular Diagnostics Industry Revenue (Million), by Country 2024 & 2032
- Figure 7: Asia Pacific Oncology Molecular Diagnostics Industry Revenue Share (%), by Country 2024 & 2032
- Figure 8: Middle East and Africa Oncology Molecular Diagnostics Industry Revenue (Million), by Country 2024 & 2032
- Figure 9: Middle East and Africa Oncology Molecular Diagnostics Industry Revenue Share (%), by Country 2024 & 2032
- Figure 10: South America Oncology Molecular Diagnostics Industry Revenue (Million), by Country 2024 & 2032
- Figure 11: South America Oncology Molecular Diagnostics Industry Revenue Share (%), by Country 2024 & 2032
- Figure 12: North America Oncology Molecular Diagnostics Industry Revenue (Million), by Product Type 2024 & 2032
- Figure 13: North America Oncology Molecular Diagnostics Industry Revenue Share (%), by Product Type 2024 & 2032
- Figure 14: North America Oncology Molecular Diagnostics Industry Revenue (Million), by Technology Type 2024 & 2032
- Figure 15: North America Oncology Molecular Diagnostics Industry Revenue Share (%), by Technology Type 2024 & 2032
- Figure 16: North America Oncology Molecular Diagnostics Industry Revenue (Million), by Application Type 2024 & 2032
- Figure 17: North America Oncology Molecular Diagnostics Industry Revenue Share (%), by Application Type 2024 & 2032
- Figure 18: North America Oncology Molecular Diagnostics Industry Revenue (Million), by End User 2024 & 2032
- Figure 19: North America Oncology Molecular Diagnostics Industry Revenue Share (%), by End User 2024 & 2032
- Figure 20: North America Oncology Molecular Diagnostics Industry Revenue (Million), by Country 2024 & 2032
- Figure 21: North America Oncology Molecular Diagnostics Industry Revenue Share (%), by Country 2024 & 2032
- Figure 22: Europe Oncology Molecular Diagnostics Industry Revenue (Million), by Product Type 2024 & 2032
- Figure 23: Europe Oncology Molecular Diagnostics Industry Revenue Share (%), by Product Type 2024 & 2032
- Figure 24: Europe Oncology Molecular Diagnostics Industry Revenue (Million), by Technology Type 2024 & 2032
- Figure 25: Europe Oncology Molecular Diagnostics Industry Revenue Share (%), by Technology Type 2024 & 2032
- Figure 26: Europe Oncology Molecular Diagnostics Industry Revenue (Million), by Application Type 2024 & 2032
- Figure 27: Europe Oncology Molecular Diagnostics Industry Revenue Share (%), by Application Type 2024 & 2032
- Figure 28: Europe Oncology Molecular Diagnostics Industry Revenue (Million), by End User 2024 & 2032
- Figure 29: Europe Oncology Molecular Diagnostics Industry Revenue Share (%), by End User 2024 & 2032
- Figure 30: Europe Oncology Molecular Diagnostics Industry Revenue (Million), by Country 2024 & 2032
- Figure 31: Europe Oncology Molecular Diagnostics Industry Revenue Share (%), by Country 2024 & 2032
- Figure 32: Asia Pacific Oncology Molecular Diagnostics Industry Revenue (Million), by Product Type 2024 & 2032
- Figure 33: Asia Pacific Oncology Molecular Diagnostics Industry Revenue Share (%), by Product Type 2024 & 2032
- Figure 34: Asia Pacific Oncology Molecular Diagnostics Industry Revenue (Million), by Technology Type 2024 & 2032
- Figure 35: Asia Pacific Oncology Molecular Diagnostics Industry Revenue Share (%), by Technology Type 2024 & 2032
- Figure 36: Asia Pacific Oncology Molecular Diagnostics Industry Revenue (Million), by Application Type 2024 & 2032
- Figure 37: Asia Pacific Oncology Molecular Diagnostics Industry Revenue Share (%), by Application Type 2024 & 2032
- Figure 38: Asia Pacific Oncology Molecular Diagnostics Industry Revenue (Million), by End User 2024 & 2032
- Figure 39: Asia Pacific Oncology Molecular Diagnostics Industry Revenue Share (%), by End User 2024 & 2032
- Figure 40: Asia Pacific Oncology Molecular Diagnostics Industry Revenue (Million), by Country 2024 & 2032
- Figure 41: Asia Pacific Oncology Molecular Diagnostics Industry Revenue Share (%), by Country 2024 & 2032
- Figure 42: Middle East and Africa Oncology Molecular Diagnostics Industry Revenue (Million), by Product Type 2024 & 2032
- Figure 43: Middle East and Africa Oncology Molecular Diagnostics Industry Revenue Share (%), by Product Type 2024 & 2032
- Figure 44: Middle East and Africa Oncology Molecular Diagnostics Industry Revenue (Million), by Technology Type 2024 & 2032
- Figure 45: Middle East and Africa Oncology Molecular Diagnostics Industry Revenue Share (%), by Technology Type 2024 & 2032
- Figure 46: Middle East and Africa Oncology Molecular Diagnostics Industry Revenue (Million), by Application Type 2024 & 2032
- Figure 47: Middle East and Africa Oncology Molecular Diagnostics Industry Revenue Share (%), by Application Type 2024 & 2032
- Figure 48: Middle East and Africa Oncology Molecular Diagnostics Industry Revenue (Million), by End User 2024 & 2032
- Figure 49: Middle East and Africa Oncology Molecular Diagnostics Industry Revenue Share (%), by End User 2024 & 2032
- Figure 50: Middle East and Africa Oncology Molecular Diagnostics Industry Revenue (Million), by Country 2024 & 2032
- Figure 51: Middle East and Africa Oncology Molecular Diagnostics Industry Revenue Share (%), by Country 2024 & 2032
- Figure 52: South America Oncology Molecular Diagnostics Industry Revenue (Million), by Product Type 2024 & 2032
- Figure 53: South America Oncology Molecular Diagnostics Industry Revenue Share (%), by Product Type 2024 & 2032
- Figure 54: South America Oncology Molecular Diagnostics Industry Revenue (Million), by Technology Type 2024 & 2032
- Figure 55: South America Oncology Molecular Diagnostics Industry Revenue Share (%), by Technology Type 2024 & 2032
- Figure 56: South America Oncology Molecular Diagnostics Industry Revenue (Million), by Application Type 2024 & 2032
- Figure 57: South America Oncology Molecular Diagnostics Industry Revenue Share (%), by Application Type 2024 & 2032
- Figure 58: South America Oncology Molecular Diagnostics Industry Revenue (Million), by End User 2024 & 2032
- Figure 59: South America Oncology Molecular Diagnostics Industry Revenue Share (%), by End User 2024 & 2032
- Figure 60: South America Oncology Molecular Diagnostics Industry Revenue (Million), by Country 2024 & 2032
- Figure 61: South America Oncology Molecular Diagnostics Industry Revenue Share (%), by Country 2024 & 2032
List of Tables
- Table 1: Global Oncology Molecular Diagnostics Industry Revenue Million Forecast, by Region 2019 & 2032
- Table 2: Global Oncology Molecular Diagnostics Industry Revenue Million Forecast, by Product Type 2019 & 2032
- Table 3: Global Oncology Molecular Diagnostics Industry Revenue Million Forecast, by Technology Type 2019 & 2032
- Table 4: Global Oncology Molecular Diagnostics Industry Revenue Million Forecast, by Application Type 2019 & 2032
- Table 5: Global Oncology Molecular Diagnostics Industry Revenue Million Forecast, by End User 2019 & 2032
- Table 6: Global Oncology Molecular Diagnostics Industry Revenue Million Forecast, by Region 2019 & 2032
- Table 7: Global Oncology Molecular Diagnostics Industry Revenue Million Forecast, by Country 2019 & 2032
- Table 8: United States Oncology Molecular Diagnostics Industry Revenue (Million) Forecast, by Application 2019 & 2032
- Table 9: Canada Oncology Molecular Diagnostics Industry Revenue (Million) Forecast, by Application 2019 & 2032
- Table 10: Mexico Oncology Molecular Diagnostics Industry Revenue (Million) Forecast, by Application 2019 & 2032
- Table 11: Global Oncology Molecular Diagnostics Industry Revenue Million Forecast, by Country 2019 & 2032
- Table 12: Germany Oncology Molecular Diagnostics Industry Revenue (Million) Forecast, by Application 2019 & 2032
- Table 13: United Kingdom Oncology Molecular Diagnostics Industry Revenue (Million) Forecast, by Application 2019 & 2032
- Table 14: France Oncology Molecular Diagnostics Industry Revenue (Million) Forecast, by Application 2019 & 2032
- Table 15: Italy Oncology Molecular Diagnostics Industry Revenue (Million) Forecast, by Application 2019 & 2032
- Table 16: Spain Oncology Molecular Diagnostics Industry Revenue (Million) Forecast, by Application 2019 & 2032
- Table 17: Rest of Europe Oncology Molecular Diagnostics Industry Revenue (Million) Forecast, by Application 2019 & 2032
- Table 18: Global Oncology Molecular Diagnostics Industry Revenue Million Forecast, by Country 2019 & 2032
- Table 19: China Oncology Molecular Diagnostics Industry Revenue (Million) Forecast, by Application 2019 & 2032
- Table 20: Japan Oncology Molecular Diagnostics Industry Revenue (Million) Forecast, by Application 2019 & 2032
- Table 21: India Oncology Molecular Diagnostics Industry Revenue (Million) Forecast, by Application 2019 & 2032
- Table 22: Australia Oncology Molecular Diagnostics Industry Revenue (Million) Forecast, by Application 2019 & 2032
- Table 23: South Korea Oncology Molecular Diagnostics Industry Revenue (Million) Forecast, by Application 2019 & 2032
- Table 24: Rest of Asia Pacific Oncology Molecular Diagnostics Industry Revenue (Million) Forecast, by Application 2019 & 2032
- Table 25: Global Oncology Molecular Diagnostics Industry Revenue Million Forecast, by Country 2019 & 2032
- Table 26: GCC Oncology Molecular Diagnostics Industry Revenue (Million) Forecast, by Application 2019 & 2032
- Table 27: South Africa Oncology Molecular Diagnostics Industry Revenue (Million) Forecast, by Application 2019 & 2032
- Table 28: Rest of Middle East and Africa Oncology Molecular Diagnostics Industry Revenue (Million) Forecast, by Application 2019 & 2032
- Table 29: Global Oncology Molecular Diagnostics Industry Revenue Million Forecast, by Country 2019 & 2032
- Table 30: Brazil Oncology Molecular Diagnostics Industry Revenue (Million) Forecast, by Application 2019 & 2032
- Table 31: Argentina Oncology Molecular Diagnostics Industry Revenue (Million) Forecast, by Application 2019 & 2032
- Table 32: Rest of South America Oncology Molecular Diagnostics Industry Revenue (Million) Forecast, by Application 2019 & 2032
- Table 33: Global Oncology Molecular Diagnostics Industry Revenue Million Forecast, by Product Type 2019 & 2032
- Table 34: Global Oncology Molecular Diagnostics Industry Revenue Million Forecast, by Technology Type 2019 & 2032
- Table 35: Global Oncology Molecular Diagnostics Industry Revenue Million Forecast, by Application Type 2019 & 2032
- Table 36: Global Oncology Molecular Diagnostics Industry Revenue Million Forecast, by End User 2019 & 2032
- Table 37: Global Oncology Molecular Diagnostics Industry Revenue Million Forecast, by Country 2019 & 2032
- Table 38: United States Oncology Molecular Diagnostics Industry Revenue (Million) Forecast, by Application 2019 & 2032
- Table 39: Canada Oncology Molecular Diagnostics Industry Revenue (Million) Forecast, by Application 2019 & 2032
- Table 40: Mexico Oncology Molecular Diagnostics Industry Revenue (Million) Forecast, by Application 2019 & 2032
- Table 41: Global Oncology Molecular Diagnostics Industry Revenue Million Forecast, by Product Type 2019 & 2032
- Table 42: Global Oncology Molecular Diagnostics Industry Revenue Million Forecast, by Technology Type 2019 & 2032
- Table 43: Global Oncology Molecular Diagnostics Industry Revenue Million Forecast, by Application Type 2019 & 2032
- Table 44: Global Oncology Molecular Diagnostics Industry Revenue Million Forecast, by End User 2019 & 2032
- Table 45: Global Oncology Molecular Diagnostics Industry Revenue Million Forecast, by Country 2019 & 2032
- Table 46: Germany Oncology Molecular Diagnostics Industry Revenue (Million) Forecast, by Application 2019 & 2032
- Table 47: United Kingdom Oncology Molecular Diagnostics Industry Revenue (Million) Forecast, by Application 2019 & 2032
- Table 48: France Oncology Molecular Diagnostics Industry Revenue (Million) Forecast, by Application 2019 & 2032
- Table 49: Italy Oncology Molecular Diagnostics Industry Revenue (Million) Forecast, by Application 2019 & 2032
- Table 50: Spain Oncology Molecular Diagnostics Industry Revenue (Million) Forecast, by Application 2019 & 2032
- Table 51: Rest of Europe Oncology Molecular Diagnostics Industry Revenue (Million) Forecast, by Application 2019 & 2032
- Table 52: Global Oncology Molecular Diagnostics Industry Revenue Million Forecast, by Product Type 2019 & 2032
- Table 53: Global Oncology Molecular Diagnostics Industry Revenue Million Forecast, by Technology Type 2019 & 2032
- Table 54: Global Oncology Molecular Diagnostics Industry Revenue Million Forecast, by Application Type 2019 & 2032
- Table 55: Global Oncology Molecular Diagnostics Industry Revenue Million Forecast, by End User 2019 & 2032
- Table 56: Global Oncology Molecular Diagnostics Industry Revenue Million Forecast, by Country 2019 & 2032
- Table 57: China Oncology Molecular Diagnostics Industry Revenue (Million) Forecast, by Application 2019 & 2032
- Table 58: Japan Oncology Molecular Diagnostics Industry Revenue (Million) Forecast, by Application 2019 & 2032
- Table 59: India Oncology Molecular Diagnostics Industry Revenue (Million) Forecast, by Application 2019 & 2032
- Table 60: Australia Oncology Molecular Diagnostics Industry Revenue (Million) Forecast, by Application 2019 & 2032
- Table 61: South Korea Oncology Molecular Diagnostics Industry Revenue (Million) Forecast, by Application 2019 & 2032
- Table 62: Rest of Asia Pacific Oncology Molecular Diagnostics Industry Revenue (Million) Forecast, by Application 2019 & 2032
- Table 63: Global Oncology Molecular Diagnostics Industry Revenue Million Forecast, by Product Type 2019 & 2032
- Table 64: Global Oncology Molecular Diagnostics Industry Revenue Million Forecast, by Technology Type 2019 & 2032
- Table 65: Global Oncology Molecular Diagnostics Industry Revenue Million Forecast, by Application Type 2019 & 2032
- Table 66: Global Oncology Molecular Diagnostics Industry Revenue Million Forecast, by End User 2019 & 2032
- Table 67: Global Oncology Molecular Diagnostics Industry Revenue Million Forecast, by Country 2019 & 2032
- Table 68: GCC Oncology Molecular Diagnostics Industry Revenue (Million) Forecast, by Application 2019 & 2032
- Table 69: South Africa Oncology Molecular Diagnostics Industry Revenue (Million) Forecast, by Application 2019 & 2032
- Table 70: Rest of Middle East and Africa Oncology Molecular Diagnostics Industry Revenue (Million) Forecast, by Application 2019 & 2032
- Table 71: Global Oncology Molecular Diagnostics Industry Revenue Million Forecast, by Product Type 2019 & 2032
- Table 72: Global Oncology Molecular Diagnostics Industry Revenue Million Forecast, by Technology Type 2019 & 2032
- Table 73: Global Oncology Molecular Diagnostics Industry Revenue Million Forecast, by Application Type 2019 & 2032
- Table 74: Global Oncology Molecular Diagnostics Industry Revenue Million Forecast, by End User 2019 & 2032
- Table 75: Global Oncology Molecular Diagnostics Industry Revenue Million Forecast, by Country 2019 & 2032
- Table 76: Brazil Oncology Molecular Diagnostics Industry Revenue (Million) Forecast, by Application 2019 & 2032
- Table 77: Argentina Oncology Molecular Diagnostics Industry Revenue (Million) Forecast, by Application 2019 & 2032
- Table 78: Rest of South America Oncology Molecular Diagnostics Industry Revenue (Million) Forecast, by Application 2019 & 2032
Frequently Asked Questions
1. What is the projected Compound Annual Growth Rate (CAGR) of the Oncology Molecular Diagnostics Industry?
The projected CAGR is approximately > 12.00%.
2. Which companies are prominent players in the Oncology Molecular Diagnostics Industry?
Key companies in the market include Agilient Technologies Inc (Dako), Danaher Corporation (Cepheid), QIAGEN*List Not Exhaustive, Veracyte Inc, TBG Diagnostics Limited, HTG Molecular Diagnostics Inc, Thermo Fisher Scientific Inc, Abbott Laboratories, F Hoffmann La-Roche Ltd, bioMérieux SA, Illumina Inc, Sysmex Corporation (Sysmex Europe GmbH).
3. What are the main segments of the Oncology Molecular Diagnostics Industry?
The market segments include Product Type, Technology Type, Application Type, End User.
4. Can you provide details about the market size?
The market size is estimated to be USD XX Million as of 2022.
5. What are some drivers contributing to market growth?
Rising Prevalence of Cancer Worldwide; Technological Advancements in Diagnostic Testing; Increasing Demand for Point-of-care Treatment.
6. What are the notable trends driving market growth?
Polymerase Chain Reaction (PCR) is Anticipated to Observe a Significant Growth.
7. Are there any restraints impacting market growth?
High Cost of Molecular Diagnostic Tests; Lack of Skilled Workforce and Stringent Regulatory Framework.
8. Can you provide examples of recent developments in the market?
N/A
9. What pricing options are available for accessing the report?
Pricing options include single-user, multi-user, and enterprise licenses priced at USD 4750, USD 5250, and USD 8750 respectively.
10. Is the market size provided in terms of value or volume?
The market size is provided in terms of value, measured in Million.
11. Are there any specific market keywords associated with the report?
Yes, the market keyword associated with the report is "Oncology Molecular Diagnostics Industry," which aids in identifying and referencing the specific market segment covered.
12. How do I determine which pricing option suits my needs best?
The pricing options vary based on user requirements and access needs. Individual users may opt for single-user licenses, while businesses requiring broader access may choose multi-user or enterprise licenses for cost-effective access to the report.
13. Are there any additional resources or data provided in the Oncology Molecular Diagnostics Industry report?
While the report offers comprehensive insights, it's advisable to review the specific contents or supplementary materials provided to ascertain if additional resources or data are available.
14. How can I stay updated on further developments or reports in the Oncology Molecular Diagnostics Industry?
To stay informed about further developments, trends, and reports in the Oncology Molecular Diagnostics Industry, consider subscribing to industry newsletters, following relevant companies and organizations, or regularly checking reputable industry news sources and publications.
Methodology
Step 1 - Identification of Relevant Samples Size from Population Database


Step 2 - Approaches for Defining Global Market Size (Value, Volume* & Price*)

Note*: In applicable scenarios
Step 3 - Data Sources
Primary Research
- Web Analytics
- Survey Reports
- Research Institute
- Latest Research Reports
- Opinion Leaders
Secondary Research
- Annual Reports
- White Paper
- Latest Press Release
- Industry Association
- Paid Database
- Investor Presentations

Step 4 - Data Triangulation
Involves using different sources of information in order to increase the validity of a study
These sources are likely to be stakeholders in a program - participants, other researchers, program staff, other community members, and so on.
Then we put all data in single framework & apply various statistical tools to find out the dynamic on the market.
During the analysis stage, feedback from the stakeholder groups would be compared to determine areas of agreement as well as areas of divergence


