
Key Insights
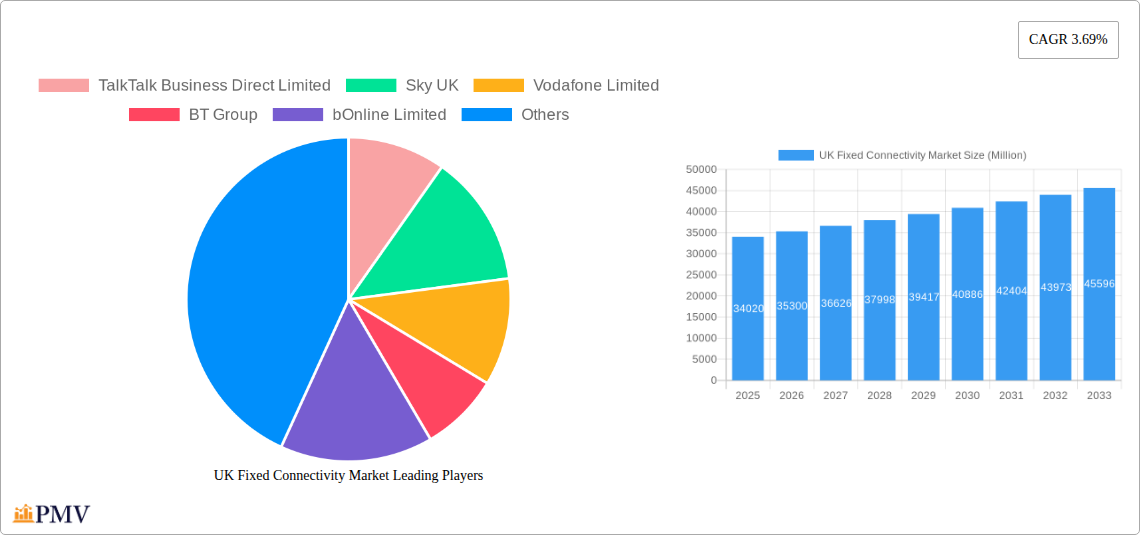
The UK fixed connectivity market, valued at £34.02 billion in 2025, is projected to experience steady growth, driven by increasing demand for high-speed internet access across residential and business sectors. The 3.69% Compound Annual Growth Rate (CAGR) from 2025 to 2033 suggests a consistent expansion, fueled by several key factors. The rise of remote work and online education has significantly boosted the need for reliable broadband connections, while the ongoing rollout of fiber optic networks is expanding coverage and improving speeds. Increased competition among major players like BT Group, Vodafone, Sky, and Virgin Media, coupled with the emergence of smaller, more agile providers, is further stimulating market growth. However, challenges remain, including the digital divide in underserved rural areas and the need for continuous investment in network infrastructure to meet escalating bandwidth demands. Government initiatives aimed at bridging the digital gap and fostering innovation within the sector are expected to contribute to future market expansion. The market segmentation, though not specified, likely includes residential, business (SME and enterprise), and potentially specialized segments like government and critical infrastructure. The continued investment in 5G and improved fiber networks will further drive the market toward higher speeds and greater capacity in the coming years.
The competitive landscape is dynamic, with established players constantly vying for market share and smaller providers offering specialized services and competitive pricing. Technological advancements, such as the deployment of full-fiber networks and the increased use of advanced network management systems, are also key drivers. Regulatory changes and government policies play a significant role, particularly in terms of infrastructure investment and broadband access targets. While challenges exist concerning infrastructure costs and maintaining profitability in a competitive environment, the long-term outlook for the UK fixed connectivity market remains positive, indicating sustained growth and increasing market sophistication throughout the forecast period.
UK Fixed Connectivity Market Report: 2019-2033
This comprehensive report provides an in-depth analysis of the UK fixed connectivity market, offering invaluable insights for businesses, investors, and policymakers. The study covers the period from 2019 to 2033, with a focus on the 2025-2033 forecast period. Key players such as BT Group, Vodafone Limited, and Virgin Media Business Ltd are examined, alongside emerging players shaping the market's dynamic landscape. The report leverages extensive data analysis to project market size, penetration, and growth, providing a robust foundation for informed decision-making.
UK Fixed Connectivity Market Market Structure & Competitive Dynamics
The UK fixed connectivity market is characterized by a relatively concentrated structure, with a few dominant players holding significant market share. Openreach Limited*, for instance, controls a substantial portion of the infrastructure, influencing the competitive landscape. However, smaller players, such as bOnline Limited and Full Fibre Limited, are actively innovating and expanding their market presence, particularly in the FTTP (Fiber to the Premises) segment. The market is subject to robust regulatory frameworks overseen by Ofcom, impacting pricing, infrastructure investment, and competition. The increasing demand for high-speed broadband and the rise of 5G networks are driving innovation in product offerings. M&A activity, while not at a fever pitch, remains a factor influencing market consolidation. Recent deals (specific figures unavailable – xx Million) have focused on enhancing network capabilities and expanding service portfolios. Product substitutes, such as mobile broadband, are impacting fixed-line growth, though the need for reliable high-bandwidth connectivity in businesses and homes ensures continued demand. End-user trends demonstrate a growing preference for bundled services and enhanced customer support, prompting companies to adapt their offerings.
*Market share data for individual players is unavailable (xx%).
UK Fixed Connectivity Market Industry Trends & Insights
The UK fixed connectivity market has experienced robust growth over the historical period (2019-2024), with a CAGR of xx%. This growth is driven by several factors: the increasing adoption of high-bandwidth applications (e.g., streaming, online gaming), the rise of smart homes and IoT devices, and government initiatives to improve broadband infrastructure. Technological disruptions such as the expansion of FTTP networks and the introduction of new technologies like NB-IoT (as seen with BT Group's recent investment) are fundamentally reshaping market dynamics. Consumer preferences are shifting towards faster speeds, more reliable services, and flexible contract options. Competitive dynamics are intense, with providers continuously investing in network upgrades, expanding their service portfolios, and focusing on value-added services. Market penetration of high-speed broadband continues to rise, driven by both consumer demand and government support programs. The market is expected to maintain a robust growth trajectory in the forecast period (2025-2033), with a projected CAGR of xx%, driven by sustained technological advancements and rising demand.
Dominant Markets & Segments in UK Fixed Connectivity Market
The UK fixed connectivity market displays significant regional variations in adoption and penetration rates. London and other major urban centers remain the most dominant markets, benefiting from advanced infrastructure and higher consumer spending. Key drivers fueling this dominance include robust economic activities, higher population density, increased government investments in digital infrastructure, and the concentration of businesses requiring reliable high-speed connectivity. The dominance of these regions is further reinforced by proactive local government policies promoting digitalization and attracting private sector investment. Rural areas, however, lag behind in terms of broadband penetration and speed. While specific market share data is unavailable (xx%), these trends suggest significant regional disparities.
- Key Drivers in Dominant Regions:
- High population density
- Strong economic activity
- Advanced infrastructure development
- Government investment in digital infrastructure
- Proactive local government policies
UK Fixed Connectivity Market Product Innovations
Recent product innovations focus on enhancing speed, reliability, and security. The expansion of FTTP networks is a significant development, offering significantly faster speeds compared to traditional copper-based infrastructure. The introduction of advanced network management systems and security protocols also enhances the overall user experience and data protection. Bundled services combining broadband, telephony, and television are increasingly popular, reflecting consumer preferences for convenience and cost-effectiveness. These innovations are aimed at catering to the evolving demands of residential and business users. The development of NB-IoT networks, as showcased by BT Group's recent investment, represents significant potential for growth in IoT applications, further expanding market possibilities.
Report Segmentation & Scope
This report segments the UK fixed connectivity market by technology (e.g., DSL, FTTC, FTTP, Cable), service type (e.g., broadband, leased lines, VoIP), end-user (residential, enterprise, public sector), and region. Growth projections vary considerably across these segments, with FTTP witnessing the most rapid expansion due to its superior speed and capacity. Market size and competitive dynamics also differ significantly across segments. For example, the enterprise segment is characterized by higher average revenue per user (ARPU) compared to the residential segment.
Key Drivers of UK Fixed Connectivity Market Growth
Several factors are driving the growth of the UK fixed connectivity market. Technological advancements, such as the expansion of fiber optic networks, contribute to higher speeds and greater capacity. Strong economic growth fuels demand for faster and more reliable connectivity, particularly among businesses. Government initiatives and regulatory frameworks aimed at promoting digitalization play a crucial role, including investments in infrastructure development and policies to improve broadband access in underserved areas.
Challenges in the UK Fixed Connectivity Market Sector
The UK fixed connectivity market faces several challenges. Bridging the digital divide between urban and rural areas requires substantial investment in infrastructure. Supply chain disruptions and escalating costs of materials can impact project timelines and profitability. Intense competition keeps margins tight, demanding constant innovation and efficiency gains. Regulatory complexities and ever-evolving security concerns need careful consideration.
Leading Players in the UK Fixed Connectivity Market Market
- TalkTalk Business Direct Limited
- Sky UK
- Vodafone Limited
- BT Group
- bOnline Limited
- Virgin Media Business Ltd
- TVNET Limited
- Eurocoms
- Full Fibre Limited
- ITS Technology Group Ltd
- RUCKUS (CommScope)
- Openreach Limited*
Key Developments in UK Fixed Connectivity Market Sector
- February 2024: BT Group launched its advanced NB-IoT network, promising widespread smart city and industrial applications.
- May 2024: BT Group announced an updated PSTN to digital landline transition timeline, focusing on enhanced protection for vulnerable customers.
Strategic UK Fixed Connectivity Market Market Outlook
The UK fixed connectivity market presents significant opportunities for growth. Continued investment in fiber optic infrastructure will drive expansion, particularly in underserved areas. The rise of IoT applications, coupled with the increasing demand for high-speed broadband, creates strong potential for future growth. Strategic partnerships and collaborations will be crucial in navigating the challenges and capitalizing on the opportunities presented by this dynamic market.
UK Fixed Connectivity Market Segmentation
-
1. Type
- 1.1. Fixed Data
- 1.2. Fixed Voice
-
2. End Users
- 2.1. Consumers
- 2.2. Enterprises
UK Fixed Connectivity Market Segmentation By Geography
-
1. North America
- 1.1. United States
- 1.2. Canada
- 1.3. Mexico
-
2. South America
- 2.1. Brazil
- 2.2. Argentina
- 2.3. Rest of South America
-
3. Europe
- 3.1. United Kingdom
- 3.2. Germany
- 3.3. France
- 3.4. Italy
- 3.5. Spain
- 3.6. Russia
- 3.7. Benelux
- 3.8. Nordics
- 3.9. Rest of Europe
-
4. Middle East & Africa
- 4.1. Turkey
- 4.2. Israel
- 4.3. GCC
- 4.4. North Africa
- 4.5. South Africa
- 4.6. Rest of Middle East & Africa
-
5. Asia Pacific
- 5.1. China
- 5.2. India
- 5.3. Japan
- 5.4. South Korea
- 5.5. ASEAN
- 5.6. Oceania
- 5.7. Rest of Asia Pacific
UK Fixed Connectivity Market REPORT HIGHLIGHTS
| Aspects | Details |
|---|---|
| Study Period | 2019-2033 |
| Base Year | 2024 |
| Estimated Year | 2025 |
| Forecast Period | 2025-2033 |
| Historical Period | 2019-2024 |
| Growth Rate | CAGR of 3.69% from 2019-2033 |
| Segmentation |
|
Table of Contents
- 1. Introduction
- 1.1. Research Scope
- 1.2. Market Segmentation
- 1.3. Research Methodology
- 1.4. Definitions and Assumptions
- 2. Executive Summary
- 2.1. Introduction
- 3. Market Dynamics
- 3.1. Introduction
- 3.2. Market Drivers
- 3.2.1. Huge demand for high-speed connectivity; Rising digital transformation in the industries
- 3.3. Market Restrains
- 3.3.1. Huge demand for high-speed connectivity; Rising digital transformation in the industries
- 3.4. Market Trends
- 3.4.1. Digital Transformation is Increasing Across the Industries
- 4. Market Factor Analysis
- 4.1. Porters Five Forces
- 4.2. Supply/Value Chain
- 4.3. PESTEL analysis
- 4.4. Market Entropy
- 4.5. Patent/Trademark Analysis
- 5. Global UK Fixed Connectivity Market Analysis, Insights and Forecast, 2019-2031
- 5.1. Market Analysis, Insights and Forecast - by Type
- 5.1.1. Fixed Data
- 5.1.2. Fixed Voice
- 5.2. Market Analysis, Insights and Forecast - by End Users
- 5.2.1. Consumers
- 5.2.2. Enterprises
- 5.3. Market Analysis, Insights and Forecast - by Region
- 5.3.1. North America
- 5.3.2. South America
- 5.3.3. Europe
- 5.3.4. Middle East & Africa
- 5.3.5. Asia Pacific
- 5.1. Market Analysis, Insights and Forecast - by Type
- 6. North America UK Fixed Connectivity Market Analysis, Insights and Forecast, 2019-2031
- 6.1. Market Analysis, Insights and Forecast - by Type
- 6.1.1. Fixed Data
- 6.1.2. Fixed Voice
- 6.2. Market Analysis, Insights and Forecast - by End Users
- 6.2.1. Consumers
- 6.2.2. Enterprises
- 6.1. Market Analysis, Insights and Forecast - by Type
- 7. South America UK Fixed Connectivity Market Analysis, Insights and Forecast, 2019-2031
- 7.1. Market Analysis, Insights and Forecast - by Type
- 7.1.1. Fixed Data
- 7.1.2. Fixed Voice
- 7.2. Market Analysis, Insights and Forecast - by End Users
- 7.2.1. Consumers
- 7.2.2. Enterprises
- 7.1. Market Analysis, Insights and Forecast - by Type
- 8. Europe UK Fixed Connectivity Market Analysis, Insights and Forecast, 2019-2031
- 8.1. Market Analysis, Insights and Forecast - by Type
- 8.1.1. Fixed Data
- 8.1.2. Fixed Voice
- 8.2. Market Analysis, Insights and Forecast - by End Users
- 8.2.1. Consumers
- 8.2.2. Enterprises
- 8.1. Market Analysis, Insights and Forecast - by Type
- 9. Middle East & Africa UK Fixed Connectivity Market Analysis, Insights and Forecast, 2019-2031
- 9.1. Market Analysis, Insights and Forecast - by Type
- 9.1.1. Fixed Data
- 9.1.2. Fixed Voice
- 9.2. Market Analysis, Insights and Forecast - by End Users
- 9.2.1. Consumers
- 9.2.2. Enterprises
- 9.1. Market Analysis, Insights and Forecast - by Type
- 10. Asia Pacific UK Fixed Connectivity Market Analysis, Insights and Forecast, 2019-2031
- 10.1. Market Analysis, Insights and Forecast - by Type
- 10.1.1. Fixed Data
- 10.1.2. Fixed Voice
- 10.2. Market Analysis, Insights and Forecast - by End Users
- 10.2.1. Consumers
- 10.2.2. Enterprises
- 10.1. Market Analysis, Insights and Forecast - by Type
- 11. Competitive Analysis
- 11.1. Global Market Share Analysis 2024
- 11.2. Company Profiles
- 11.2.1 TalkTalk Business Direct Limited
- 11.2.1.1. Overview
- 11.2.1.2. Products
- 11.2.1.3. SWOT Analysis
- 11.2.1.4. Recent Developments
- 11.2.1.5. Financials (Based on Availability)
- 11.2.2 Sky UK
- 11.2.2.1. Overview
- 11.2.2.2. Products
- 11.2.2.3. SWOT Analysis
- 11.2.2.4. Recent Developments
- 11.2.2.5. Financials (Based on Availability)
- 11.2.3 Vodafone Limited
- 11.2.3.1. Overview
- 11.2.3.2. Products
- 11.2.3.3. SWOT Analysis
- 11.2.3.4. Recent Developments
- 11.2.3.5. Financials (Based on Availability)
- 11.2.4 BT Group
- 11.2.4.1. Overview
- 11.2.4.2. Products
- 11.2.4.3. SWOT Analysis
- 11.2.4.4. Recent Developments
- 11.2.4.5. Financials (Based on Availability)
- 11.2.5 bOnline Limited
- 11.2.5.1. Overview
- 11.2.5.2. Products
- 11.2.5.3. SWOT Analysis
- 11.2.5.4. Recent Developments
- 11.2.5.5. Financials (Based on Availability)
- 11.2.6 Virgin Media Business Ltd
- 11.2.6.1. Overview
- 11.2.6.2. Products
- 11.2.6.3. SWOT Analysis
- 11.2.6.4. Recent Developments
- 11.2.6.5. Financials (Based on Availability)
- 11.2.7 TVNET Limited
- 11.2.7.1. Overview
- 11.2.7.2. Products
- 11.2.7.3. SWOT Analysis
- 11.2.7.4. Recent Developments
- 11.2.7.5. Financials (Based on Availability)
- 11.2.8 Eurocoms
- 11.2.8.1. Overview
- 11.2.8.2. Products
- 11.2.8.3. SWOT Analysis
- 11.2.8.4. Recent Developments
- 11.2.8.5. Financials (Based on Availability)
- 11.2.9 Full Fibre Limited
- 11.2.9.1. Overview
- 11.2.9.2. Products
- 11.2.9.3. SWOT Analysis
- 11.2.9.4. Recent Developments
- 11.2.9.5. Financials (Based on Availability)
- 11.2.10 ITS Technology Group Ltd
- 11.2.10.1. Overview
- 11.2.10.2. Products
- 11.2.10.3. SWOT Analysis
- 11.2.10.4. Recent Developments
- 11.2.10.5. Financials (Based on Availability)
- 11.2.11 RUCKUS (CommScope)
- 11.2.11.1. Overview
- 11.2.11.2. Products
- 11.2.11.3. SWOT Analysis
- 11.2.11.4. Recent Developments
- 11.2.11.5. Financials (Based on Availability)
- 11.2.12 Openreach Limited*List Not Exhaustive
- 11.2.12.1. Overview
- 11.2.12.2. Products
- 11.2.12.3. SWOT Analysis
- 11.2.12.4. Recent Developments
- 11.2.12.5. Financials (Based on Availability)
- 11.2.1 TalkTalk Business Direct Limited
List of Figures
- Figure 1: Global UK Fixed Connectivity Market Revenue Breakdown (Million, %) by Region 2024 & 2032
- Figure 2: Global UK Fixed Connectivity Market Volume Breakdown (Billion, %) by Region 2024 & 2032
- Figure 3: North America UK Fixed Connectivity Market Revenue (Million), by Type 2024 & 2032
- Figure 4: North America UK Fixed Connectivity Market Volume (Billion), by Type 2024 & 2032
- Figure 5: North America UK Fixed Connectivity Market Revenue Share (%), by Type 2024 & 2032
- Figure 6: North America UK Fixed Connectivity Market Volume Share (%), by Type 2024 & 2032
- Figure 7: North America UK Fixed Connectivity Market Revenue (Million), by End Users 2024 & 2032
- Figure 8: North America UK Fixed Connectivity Market Volume (Billion), by End Users 2024 & 2032
- Figure 9: North America UK Fixed Connectivity Market Revenue Share (%), by End Users 2024 & 2032
- Figure 10: North America UK Fixed Connectivity Market Volume Share (%), by End Users 2024 & 2032
- Figure 11: North America UK Fixed Connectivity Market Revenue (Million), by Country 2024 & 2032
- Figure 12: North America UK Fixed Connectivity Market Volume (Billion), by Country 2024 & 2032
- Figure 13: North America UK Fixed Connectivity Market Revenue Share (%), by Country 2024 & 2032
- Figure 14: North America UK Fixed Connectivity Market Volume Share (%), by Country 2024 & 2032
- Figure 15: South America UK Fixed Connectivity Market Revenue (Million), by Type 2024 & 2032
- Figure 16: South America UK Fixed Connectivity Market Volume (Billion), by Type 2024 & 2032
- Figure 17: South America UK Fixed Connectivity Market Revenue Share (%), by Type 2024 & 2032
- Figure 18: South America UK Fixed Connectivity Market Volume Share (%), by Type 2024 & 2032
- Figure 19: South America UK Fixed Connectivity Market Revenue (Million), by End Users 2024 & 2032
- Figure 20: South America UK Fixed Connectivity Market Volume (Billion), by End Users 2024 & 2032
- Figure 21: South America UK Fixed Connectivity Market Revenue Share (%), by End Users 2024 & 2032
- Figure 22: South America UK Fixed Connectivity Market Volume Share (%), by End Users 2024 & 2032
- Figure 23: South America UK Fixed Connectivity Market Revenue (Million), by Country 2024 & 2032
- Figure 24: South America UK Fixed Connectivity Market Volume (Billion), by Country 2024 & 2032
- Figure 25: South America UK Fixed Connectivity Market Revenue Share (%), by Country 2024 & 2032
- Figure 26: South America UK Fixed Connectivity Market Volume Share (%), by Country 2024 & 2032
- Figure 27: Europe UK Fixed Connectivity Market Revenue (Million), by Type 2024 & 2032
- Figure 28: Europe UK Fixed Connectivity Market Volume (Billion), by Type 2024 & 2032
- Figure 29: Europe UK Fixed Connectivity Market Revenue Share (%), by Type 2024 & 2032
- Figure 30: Europe UK Fixed Connectivity Market Volume Share (%), by Type 2024 & 2032
- Figure 31: Europe UK Fixed Connectivity Market Revenue (Million), by End Users 2024 & 2032
- Figure 32: Europe UK Fixed Connectivity Market Volume (Billion), by End Users 2024 & 2032
- Figure 33: Europe UK Fixed Connectivity Market Revenue Share (%), by End Users 2024 & 2032
- Figure 34: Europe UK Fixed Connectivity Market Volume Share (%), by End Users 2024 & 2032
- Figure 35: Europe UK Fixed Connectivity Market Revenue (Million), by Country 2024 & 2032
- Figure 36: Europe UK Fixed Connectivity Market Volume (Billion), by Country 2024 & 2032
- Figure 37: Europe UK Fixed Connectivity Market Revenue Share (%), by Country 2024 & 2032
- Figure 38: Europe UK Fixed Connectivity Market Volume Share (%), by Country 2024 & 2032
- Figure 39: Middle East & Africa UK Fixed Connectivity Market Revenue (Million), by Type 2024 & 2032
- Figure 40: Middle East & Africa UK Fixed Connectivity Market Volume (Billion), by Type 2024 & 2032
- Figure 41: Middle East & Africa UK Fixed Connectivity Market Revenue Share (%), by Type 2024 & 2032
- Figure 42: Middle East & Africa UK Fixed Connectivity Market Volume Share (%), by Type 2024 & 2032
- Figure 43: Middle East & Africa UK Fixed Connectivity Market Revenue (Million), by End Users 2024 & 2032
- Figure 44: Middle East & Africa UK Fixed Connectivity Market Volume (Billion), by End Users 2024 & 2032
- Figure 45: Middle East & Africa UK Fixed Connectivity Market Revenue Share (%), by End Users 2024 & 2032
- Figure 46: Middle East & Africa UK Fixed Connectivity Market Volume Share (%), by End Users 2024 & 2032
- Figure 47: Middle East & Africa UK Fixed Connectivity Market Revenue (Million), by Country 2024 & 2032
- Figure 48: Middle East & Africa UK Fixed Connectivity Market Volume (Billion), by Country 2024 & 2032
- Figure 49: Middle East & Africa UK Fixed Connectivity Market Revenue Share (%), by Country 2024 & 2032
- Figure 50: Middle East & Africa UK Fixed Connectivity Market Volume Share (%), by Country 2024 & 2032
- Figure 51: Asia Pacific UK Fixed Connectivity Market Revenue (Million), by Type 2024 & 2032
- Figure 52: Asia Pacific UK Fixed Connectivity Market Volume (Billion), by Type 2024 & 2032
- Figure 53: Asia Pacific UK Fixed Connectivity Market Revenue Share (%), by Type 2024 & 2032
- Figure 54: Asia Pacific UK Fixed Connectivity Market Volume Share (%), by Type 2024 & 2032
- Figure 55: Asia Pacific UK Fixed Connectivity Market Revenue (Million), by End Users 2024 & 2032
- Figure 56: Asia Pacific UK Fixed Connectivity Market Volume (Billion), by End Users 2024 & 2032
- Figure 57: Asia Pacific UK Fixed Connectivity Market Revenue Share (%), by End Users 2024 & 2032
- Figure 58: Asia Pacific UK Fixed Connectivity Market Volume Share (%), by End Users 2024 & 2032
- Figure 59: Asia Pacific UK Fixed Connectivity Market Revenue (Million), by Country 2024 & 2032
- Figure 60: Asia Pacific UK Fixed Connectivity Market Volume (Billion), by Country 2024 & 2032
- Figure 61: Asia Pacific UK Fixed Connectivity Market Revenue Share (%), by Country 2024 & 2032
- Figure 62: Asia Pacific UK Fixed Connectivity Market Volume Share (%), by Country 2024 & 2032
List of Tables
- Table 1: Global UK Fixed Connectivity Market Revenue Million Forecast, by Region 2019 & 2032
- Table 2: Global UK Fixed Connectivity Market Volume Billion Forecast, by Region 2019 & 2032
- Table 3: Global UK Fixed Connectivity Market Revenue Million Forecast, by Type 2019 & 2032
- Table 4: Global UK Fixed Connectivity Market Volume Billion Forecast, by Type 2019 & 2032
- Table 5: Global UK Fixed Connectivity Market Revenue Million Forecast, by End Users 2019 & 2032
- Table 6: Global UK Fixed Connectivity Market Volume Billion Forecast, by End Users 2019 & 2032
- Table 7: Global UK Fixed Connectivity Market Revenue Million Forecast, by Region 2019 & 2032
- Table 8: Global UK Fixed Connectivity Market Volume Billion Forecast, by Region 2019 & 2032
- Table 9: Global UK Fixed Connectivity Market Revenue Million Forecast, by Type 2019 & 2032
- Table 10: Global UK Fixed Connectivity Market Volume Billion Forecast, by Type 2019 & 2032
- Table 11: Global UK Fixed Connectivity Market Revenue Million Forecast, by End Users 2019 & 2032
- Table 12: Global UK Fixed Connectivity Market Volume Billion Forecast, by End Users 2019 & 2032
- Table 13: Global UK Fixed Connectivity Market Revenue Million Forecast, by Country 2019 & 2032
- Table 14: Global UK Fixed Connectivity Market Volume Billion Forecast, by Country 2019 & 2032
- Table 15: United States UK Fixed Connectivity Market Revenue (Million) Forecast, by Application 2019 & 2032
- Table 16: United States UK Fixed Connectivity Market Volume (Billion) Forecast, by Application 2019 & 2032
- Table 17: Canada UK Fixed Connectivity Market Revenue (Million) Forecast, by Application 2019 & 2032
- Table 18: Canada UK Fixed Connectivity Market Volume (Billion) Forecast, by Application 2019 & 2032
- Table 19: Mexico UK Fixed Connectivity Market Revenue (Million) Forecast, by Application 2019 & 2032
- Table 20: Mexico UK Fixed Connectivity Market Volume (Billion) Forecast, by Application 2019 & 2032
- Table 21: Global UK Fixed Connectivity Market Revenue Million Forecast, by Type 2019 & 2032
- Table 22: Global UK Fixed Connectivity Market Volume Billion Forecast, by Type 2019 & 2032
- Table 23: Global UK Fixed Connectivity Market Revenue Million Forecast, by End Users 2019 & 2032
- Table 24: Global UK Fixed Connectivity Market Volume Billion Forecast, by End Users 2019 & 2032
- Table 25: Global UK Fixed Connectivity Market Revenue Million Forecast, by Country 2019 & 2032
- Table 26: Global UK Fixed Connectivity Market Volume Billion Forecast, by Country 2019 & 2032
- Table 27: Brazil UK Fixed Connectivity Market Revenue (Million) Forecast, by Application 2019 & 2032
- Table 28: Brazil UK Fixed Connectivity Market Volume (Billion) Forecast, by Application 2019 & 2032
- Table 29: Argentina UK Fixed Connectivity Market Revenue (Million) Forecast, by Application 2019 & 2032
- Table 30: Argentina UK Fixed Connectivity Market Volume (Billion) Forecast, by Application 2019 & 2032
- Table 31: Rest of South America UK Fixed Connectivity Market Revenue (Million) Forecast, by Application 2019 & 2032
- Table 32: Rest of South America UK Fixed Connectivity Market Volume (Billion) Forecast, by Application 2019 & 2032
- Table 33: Global UK Fixed Connectivity Market Revenue Million Forecast, by Type 2019 & 2032
- Table 34: Global UK Fixed Connectivity Market Volume Billion Forecast, by Type 2019 & 2032
- Table 35: Global UK Fixed Connectivity Market Revenue Million Forecast, by End Users 2019 & 2032
- Table 36: Global UK Fixed Connectivity Market Volume Billion Forecast, by End Users 2019 & 2032
- Table 37: Global UK Fixed Connectivity Market Revenue Million Forecast, by Country 2019 & 2032
- Table 38: Global UK Fixed Connectivity Market Volume Billion Forecast, by Country 2019 & 2032
- Table 39: United Kingdom UK Fixed Connectivity Market Revenue (Million) Forecast, by Application 2019 & 2032
- Table 40: United Kingdom UK Fixed Connectivity Market Volume (Billion) Forecast, by Application 2019 & 2032
- Table 41: Germany UK Fixed Connectivity Market Revenue (Million) Forecast, by Application 2019 & 2032
- Table 42: Germany UK Fixed Connectivity Market Volume (Billion) Forecast, by Application 2019 & 2032
- Table 43: France UK Fixed Connectivity Market Revenue (Million) Forecast, by Application 2019 & 2032
- Table 44: France UK Fixed Connectivity Market Volume (Billion) Forecast, by Application 2019 & 2032
- Table 45: Italy UK Fixed Connectivity Market Revenue (Million) Forecast, by Application 2019 & 2032
- Table 46: Italy UK Fixed Connectivity Market Volume (Billion) Forecast, by Application 2019 & 2032
- Table 47: Spain UK Fixed Connectivity Market Revenue (Million) Forecast, by Application 2019 & 2032
- Table 48: Spain UK Fixed Connectivity Market Volume (Billion) Forecast, by Application 2019 & 2032
- Table 49: Russia UK Fixed Connectivity Market Revenue (Million) Forecast, by Application 2019 & 2032
- Table 50: Russia UK Fixed Connectivity Market Volume (Billion) Forecast, by Application 2019 & 2032
- Table 51: Benelux UK Fixed Connectivity Market Revenue (Million) Forecast, by Application 2019 & 2032
- Table 52: Benelux UK Fixed Connectivity Market Volume (Billion) Forecast, by Application 2019 & 2032
- Table 53: Nordics UK Fixed Connectivity Market Revenue (Million) Forecast, by Application 2019 & 2032
- Table 54: Nordics UK Fixed Connectivity Market Volume (Billion) Forecast, by Application 2019 & 2032
- Table 55: Rest of Europe UK Fixed Connectivity Market Revenue (Million) Forecast, by Application 2019 & 2032
- Table 56: Rest of Europe UK Fixed Connectivity Market Volume (Billion) Forecast, by Application 2019 & 2032
- Table 57: Global UK Fixed Connectivity Market Revenue Million Forecast, by Type 2019 & 2032
- Table 58: Global UK Fixed Connectivity Market Volume Billion Forecast, by Type 2019 & 2032
- Table 59: Global UK Fixed Connectivity Market Revenue Million Forecast, by End Users 2019 & 2032
- Table 60: Global UK Fixed Connectivity Market Volume Billion Forecast, by End Users 2019 & 2032
- Table 61: Global UK Fixed Connectivity Market Revenue Million Forecast, by Country 2019 & 2032
- Table 62: Global UK Fixed Connectivity Market Volume Billion Forecast, by Country 2019 & 2032
- Table 63: Turkey UK Fixed Connectivity Market Revenue (Million) Forecast, by Application 2019 & 2032
- Table 64: Turkey UK Fixed Connectivity Market Volume (Billion) Forecast, by Application 2019 & 2032
- Table 65: Israel UK Fixed Connectivity Market Revenue (Million) Forecast, by Application 2019 & 2032
- Table 66: Israel UK Fixed Connectivity Market Volume (Billion) Forecast, by Application 2019 & 2032
- Table 67: GCC UK Fixed Connectivity Market Revenue (Million) Forecast, by Application 2019 & 2032
- Table 68: GCC UK Fixed Connectivity Market Volume (Billion) Forecast, by Application 2019 & 2032
- Table 69: North Africa UK Fixed Connectivity Market Revenue (Million) Forecast, by Application 2019 & 2032
- Table 70: North Africa UK Fixed Connectivity Market Volume (Billion) Forecast, by Application 2019 & 2032
- Table 71: South Africa UK Fixed Connectivity Market Revenue (Million) Forecast, by Application 2019 & 2032
- Table 72: South Africa UK Fixed Connectivity Market Volume (Billion) Forecast, by Application 2019 & 2032
- Table 73: Rest of Middle East & Africa UK Fixed Connectivity Market Revenue (Million) Forecast, by Application 2019 & 2032
- Table 74: Rest of Middle East & Africa UK Fixed Connectivity Market Volume (Billion) Forecast, by Application 2019 & 2032
- Table 75: Global UK Fixed Connectivity Market Revenue Million Forecast, by Type 2019 & 2032
- Table 76: Global UK Fixed Connectivity Market Volume Billion Forecast, by Type 2019 & 2032
- Table 77: Global UK Fixed Connectivity Market Revenue Million Forecast, by End Users 2019 & 2032
- Table 78: Global UK Fixed Connectivity Market Volume Billion Forecast, by End Users 2019 & 2032
- Table 79: Global UK Fixed Connectivity Market Revenue Million Forecast, by Country 2019 & 2032
- Table 80: Global UK Fixed Connectivity Market Volume Billion Forecast, by Country 2019 & 2032
- Table 81: China UK Fixed Connectivity Market Revenue (Million) Forecast, by Application 2019 & 2032
- Table 82: China UK Fixed Connectivity Market Volume (Billion) Forecast, by Application 2019 & 2032
- Table 83: India UK Fixed Connectivity Market Revenue (Million) Forecast, by Application 2019 & 2032
- Table 84: India UK Fixed Connectivity Market Volume (Billion) Forecast, by Application 2019 & 2032
- Table 85: Japan UK Fixed Connectivity Market Revenue (Million) Forecast, by Application 2019 & 2032
- Table 86: Japan UK Fixed Connectivity Market Volume (Billion) Forecast, by Application 2019 & 2032
- Table 87: South Korea UK Fixed Connectivity Market Revenue (Million) Forecast, by Application 2019 & 2032
- Table 88: South Korea UK Fixed Connectivity Market Volume (Billion) Forecast, by Application 2019 & 2032
- Table 89: ASEAN UK Fixed Connectivity Market Revenue (Million) Forecast, by Application 2019 & 2032
- Table 90: ASEAN UK Fixed Connectivity Market Volume (Billion) Forecast, by Application 2019 & 2032
- Table 91: Oceania UK Fixed Connectivity Market Revenue (Million) Forecast, by Application 2019 & 2032
- Table 92: Oceania UK Fixed Connectivity Market Volume (Billion) Forecast, by Application 2019 & 2032
- Table 93: Rest of Asia Pacific UK Fixed Connectivity Market Revenue (Million) Forecast, by Application 2019 & 2032
- Table 94: Rest of Asia Pacific UK Fixed Connectivity Market Volume (Billion) Forecast, by Application 2019 & 2032
Frequently Asked Questions
1. What is the projected Compound Annual Growth Rate (CAGR) of the UK Fixed Connectivity Market?
The projected CAGR is approximately 3.69%.
2. Which companies are prominent players in the UK Fixed Connectivity Market?
Key companies in the market include TalkTalk Business Direct Limited, Sky UK, Vodafone Limited, BT Group, bOnline Limited, Virgin Media Business Ltd, TVNET Limited, Eurocoms, Full Fibre Limited, ITS Technology Group Ltd, RUCKUS (CommScope), Openreach Limited*List Not Exhaustive.
3. What are the main segments of the UK Fixed Connectivity Market?
The market segments include Type, End Users.
4. Can you provide details about the market size?
The market size is estimated to be USD 34.02 Million as of 2022.
5. What are some drivers contributing to market growth?
Huge demand for high-speed connectivity; Rising digital transformation in the industries.
6. What are the notable trends driving market growth?
Digital Transformation is Increasing Across the Industries.
7. Are there any restraints impacting market growth?
Huge demand for high-speed connectivity; Rising digital transformation in the industries.
8. Can you provide examples of recent developments in the market?
May 2024: BT Group, the UK's provider of fixed and mobile telecommunications, along with a suite of secure digital offerings, unveiled an updated timeline for transitioning all its customers, spanning both individual consumers and businesses from the traditional Public Switched Telephone Network (PSTN) to digital landlines. The move followed the introduction of a series of program enhancements aimed at better protecting vulnerable customers, especially those with additional needs, such as telecare users.February 2024: BT Group, the provider of fixed and mobile telecommunications in the United Kingdom, unveiled its advanced NB-IoT network. This multi-million-pound investment is poised to catalyze the development of smart cities and industries across the UK, boasting an overall 97% population coverage. Powered by the EE mobile network, NB-IoT is a low-power network, holding the potential to transform sectors like utilities, construction, and the public domain.
9. What pricing options are available for accessing the report?
Pricing options include single-user, multi-user, and enterprise licenses priced at USD 3800, USD 4500, and USD 5800 respectively.
10. Is the market size provided in terms of value or volume?
The market size is provided in terms of value, measured in Million and volume, measured in Billion.
11. Are there any specific market keywords associated with the report?
Yes, the market keyword associated with the report is "UK Fixed Connectivity Market," which aids in identifying and referencing the specific market segment covered.
12. How do I determine which pricing option suits my needs best?
The pricing options vary based on user requirements and access needs. Individual users may opt for single-user licenses, while businesses requiring broader access may choose multi-user or enterprise licenses for cost-effective access to the report.
13. Are there any additional resources or data provided in the UK Fixed Connectivity Market report?
While the report offers comprehensive insights, it's advisable to review the specific contents or supplementary materials provided to ascertain if additional resources or data are available.
14. How can I stay updated on further developments or reports in the UK Fixed Connectivity Market?
To stay informed about further developments, trends, and reports in the UK Fixed Connectivity Market, consider subscribing to industry newsletters, following relevant companies and organizations, or regularly checking reputable industry news sources and publications.
Methodology
Step 1 - Identification of Relevant Samples Size from Population Database


Step 2 - Approaches for Defining Global Market Size (Value, Volume* & Price*)

Note*: In applicable scenarios
Step 3 - Data Sources
Primary Research
- Web Analytics
- Survey Reports
- Research Institute
- Latest Research Reports
- Opinion Leaders
Secondary Research
- Annual Reports
- White Paper
- Latest Press Release
- Industry Association
- Paid Database
- Investor Presentations

Step 4 - Data Triangulation
Involves using different sources of information in order to increase the validity of a study
These sources are likely to be stakeholders in a program - participants, other researchers, program staff, other community members, and so on.
Then we put all data in single framework & apply various statistical tools to find out the dynamic on the market.
During the analysis stage, feedback from the stakeholder groups would be compared to determine areas of agreement as well as areas of divergence


