
Key Insights
The touch-free forehead thermometer market is experiencing robust growth, driven by increasing consumer preference for convenient, hygienic, and accurate temperature measurement. The market's expansion is fueled by several key factors, including rising awareness of infectious diseases (particularly post-pandemic), technological advancements leading to improved accuracy and faster reading times, and increasing affordability of these devices. The market is segmented by product type (e.g., infrared thermometers, temporal artery thermometers), by end-user (hospitals, clinics, homes), and by region, with North America and Europe currently holding significant market share. Competition within the market is intense, with established players like Braun, Omron, and Microlife facing competition from emerging brands offering innovative features and competitive pricing. However, factors like potential for inaccurate readings under certain conditions (e.g., ambient temperature fluctuations, sweat on the forehead) and the initial higher purchase price compared to traditional thermometers pose challenges to continued market growth. We project sustained growth over the forecast period (2025-2033), driven by continued innovation and increasing adoption in both healthcare settings and homes.
The forecast period will likely see a shift in market dynamics. The focus on improving accuracy and incorporating features like fever alerts and data logging will be crucial for companies to maintain competitiveness. Expansion into emerging markets, particularly in Asia and Africa, presents significant opportunities for growth. Further, the integration of smart home technology and telehealth platforms could create new avenues for sales and market expansion. Regulatory compliance and ensuring accurate product labeling will be key for manufacturers to maintain consumer trust and navigate evolving market regulations. The development of advanced features like multi-user profiles and smartphone connectivity will be critical to satisfying consumer demands and increasing market penetration. Considering these factors, the market is poised for significant expansion in the coming years.
This comprehensive report provides a detailed analysis of the global touch-free forehead thermometers market, offering invaluable insights for industry stakeholders, investors, and market researchers. The report covers the period from 2019 to 2033, with a focus on the forecast period of 2025-2033 and a base year of 2025. The market is valued at $XX million in 2025 and is projected to reach $XX million by 2033, exhibiting a CAGR of XX% during the forecast period. This report leverages rigorous market research methodologies, incorporating both qualitative and quantitative data to provide a holistic understanding of the market dynamics.
Touch-Free Forehead Thermometers Market Structure & Competitive Dynamics
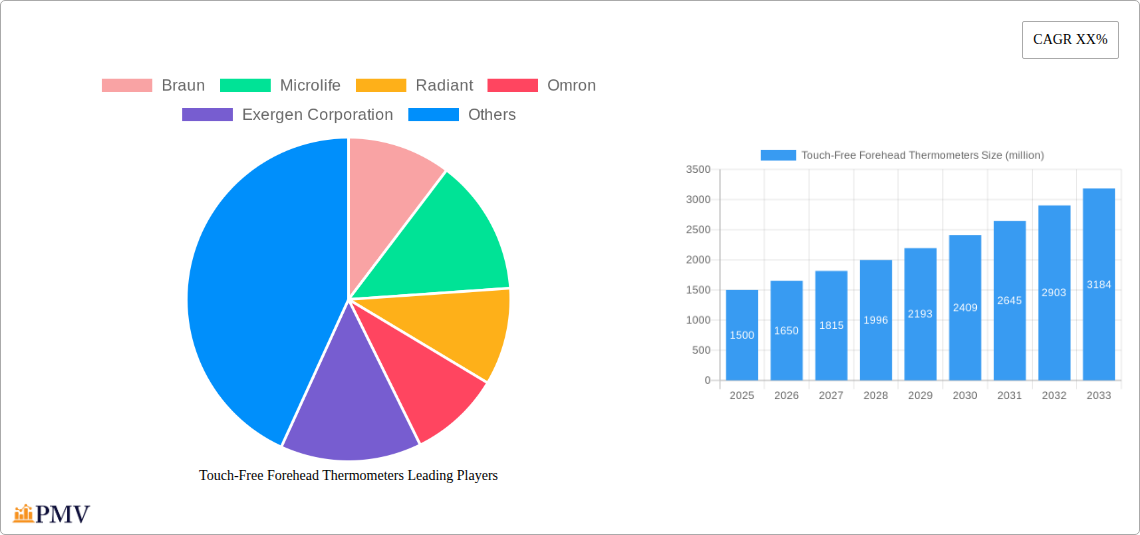
The global touch-free forehead thermometers market is characterized by a moderately concentrated competitive landscape, with several key players holding significant market shares. Market concentration is measured by the Herfindahl-Hirschman Index (HHI) at XX, indicating a moderately competitive environment. The market structure is dynamic, driven by continuous innovation, strategic mergers and acquisitions (M&A), and evolving regulatory frameworks. Product differentiation plays a crucial role, with companies focusing on features such as accuracy, speed, ease of use, and additional functionalities like fever alerts and data logging. Significant M&A activities in the recent past have shaped the landscape. For example, a deal valued at $XX million between Company A and Company B reshaped the market dynamics.
- Market Share (2025): Braun (XX%), Microlife (XX%), Omron (XX%), Exergen Corporation (XX%), Other players (XX%).
- Innovation Ecosystems: Strong focus on improving accuracy, enhancing user interface, and integrating smart technology.
- Regulatory Frameworks: Compliance with stringent medical device regulations varies across regions, influencing market access.
- Product Substitutes: Traditional mercury thermometers, ear thermometers, and temporal artery thermometers pose some level of competition.
- End-User Trends: Increasing demand from hospitals, clinics, and homes due to heightened hygiene concerns and preference for non-contact methods.
- M&A Activities (2019-2024): Total deal value estimated at $XX million, with a majority driven by strategic acquisitions of smaller companies by industry giants.
Touch-Free Forehead Thermometers Industry Trends & Insights
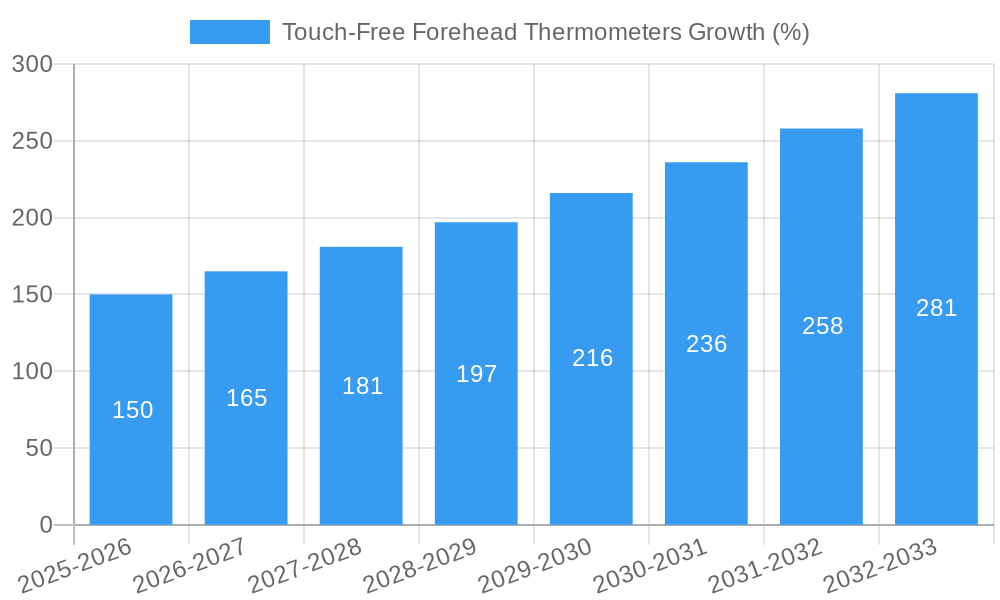
The touch-free forehead thermometers market is experiencing robust growth, propelled by several key factors. The increasing prevalence of infectious diseases, coupled with a heightened awareness of hygiene and infection control, is a significant driver. Technological advancements, such as improved sensor technology and enhanced accuracy, are further bolstering market expansion. Consumer preferences are shifting towards convenient, user-friendly, and technologically advanced products, fueling demand for touch-free thermometers. The market penetration rate for touch-free thermometers in household settings stands at XX%, with projected growth to XX% by 2033. Technological disruptions, such as the integration of smart features and connectivity with mobile applications, are transforming the market landscape. Competitive dynamics are characterized by intense rivalry, with companies continuously striving to innovate and improve their product offerings. The market is expected to witness a CAGR of XX% during the forecast period.
Dominant Markets & Segments in Touch-Free Forehead Thermometers
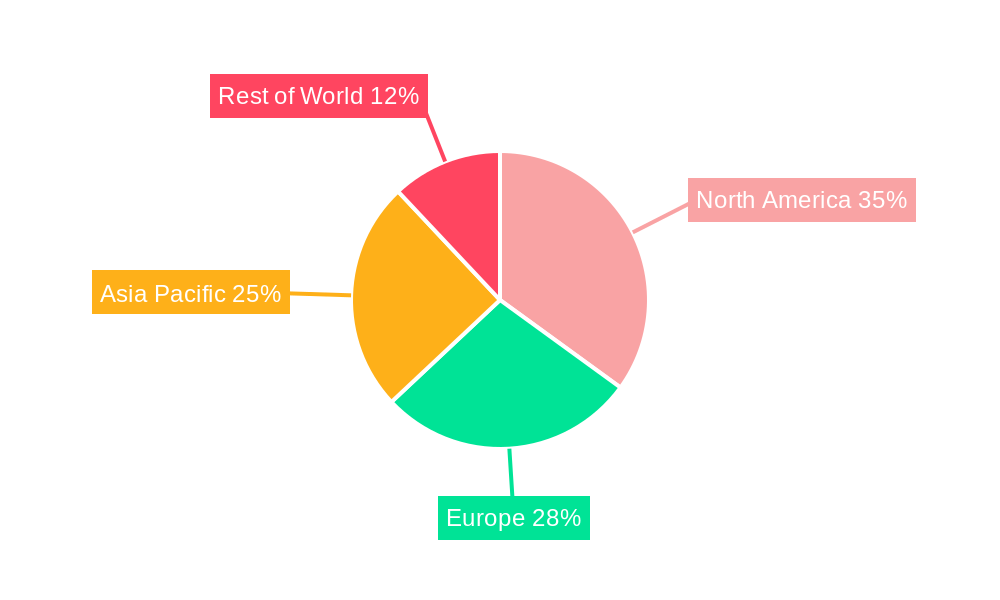
The North American region currently holds the largest market share in the touch-free forehead thermometers market, driven by factors such as high disposable incomes, advanced healthcare infrastructure, and early adoption of technologically advanced products. The high prevalence of chronic diseases and the growing geriatric population also significantly contribute to the region’s dominance.
- Key Drivers in North America:
- Strong healthcare infrastructure
- High disposable incomes
- Growing geriatric population
- Increased awareness of hygiene and infection control
The dominance of North America is also attributed to several factors: stringent regulatory frameworks drive high-quality product adoption, advanced healthcare infrastructure facilitates market penetration, and a considerable proportion of the population has access to quality healthcare, fueling demand for advanced medical devices.
Touch-Free Forehead Thermometers Product Innovations
Recent innovations in touch-free forehead thermometers focus on enhancing accuracy, speed, and user experience. Advanced infrared sensors and sophisticated algorithms are employed to ensure precise temperature readings. Features such as silent operation, backlit displays, and fever alerts are enhancing user-friendliness. The integration of connectivity features, enabling data logging and sharing via mobile applications, is another key trend. These advancements cater to evolving consumer preferences and meet diverse clinical needs.
Report Segmentation & Scope
The global touch-free forehead thermometer market is segmented by product type (e.g., digital, analog), end-user (hospitals, clinics, homes), and geography (North America, Europe, Asia Pacific, Middle East & Africa, South America). Each segment exhibits unique growth trajectories and competitive dynamics. For example, the home segment is expected to witness faster growth compared to the hospital segment due to increasing consumer awareness and demand for convenience. Market size for each segment is estimated and forecasted based on extensive primary and secondary research.
Key Drivers of Touch-Free Forehead Thermometers Growth
Several factors are propelling the growth of the touch-free forehead thermometers market. The increasing prevalence of infectious diseases, especially in densely populated areas, is a primary driver, as touch-free technology minimizes the risk of cross-contamination. Technological advancements, such as improved sensor technology leading to higher accuracy and faster readings, also contribute significantly. Government initiatives promoting better hygiene practices and disease surveillance further bolster market growth. Economic factors, such as rising disposable incomes in developing economies, are expanding the target market.
Challenges in the Touch-Free Forehead Thermometers Sector
The touch-free forehead thermometer market faces several challenges. Stringent regulatory requirements for medical devices can increase costs and time to market. Supply chain disruptions can affect production and distribution, impacting market availability. Intense competition from established and emerging players requires continuous innovation and product differentiation. The accuracy of readings can be impacted by environmental factors like ambient temperature, potentially leading to misdiagnosis and impacting market confidence. These factors can hinder market growth.
Leading Players in the Touch-Free Forehead Thermometers Market
- Braun
- Microlife
- Radiant
- Omron
- Exergen Corporation
- Hill-Rom
- EASYWELL BIOMEDICALS
- AViTA
- American Diagnostic
- Innovo Medical
- A&D Medical
Key Developments in Touch-Free Forehead Thermometers Sector
- 2022-Q4: Launch of a new touch-free thermometer with enhanced accuracy by Omron.
- 2023-Q1: Acquisition of a smaller thermometer manufacturer by Braun.
- 2023-Q3: Introduction of a smart thermometer with mobile app integration by Exergen Corporation. (Further details are unavailable, but these are examples of the types of entries that will appear here.)
Strategic Touch-Free Forehead Thermometers Market Outlook
The touch-free forehead thermometer market presents significant growth potential driven by technological advancements, expanding healthcare infrastructure, and increasing health consciousness among consumers. Strategic opportunities lie in developing innovative products with advanced features, expanding into emerging markets, and leveraging digital platforms to reach wider audiences. Focus on product differentiation, strategic partnerships, and effective marketing strategies will be crucial for success. The market is poised for continued expansion, offering promising prospects for established players and new entrants alike.
Touch-Free Forehead Thermometers Segmentation
-
1. Application
- 1.1. Hospital
- 1.2. Home Use
- 1.3. Others
-
2. Types
- 2.1. Accuracy ± 0.1 ℃
- 2.2. Accuracy ± 0.05 ℃
Touch-Free Forehead Thermometers Segmentation By Geography
-
1. North America
- 1.1. United States
- 1.2. Canada
- 1.3. Mexico
-
2. South America
- 2.1. Brazil
- 2.2. Argentina
- 2.3. Rest of South America
-
3. Europe
- 3.1. United Kingdom
- 3.2. Germany
- 3.3. France
- 3.4. Italy
- 3.5. Spain
- 3.6. Russia
- 3.7. Benelux
- 3.8. Nordics
- 3.9. Rest of Europe
-
4. Middle East & Africa
- 4.1. Turkey
- 4.2. Israel
- 4.3. GCC
- 4.4. North Africa
- 4.5. South Africa
- 4.6. Rest of Middle East & Africa
-
5. Asia Pacific
- 5.1. China
- 5.2. India
- 5.3. Japan
- 5.4. South Korea
- 5.5. ASEAN
- 5.6. Oceania
- 5.7. Rest of Asia Pacific
Touch-Free Forehead Thermometers REPORT HIGHLIGHTS
| Aspects | Details |
|---|---|
| Study Period | 2019-2033 |
| Base Year | 2024 |
| Estimated Year | 2025 |
| Forecast Period | 2025-2033 |
| Historical Period | 2019-2024 |
| Growth Rate | CAGR of XX% from 2019-2033 |
| Segmentation |
|
Table of Contents
- 1. Introduction
- 1.1. Research Scope
- 1.2. Market Segmentation
- 1.3. Research Methodology
- 1.4. Definitions and Assumptions
- 2. Executive Summary
- 2.1. Introduction
- 3. Market Dynamics
- 3.1. Introduction
- 3.2. Market Drivers
- 3.3. Market Restrains
- 3.4. Market Trends
- 4. Market Factor Analysis
- 4.1. Porters Five Forces
- 4.2. Supply/Value Chain
- 4.3. PESTEL analysis
- 4.4. Market Entropy
- 4.5. Patent/Trademark Analysis
- 5. Global Touch-Free Forehead Thermometers Analysis, Insights and Forecast, 2019-2031
- 5.1. Market Analysis, Insights and Forecast - by Application
- 5.1.1. Hospital
- 5.1.2. Home Use
- 5.1.3. Others
- 5.2. Market Analysis, Insights and Forecast - by Types
- 5.2.1. Accuracy ± 0.1 ℃
- 5.2.2. Accuracy ± 0.05 ℃
- 5.3. Market Analysis, Insights and Forecast - by Region
- 5.3.1. North America
- 5.3.2. South America
- 5.3.3. Europe
- 5.3.4. Middle East & Africa
- 5.3.5. Asia Pacific
- 5.1. Market Analysis, Insights and Forecast - by Application
- 6. North America Touch-Free Forehead Thermometers Analysis, Insights and Forecast, 2019-2031
- 6.1. Market Analysis, Insights and Forecast - by Application
- 6.1.1. Hospital
- 6.1.2. Home Use
- 6.1.3. Others
- 6.2. Market Analysis, Insights and Forecast - by Types
- 6.2.1. Accuracy ± 0.1 ℃
- 6.2.2. Accuracy ± 0.05 ℃
- 6.1. Market Analysis, Insights and Forecast - by Application
- 7. South America Touch-Free Forehead Thermometers Analysis, Insights and Forecast, 2019-2031
- 7.1. Market Analysis, Insights and Forecast - by Application
- 7.1.1. Hospital
- 7.1.2. Home Use
- 7.1.3. Others
- 7.2. Market Analysis, Insights and Forecast - by Types
- 7.2.1. Accuracy ± 0.1 ℃
- 7.2.2. Accuracy ± 0.05 ℃
- 7.1. Market Analysis, Insights and Forecast - by Application
- 8. Europe Touch-Free Forehead Thermometers Analysis, Insights and Forecast, 2019-2031
- 8.1. Market Analysis, Insights and Forecast - by Application
- 8.1.1. Hospital
- 8.1.2. Home Use
- 8.1.3. Others
- 8.2. Market Analysis, Insights and Forecast - by Types
- 8.2.1. Accuracy ± 0.1 ℃
- 8.2.2. Accuracy ± 0.05 ℃
- 8.1. Market Analysis, Insights and Forecast - by Application
- 9. Middle East & Africa Touch-Free Forehead Thermometers Analysis, Insights and Forecast, 2019-2031
- 9.1. Market Analysis, Insights and Forecast - by Application
- 9.1.1. Hospital
- 9.1.2. Home Use
- 9.1.3. Others
- 9.2. Market Analysis, Insights and Forecast - by Types
- 9.2.1. Accuracy ± 0.1 ℃
- 9.2.2. Accuracy ± 0.05 ℃
- 9.1. Market Analysis, Insights and Forecast - by Application
- 10. Asia Pacific Touch-Free Forehead Thermometers Analysis, Insights and Forecast, 2019-2031
- 10.1. Market Analysis, Insights and Forecast - by Application
- 10.1.1. Hospital
- 10.1.2. Home Use
- 10.1.3. Others
- 10.2. Market Analysis, Insights and Forecast - by Types
- 10.2.1. Accuracy ± 0.1 ℃
- 10.2.2. Accuracy ± 0.05 ℃
- 10.1. Market Analysis, Insights and Forecast - by Application
- 11. Competitive Analysis
- 11.1. Global Market Share Analysis 2024
- 11.2. Company Profiles
- 11.2.1 Braun
- 11.2.1.1. Overview
- 11.2.1.2. Products
- 11.2.1.3. SWOT Analysis
- 11.2.1.4. Recent Developments
- 11.2.1.5. Financials (Based on Availability)
- 11.2.2 Microlife
- 11.2.2.1. Overview
- 11.2.2.2. Products
- 11.2.2.3. SWOT Analysis
- 11.2.2.4. Recent Developments
- 11.2.2.5. Financials (Based on Availability)
- 11.2.3 Radiant
- 11.2.3.1. Overview
- 11.2.3.2. Products
- 11.2.3.3. SWOT Analysis
- 11.2.3.4. Recent Developments
- 11.2.3.5. Financials (Based on Availability)
- 11.2.4 Omron
- 11.2.4.1. Overview
- 11.2.4.2. Products
- 11.2.4.3. SWOT Analysis
- 11.2.4.4. Recent Developments
- 11.2.4.5. Financials (Based on Availability)
- 11.2.5 Exergen Corporation
- 11.2.5.1. Overview
- 11.2.5.2. Products
- 11.2.5.3. SWOT Analysis
- 11.2.5.4. Recent Developments
- 11.2.5.5. Financials (Based on Availability)
- 11.2.6 Hill-Rom
- 11.2.6.1. Overview
- 11.2.6.2. Products
- 11.2.6.3. SWOT Analysis
- 11.2.6.4. Recent Developments
- 11.2.6.5. Financials (Based on Availability)
- 11.2.7 EASYWELL BIOMEDICALS
- 11.2.7.1. Overview
- 11.2.7.2. Products
- 11.2.7.3. SWOT Analysis
- 11.2.7.4. Recent Developments
- 11.2.7.5. Financials (Based on Availability)
- 11.2.8 AViTA
- 11.2.8.1. Overview
- 11.2.8.2. Products
- 11.2.8.3. SWOT Analysis
- 11.2.8.4. Recent Developments
- 11.2.8.5. Financials (Based on Availability)
- 11.2.9 American Diagnostic
- 11.2.9.1. Overview
- 11.2.9.2. Products
- 11.2.9.3. SWOT Analysis
- 11.2.9.4. Recent Developments
- 11.2.9.5. Financials (Based on Availability)
- 11.2.10 Innovo Medical
- 11.2.10.1. Overview
- 11.2.10.2. Products
- 11.2.10.3. SWOT Analysis
- 11.2.10.4. Recent Developments
- 11.2.10.5. Financials (Based on Availability)
- 11.2.11 A&D Medical
- 11.2.11.1. Overview
- 11.2.11.2. Products
- 11.2.11.3. SWOT Analysis
- 11.2.11.4. Recent Developments
- 11.2.11.5. Financials (Based on Availability)
- 11.2.1 Braun
List of Figures
- Figure 1: Global Touch-Free Forehead Thermometers Revenue Breakdown (million, %) by Region 2024 & 2032
- Figure 2: Global Touch-Free Forehead Thermometers Volume Breakdown (K, %) by Region 2024 & 2032
- Figure 3: North America Touch-Free Forehead Thermometers Revenue (million), by Application 2024 & 2032
- Figure 4: North America Touch-Free Forehead Thermometers Volume (K), by Application 2024 & 2032
- Figure 5: North America Touch-Free Forehead Thermometers Revenue Share (%), by Application 2024 & 2032
- Figure 6: North America Touch-Free Forehead Thermometers Volume Share (%), by Application 2024 & 2032
- Figure 7: North America Touch-Free Forehead Thermometers Revenue (million), by Types 2024 & 2032
- Figure 8: North America Touch-Free Forehead Thermometers Volume (K), by Types 2024 & 2032
- Figure 9: North America Touch-Free Forehead Thermometers Revenue Share (%), by Types 2024 & 2032
- Figure 10: North America Touch-Free Forehead Thermometers Volume Share (%), by Types 2024 & 2032
- Figure 11: North America Touch-Free Forehead Thermometers Revenue (million), by Country 2024 & 2032
- Figure 12: North America Touch-Free Forehead Thermometers Volume (K), by Country 2024 & 2032
- Figure 13: North America Touch-Free Forehead Thermometers Revenue Share (%), by Country 2024 & 2032
- Figure 14: North America Touch-Free Forehead Thermometers Volume Share (%), by Country 2024 & 2032
- Figure 15: South America Touch-Free Forehead Thermometers Revenue (million), by Application 2024 & 2032
- Figure 16: South America Touch-Free Forehead Thermometers Volume (K), by Application 2024 & 2032
- Figure 17: South America Touch-Free Forehead Thermometers Revenue Share (%), by Application 2024 & 2032
- Figure 18: South America Touch-Free Forehead Thermometers Volume Share (%), by Application 2024 & 2032
- Figure 19: South America Touch-Free Forehead Thermometers Revenue (million), by Types 2024 & 2032
- Figure 20: South America Touch-Free Forehead Thermometers Volume (K), by Types 2024 & 2032
- Figure 21: South America Touch-Free Forehead Thermometers Revenue Share (%), by Types 2024 & 2032
- Figure 22: South America Touch-Free Forehead Thermometers Volume Share (%), by Types 2024 & 2032
- Figure 23: South America Touch-Free Forehead Thermometers Revenue (million), by Country 2024 & 2032
- Figure 24: South America Touch-Free Forehead Thermometers Volume (K), by Country 2024 & 2032
- Figure 25: South America Touch-Free Forehead Thermometers Revenue Share (%), by Country 2024 & 2032
- Figure 26: South America Touch-Free Forehead Thermometers Volume Share (%), by Country 2024 & 2032
- Figure 27: Europe Touch-Free Forehead Thermometers Revenue (million), by Application 2024 & 2032
- Figure 28: Europe Touch-Free Forehead Thermometers Volume (K), by Application 2024 & 2032
- Figure 29: Europe Touch-Free Forehead Thermometers Revenue Share (%), by Application 2024 & 2032
- Figure 30: Europe Touch-Free Forehead Thermometers Volume Share (%), by Application 2024 & 2032
- Figure 31: Europe Touch-Free Forehead Thermometers Revenue (million), by Types 2024 & 2032
- Figure 32: Europe Touch-Free Forehead Thermometers Volume (K), by Types 2024 & 2032
- Figure 33: Europe Touch-Free Forehead Thermometers Revenue Share (%), by Types 2024 & 2032
- Figure 34: Europe Touch-Free Forehead Thermometers Volume Share (%), by Types 2024 & 2032
- Figure 35: Europe Touch-Free Forehead Thermometers Revenue (million), by Country 2024 & 2032
- Figure 36: Europe Touch-Free Forehead Thermometers Volume (K), by Country 2024 & 2032
- Figure 37: Europe Touch-Free Forehead Thermometers Revenue Share (%), by Country 2024 & 2032
- Figure 38: Europe Touch-Free Forehead Thermometers Volume Share (%), by Country 2024 & 2032
- Figure 39: Middle East & Africa Touch-Free Forehead Thermometers Revenue (million), by Application 2024 & 2032
- Figure 40: Middle East & Africa Touch-Free Forehead Thermometers Volume (K), by Application 2024 & 2032
- Figure 41: Middle East & Africa Touch-Free Forehead Thermometers Revenue Share (%), by Application 2024 & 2032
- Figure 42: Middle East & Africa Touch-Free Forehead Thermometers Volume Share (%), by Application 2024 & 2032
- Figure 43: Middle East & Africa Touch-Free Forehead Thermometers Revenue (million), by Types 2024 & 2032
- Figure 44: Middle East & Africa Touch-Free Forehead Thermometers Volume (K), by Types 2024 & 2032
- Figure 45: Middle East & Africa Touch-Free Forehead Thermometers Revenue Share (%), by Types 2024 & 2032
- Figure 46: Middle East & Africa Touch-Free Forehead Thermometers Volume Share (%), by Types 2024 & 2032
- Figure 47: Middle East & Africa Touch-Free Forehead Thermometers Revenue (million), by Country 2024 & 2032
- Figure 48: Middle East & Africa Touch-Free Forehead Thermometers Volume (K), by Country 2024 & 2032
- Figure 49: Middle East & Africa Touch-Free Forehead Thermometers Revenue Share (%), by Country 2024 & 2032
- Figure 50: Middle East & Africa Touch-Free Forehead Thermometers Volume Share (%), by Country 2024 & 2032
- Figure 51: Asia Pacific Touch-Free Forehead Thermometers Revenue (million), by Application 2024 & 2032
- Figure 52: Asia Pacific Touch-Free Forehead Thermometers Volume (K), by Application 2024 & 2032
- Figure 53: Asia Pacific Touch-Free Forehead Thermometers Revenue Share (%), by Application 2024 & 2032
- Figure 54: Asia Pacific Touch-Free Forehead Thermometers Volume Share (%), by Application 2024 & 2032
- Figure 55: Asia Pacific Touch-Free Forehead Thermometers Revenue (million), by Types 2024 & 2032
- Figure 56: Asia Pacific Touch-Free Forehead Thermometers Volume (K), by Types 2024 & 2032
- Figure 57: Asia Pacific Touch-Free Forehead Thermometers Revenue Share (%), by Types 2024 & 2032
- Figure 58: Asia Pacific Touch-Free Forehead Thermometers Volume Share (%), by Types 2024 & 2032
- Figure 59: Asia Pacific Touch-Free Forehead Thermometers Revenue (million), by Country 2024 & 2032
- Figure 60: Asia Pacific Touch-Free Forehead Thermometers Volume (K), by Country 2024 & 2032
- Figure 61: Asia Pacific Touch-Free Forehead Thermometers Revenue Share (%), by Country 2024 & 2032
- Figure 62: Asia Pacific Touch-Free Forehead Thermometers Volume Share (%), by Country 2024 & 2032
List of Tables
- Table 1: Global Touch-Free Forehead Thermometers Revenue million Forecast, by Region 2019 & 2032
- Table 2: Global Touch-Free Forehead Thermometers Volume K Forecast, by Region 2019 & 2032
- Table 3: Global Touch-Free Forehead Thermometers Revenue million Forecast, by Application 2019 & 2032
- Table 4: Global Touch-Free Forehead Thermometers Volume K Forecast, by Application 2019 & 2032
- Table 5: Global Touch-Free Forehead Thermometers Revenue million Forecast, by Types 2019 & 2032
- Table 6: Global Touch-Free Forehead Thermometers Volume K Forecast, by Types 2019 & 2032
- Table 7: Global Touch-Free Forehead Thermometers Revenue million Forecast, by Region 2019 & 2032
- Table 8: Global Touch-Free Forehead Thermometers Volume K Forecast, by Region 2019 & 2032
- Table 9: Global Touch-Free Forehead Thermometers Revenue million Forecast, by Application 2019 & 2032
- Table 10: Global Touch-Free Forehead Thermometers Volume K Forecast, by Application 2019 & 2032
- Table 11: Global Touch-Free Forehead Thermometers Revenue million Forecast, by Types 2019 & 2032
- Table 12: Global Touch-Free Forehead Thermometers Volume K Forecast, by Types 2019 & 2032
- Table 13: Global Touch-Free Forehead Thermometers Revenue million Forecast, by Country 2019 & 2032
- Table 14: Global Touch-Free Forehead Thermometers Volume K Forecast, by Country 2019 & 2032
- Table 15: United States Touch-Free Forehead Thermometers Revenue (million) Forecast, by Application 2019 & 2032
- Table 16: United States Touch-Free Forehead Thermometers Volume (K) Forecast, by Application 2019 & 2032
- Table 17: Canada Touch-Free Forehead Thermometers Revenue (million) Forecast, by Application 2019 & 2032
- Table 18: Canada Touch-Free Forehead Thermometers Volume (K) Forecast, by Application 2019 & 2032
- Table 19: Mexico Touch-Free Forehead Thermometers Revenue (million) Forecast, by Application 2019 & 2032
- Table 20: Mexico Touch-Free Forehead Thermometers Volume (K) Forecast, by Application 2019 & 2032
- Table 21: Global Touch-Free Forehead Thermometers Revenue million Forecast, by Application 2019 & 2032
- Table 22: Global Touch-Free Forehead Thermometers Volume K Forecast, by Application 2019 & 2032
- Table 23: Global Touch-Free Forehead Thermometers Revenue million Forecast, by Types 2019 & 2032
- Table 24: Global Touch-Free Forehead Thermometers Volume K Forecast, by Types 2019 & 2032
- Table 25: Global Touch-Free Forehead Thermometers Revenue million Forecast, by Country 2019 & 2032
- Table 26: Global Touch-Free Forehead Thermometers Volume K Forecast, by Country 2019 & 2032
- Table 27: Brazil Touch-Free Forehead Thermometers Revenue (million) Forecast, by Application 2019 & 2032
- Table 28: Brazil Touch-Free Forehead Thermometers Volume (K) Forecast, by Application 2019 & 2032
- Table 29: Argentina Touch-Free Forehead Thermometers Revenue (million) Forecast, by Application 2019 & 2032
- Table 30: Argentina Touch-Free Forehead Thermometers Volume (K) Forecast, by Application 2019 & 2032
- Table 31: Rest of South America Touch-Free Forehead Thermometers Revenue (million) Forecast, by Application 2019 & 2032
- Table 32: Rest of South America Touch-Free Forehead Thermometers Volume (K) Forecast, by Application 2019 & 2032
- Table 33: Global Touch-Free Forehead Thermometers Revenue million Forecast, by Application 2019 & 2032
- Table 34: Global Touch-Free Forehead Thermometers Volume K Forecast, by Application 2019 & 2032
- Table 35: Global Touch-Free Forehead Thermometers Revenue million Forecast, by Types 2019 & 2032
- Table 36: Global Touch-Free Forehead Thermometers Volume K Forecast, by Types 2019 & 2032
- Table 37: Global Touch-Free Forehead Thermometers Revenue million Forecast, by Country 2019 & 2032
- Table 38: Global Touch-Free Forehead Thermometers Volume K Forecast, by Country 2019 & 2032
- Table 39: United Kingdom Touch-Free Forehead Thermometers Revenue (million) Forecast, by Application 2019 & 2032
- Table 40: United Kingdom Touch-Free Forehead Thermometers Volume (K) Forecast, by Application 2019 & 2032
- Table 41: Germany Touch-Free Forehead Thermometers Revenue (million) Forecast, by Application 2019 & 2032
- Table 42: Germany Touch-Free Forehead Thermometers Volume (K) Forecast, by Application 2019 & 2032
- Table 43: France Touch-Free Forehead Thermometers Revenue (million) Forecast, by Application 2019 & 2032
- Table 44: France Touch-Free Forehead Thermometers Volume (K) Forecast, by Application 2019 & 2032
- Table 45: Italy Touch-Free Forehead Thermometers Revenue (million) Forecast, by Application 2019 & 2032
- Table 46: Italy Touch-Free Forehead Thermometers Volume (K) Forecast, by Application 2019 & 2032
- Table 47: Spain Touch-Free Forehead Thermometers Revenue (million) Forecast, by Application 2019 & 2032
- Table 48: Spain Touch-Free Forehead Thermometers Volume (K) Forecast, by Application 2019 & 2032
- Table 49: Russia Touch-Free Forehead Thermometers Revenue (million) Forecast, by Application 2019 & 2032
- Table 50: Russia Touch-Free Forehead Thermometers Volume (K) Forecast, by Application 2019 & 2032
- Table 51: Benelux Touch-Free Forehead Thermometers Revenue (million) Forecast, by Application 2019 & 2032
- Table 52: Benelux Touch-Free Forehead Thermometers Volume (K) Forecast, by Application 2019 & 2032
- Table 53: Nordics Touch-Free Forehead Thermometers Revenue (million) Forecast, by Application 2019 & 2032
- Table 54: Nordics Touch-Free Forehead Thermometers Volume (K) Forecast, by Application 2019 & 2032
- Table 55: Rest of Europe Touch-Free Forehead Thermometers Revenue (million) Forecast, by Application 2019 & 2032
- Table 56: Rest of Europe Touch-Free Forehead Thermometers Volume (K) Forecast, by Application 2019 & 2032
- Table 57: Global Touch-Free Forehead Thermometers Revenue million Forecast, by Application 2019 & 2032
- Table 58: Global Touch-Free Forehead Thermometers Volume K Forecast, by Application 2019 & 2032
- Table 59: Global Touch-Free Forehead Thermometers Revenue million Forecast, by Types 2019 & 2032
- Table 60: Global Touch-Free Forehead Thermometers Volume K Forecast, by Types 2019 & 2032
- Table 61: Global Touch-Free Forehead Thermometers Revenue million Forecast, by Country 2019 & 2032
- Table 62: Global Touch-Free Forehead Thermometers Volume K Forecast, by Country 2019 & 2032
- Table 63: Turkey Touch-Free Forehead Thermometers Revenue (million) Forecast, by Application 2019 & 2032
- Table 64: Turkey Touch-Free Forehead Thermometers Volume (K) Forecast, by Application 2019 & 2032
- Table 65: Israel Touch-Free Forehead Thermometers Revenue (million) Forecast, by Application 2019 & 2032
- Table 66: Israel Touch-Free Forehead Thermometers Volume (K) Forecast, by Application 2019 & 2032
- Table 67: GCC Touch-Free Forehead Thermometers Revenue (million) Forecast, by Application 2019 & 2032
- Table 68: GCC Touch-Free Forehead Thermometers Volume (K) Forecast, by Application 2019 & 2032
- Table 69: North Africa Touch-Free Forehead Thermometers Revenue (million) Forecast, by Application 2019 & 2032
- Table 70: North Africa Touch-Free Forehead Thermometers Volume (K) Forecast, by Application 2019 & 2032
- Table 71: South Africa Touch-Free Forehead Thermometers Revenue (million) Forecast, by Application 2019 & 2032
- Table 72: South Africa Touch-Free Forehead Thermometers Volume (K) Forecast, by Application 2019 & 2032
- Table 73: Rest of Middle East & Africa Touch-Free Forehead Thermometers Revenue (million) Forecast, by Application 2019 & 2032
- Table 74: Rest of Middle East & Africa Touch-Free Forehead Thermometers Volume (K) Forecast, by Application 2019 & 2032
- Table 75: Global Touch-Free Forehead Thermometers Revenue million Forecast, by Application 2019 & 2032
- Table 76: Global Touch-Free Forehead Thermometers Volume K Forecast, by Application 2019 & 2032
- Table 77: Global Touch-Free Forehead Thermometers Revenue million Forecast, by Types 2019 & 2032
- Table 78: Global Touch-Free Forehead Thermometers Volume K Forecast, by Types 2019 & 2032
- Table 79: Global Touch-Free Forehead Thermometers Revenue million Forecast, by Country 2019 & 2032
- Table 80: Global Touch-Free Forehead Thermometers Volume K Forecast, by Country 2019 & 2032
- Table 81: China Touch-Free Forehead Thermometers Revenue (million) Forecast, by Application 2019 & 2032
- Table 82: China Touch-Free Forehead Thermometers Volume (K) Forecast, by Application 2019 & 2032
- Table 83: India Touch-Free Forehead Thermometers Revenue (million) Forecast, by Application 2019 & 2032
- Table 84: India Touch-Free Forehead Thermometers Volume (K) Forecast, by Application 2019 & 2032
- Table 85: Japan Touch-Free Forehead Thermometers Revenue (million) Forecast, by Application 2019 & 2032
- Table 86: Japan Touch-Free Forehead Thermometers Volume (K) Forecast, by Application 2019 & 2032
- Table 87: South Korea Touch-Free Forehead Thermometers Revenue (million) Forecast, by Application 2019 & 2032
- Table 88: South Korea Touch-Free Forehead Thermometers Volume (K) Forecast, by Application 2019 & 2032
- Table 89: ASEAN Touch-Free Forehead Thermometers Revenue (million) Forecast, by Application 2019 & 2032
- Table 90: ASEAN Touch-Free Forehead Thermometers Volume (K) Forecast, by Application 2019 & 2032
- Table 91: Oceania Touch-Free Forehead Thermometers Revenue (million) Forecast, by Application 2019 & 2032
- Table 92: Oceania Touch-Free Forehead Thermometers Volume (K) Forecast, by Application 2019 & 2032
- Table 93: Rest of Asia Pacific Touch-Free Forehead Thermometers Revenue (million) Forecast, by Application 2019 & 2032
- Table 94: Rest of Asia Pacific Touch-Free Forehead Thermometers Volume (K) Forecast, by Application 2019 & 2032
Frequently Asked Questions
1. What is the projected Compound Annual Growth Rate (CAGR) of the Touch-Free Forehead Thermometers?
The projected CAGR is approximately XX%.
2. Which companies are prominent players in the Touch-Free Forehead Thermometers?
Key companies in the market include Braun, Microlife, Radiant, Omron, Exergen Corporation, Hill-Rom, EASYWELL BIOMEDICALS, AViTA, American Diagnostic, Innovo Medical, A&D Medical.
3. What are the main segments of the Touch-Free Forehead Thermometers?
The market segments include Application, Types.
4. Can you provide details about the market size?
The market size is estimated to be USD XXX million as of 2022.
5. What are some drivers contributing to market growth?
N/A
6. What are the notable trends driving market growth?
N/A
7. Are there any restraints impacting market growth?
N/A
8. Can you provide examples of recent developments in the market?
N/A
9. What pricing options are available for accessing the report?
Pricing options include single-user, multi-user, and enterprise licenses priced at USD 4350.00, USD 6525.00, and USD 8700.00 respectively.
10. Is the market size provided in terms of value or volume?
The market size is provided in terms of value, measured in million and volume, measured in K.
11. Are there any specific market keywords associated with the report?
Yes, the market keyword associated with the report is "Touch-Free Forehead Thermometers," which aids in identifying and referencing the specific market segment covered.
12. How do I determine which pricing option suits my needs best?
The pricing options vary based on user requirements and access needs. Individual users may opt for single-user licenses, while businesses requiring broader access may choose multi-user or enterprise licenses for cost-effective access to the report.
13. Are there any additional resources or data provided in the Touch-Free Forehead Thermometers report?
While the report offers comprehensive insights, it's advisable to review the specific contents or supplementary materials provided to ascertain if additional resources or data are available.
14. How can I stay updated on further developments or reports in the Touch-Free Forehead Thermometers?
To stay informed about further developments, trends, and reports in the Touch-Free Forehead Thermometers, consider subscribing to industry newsletters, following relevant companies and organizations, or regularly checking reputable industry news sources and publications.
Methodology
Step 1 - Identification of Relevant Samples Size from Population Database


Step 2 - Approaches for Defining Global Market Size (Value, Volume* & Price*)

Note*: In applicable scenarios
Step 3 - Data Sources
Primary Research
- Web Analytics
- Survey Reports
- Research Institute
- Latest Research Reports
- Opinion Leaders
Secondary Research
- Annual Reports
- White Paper
- Latest Press Release
- Industry Association
- Paid Database
- Investor Presentations

Step 4 - Data Triangulation
Involves using different sources of information in order to increase the validity of a study
These sources are likely to be stakeholders in a program - participants, other researchers, program staff, other community members, and so on.
Then we put all data in single framework & apply various statistical tools to find out the dynamic on the market.
During the analysis stage, feedback from the stakeholder groups would be compared to determine areas of agreement as well as areas of divergence


