
Key Insights
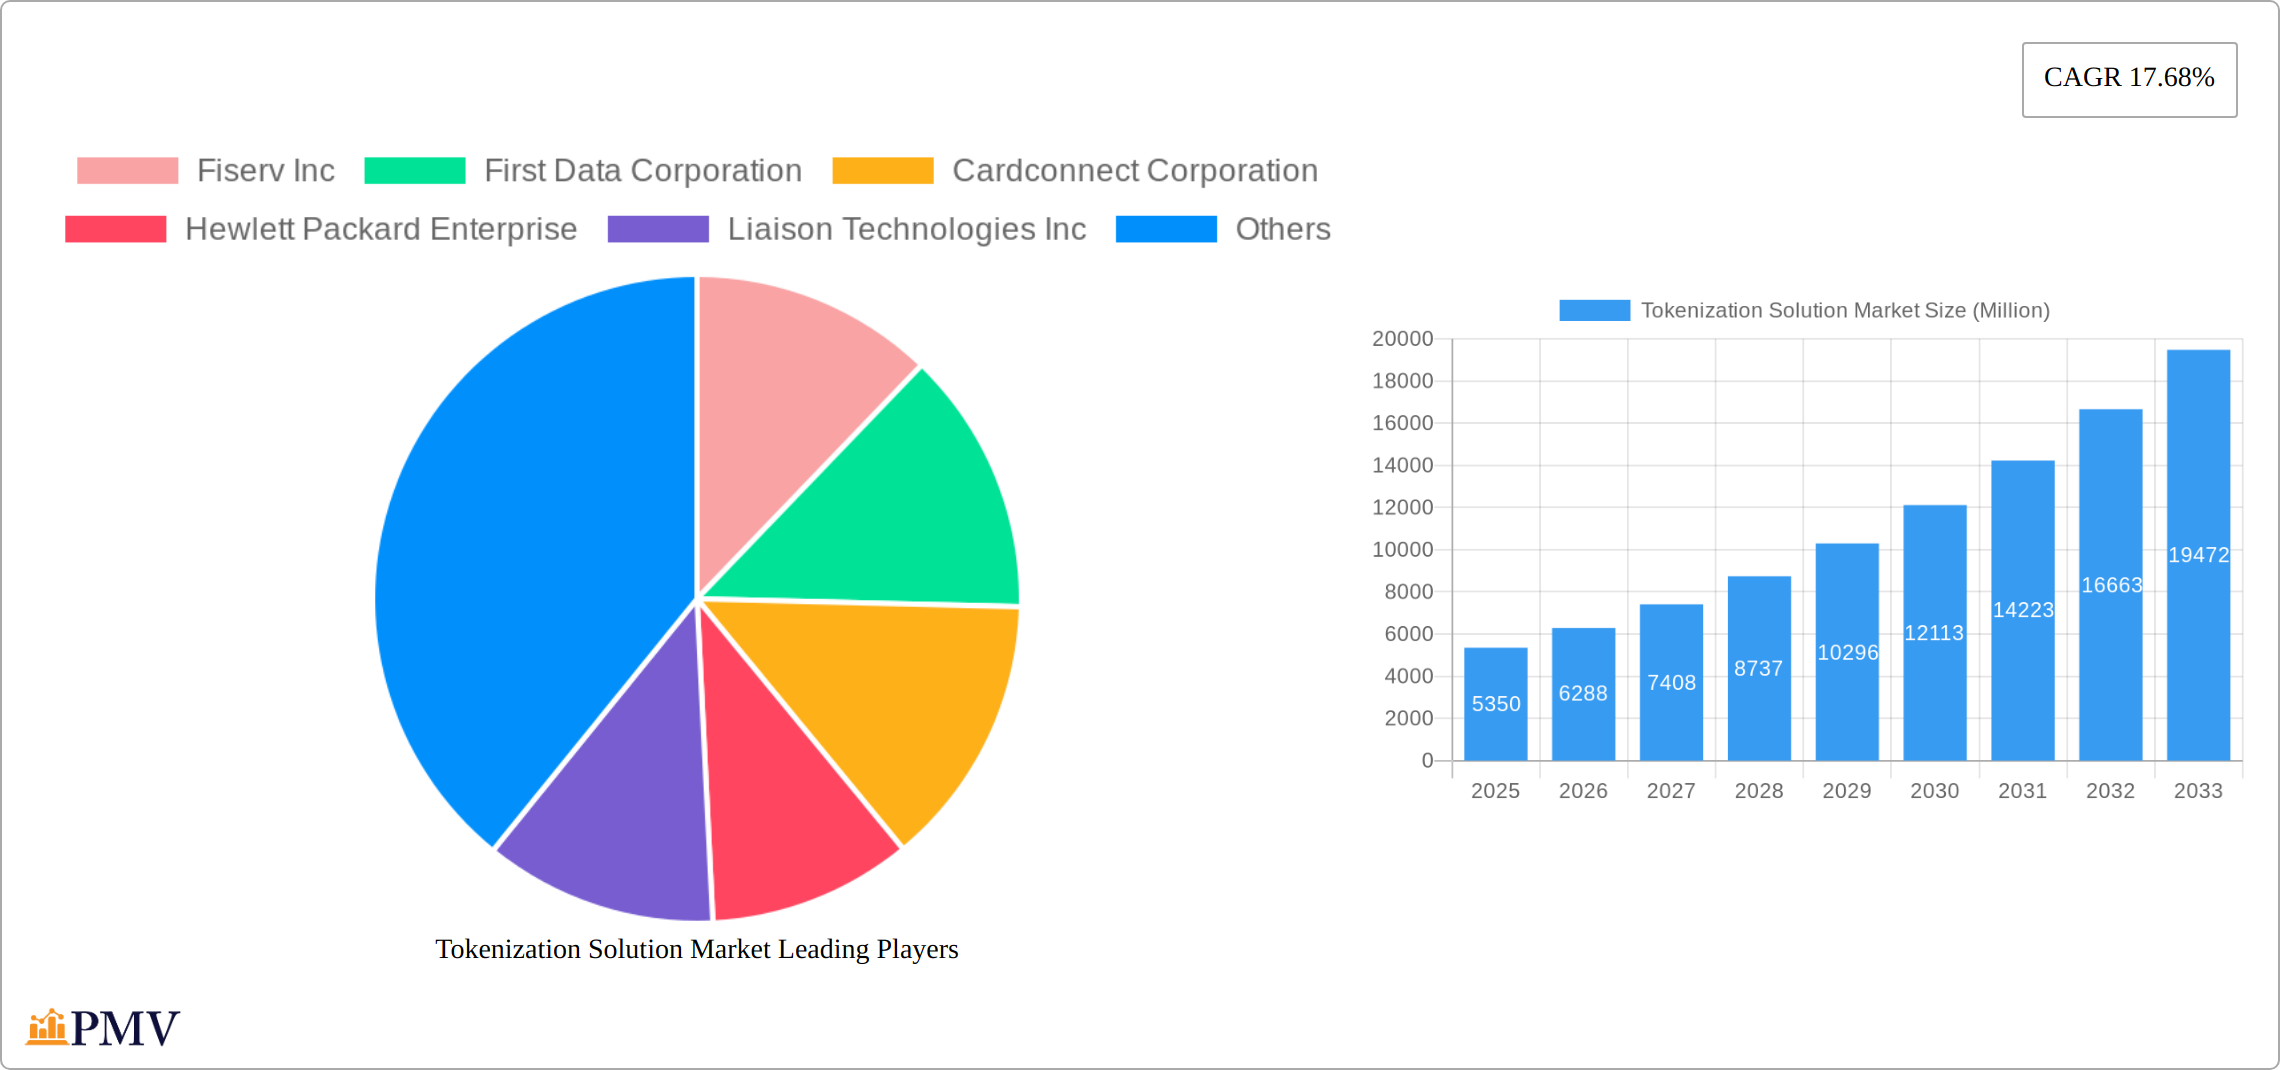
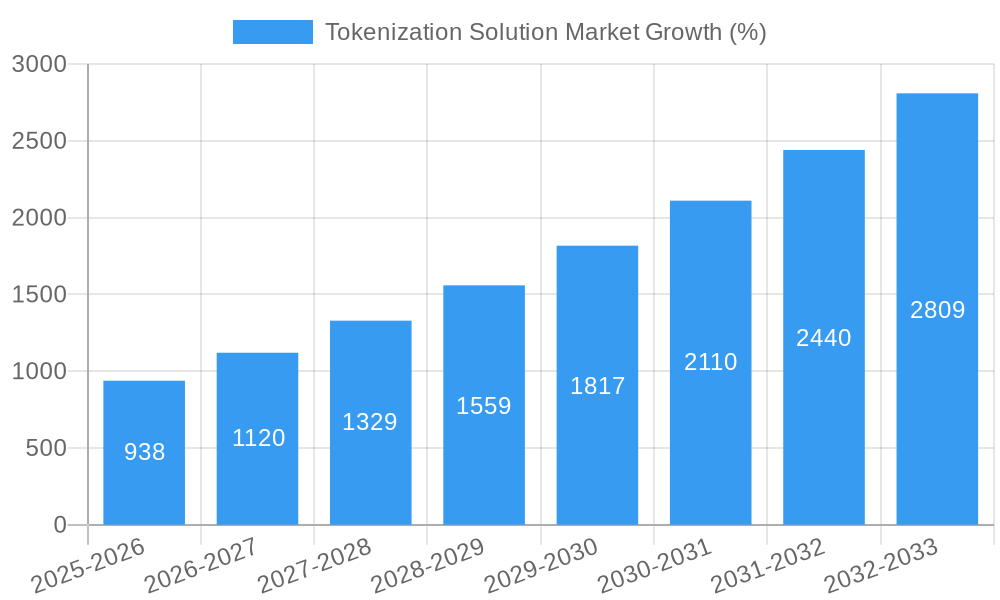
The Tokenization Solution Market is experiencing robust growth, projected to reach $5.35 billion in 2025 and maintain a Compound Annual Growth Rate (CAGR) of 17.68% from 2025 to 2033. This expansion is driven by several key factors. Increasing concerns over data breaches and the rising adoption of cloud computing are fueling demand for secure data management solutions. The stringent regulatory environment surrounding data privacy, particularly GDPR and CCPA, is further compelling organizations across various sectors to adopt tokenization as a robust security measure. The market's segmentation reveals strong growth across diverse end-user industries, with Retail & E-commerce, BFSI (Banking, Financial Services, and Insurance), and IT & Telecommunications sectors leading the charge. The preference for cloud-based deployment models is also contributing significantly to market expansion, owing to their scalability, cost-effectiveness, and accessibility. The competitive landscape comprises a mix of established players like Fiserv, First Data, and Thales, alongside emerging technology providers, indicating a dynamic and innovative market.
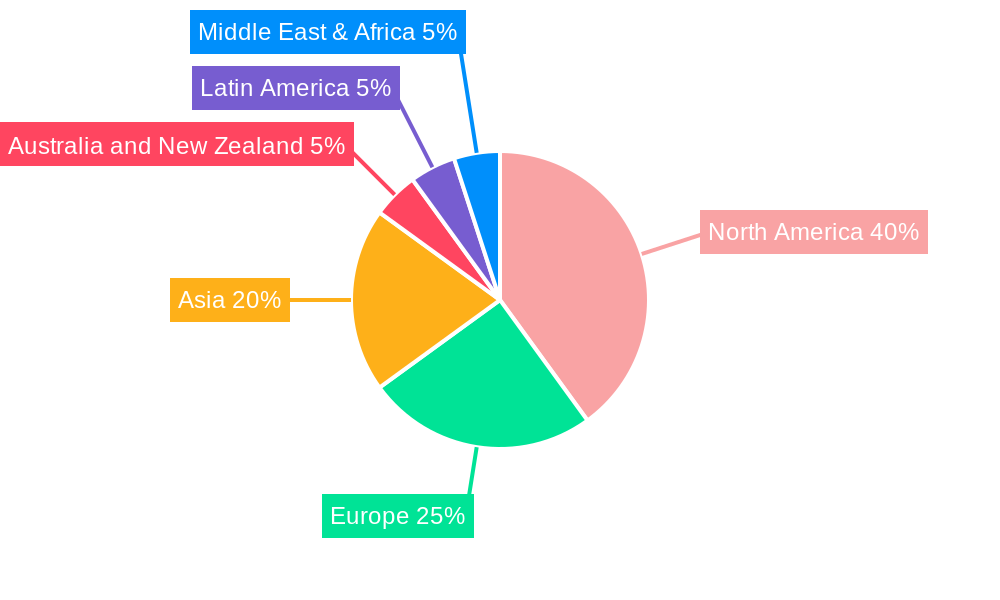
Continued growth is anticipated due to the increasing adoption of digital transactions and the expansion of the Internet of Things (IoT). The growing need for secure payment processing and the emergence of new technologies like blockchain are expected to further propel market growth. While challenges such as the complexity of implementation and the need for skilled professionals exist, the overall market outlook remains positive. The significant investment in cybersecurity infrastructure and the ongoing development of more sophisticated tokenization solutions will alleviate these challenges and maintain the market's upward trajectory. Regional analysis suggests North America will continue to dominate the market due to early adoption and robust regulatory frameworks. However, significant growth potential exists in regions like Asia-Pacific, driven by increasing digitalization and a rising number of internet users.
Tokenization Solution Market: A Comprehensive Report (2019-2033)
This in-depth report provides a comprehensive analysis of the Tokenization Solution Market, covering market size, growth drivers, competitive landscape, and future outlook. The study period spans from 2019 to 2033, with 2025 serving as the base and estimated year. The forecast period is 2025-2033, and the historical period is 2019-2024. This report is invaluable for investors, businesses, and stakeholders seeking to understand and capitalize on the opportunities within this rapidly evolving market.
Tokenization Solution Market Structure & Competitive Dynamics
The Tokenization Solution Market is characterized by a moderately concentrated landscape with several key players vying for market share. The market exhibits a dynamic interplay between established players and emerging startups, fostering a competitive innovation ecosystem. Regulatory frameworks, still evolving in many jurisdictions, significantly impact market expansion and adoption. Product substitutes, such as traditional security mechanisms, pose a challenge, particularly in sectors with stringent compliance requirements. End-user trends towards enhanced security and streamlined processes are driving market growth. Furthermore, M&A activities are reshaping the competitive landscape, with larger players seeking to expand their capabilities and market reach. Deal values in recent years have shown a xx Million upward trend, reflecting the increasing strategic importance of tokenization solutions.
- Market Concentration: xx% of the market is currently held by the top 5 players.
- Innovation Ecosystems: Significant innovation is driven by blockchain technology advancements and the development of new security protocols.
- Regulatory Frameworks: Varying regulations across geographies impact adoption rates and create complexities for businesses.
- M&A Activities: xx major M&A deals were recorded in the past five years, with an average deal value of xx Million.
Tokenization Solution Market Industry Trends & Insights
The Tokenization Solution Market is experiencing robust growth, driven by several key factors. The increasing adoption of digital transformation initiatives across various sectors, coupled with heightened concerns around data security and privacy, is significantly fueling demand. Technological advancements in blockchain, cryptography, and distributed ledger technologies (DLT) are enhancing the efficiency and security of tokenization solutions. Consumer preferences are shifting towards secure and transparent digital transactions, further stimulating market expansion. The market is also witnessing increasing competition, with both established technology companies and specialized startups vying for market share.
The Compound Annual Growth Rate (CAGR) for the Tokenization Solution Market is projected to be xx% during the forecast period (2025-2033). Market penetration is steadily increasing across various industry verticals, with BFSI and Healthcare exhibiting particularly strong adoption rates.
Dominant Markets & Segments in Tokenization Solution Market
The North American region currently holds the dominant position in the Tokenization Solution Market, driven by high technology adoption rates, strong regulatory support in specific sectors, and a well-established digital economy. Within the market segments, the Solutions segment holds a larger market share compared to Services, reflecting the demand for comprehensive platforms and integrated solutions. Cloud deployment is experiencing higher growth than On-Premise, highlighting the preference for scalable and cost-effective solutions.
- Leading Region: North America
- Dominant Segment (By Type): Solutions
- Dominant Segment (By Deployment): Cloud
Key Drivers:
- Retail & E-commerce: Growing online transactions and the need for secure payment processing.
- BFSI: High demand for secure and efficient digital financial services and regulatory compliance.
- IT & Telecommunications: Increasing adoption of cloud computing and the need for secure data management.
- Economic Policies: Government initiatives promoting digitalization and blockchain technology adoption.
- Infrastructure: Investment in robust digital infrastructure supporting secure transactions.
Tokenization Solution Market Product Innovations
Recent advancements in tokenization solutions include the development of more sophisticated security protocols, enhanced interoperability between different blockchain platforms, and the integration of AI-powered functionalities for fraud detection and risk management. These innovations are addressing key market needs, such as improving the scalability, security, and usability of tokenization solutions, leading to greater market adoption across diverse industries. The focus is shifting towards user-friendly interfaces and streamlined integration with existing systems.
Report Segmentation & Scope
The Tokenization Solution Market is segmented by Type (Solutions and Services), Deployment (On-Premise and Cloud), and End-User Industry (Retail & E-commerce, Transportation & Logistics, BFSI, IT & Telecommunications, Healthcare, Government, Energy & Utilities, and Other End-User Industries). Each segment exhibits unique growth trajectories and competitive dynamics. For example, the BFSI segment is expected to witness significant growth driven by regulatory compliance needs, while the Healthcare segment's growth is fueled by data security and privacy concerns. The cloud deployment segment is projected to outpace the on-premise segment due to its scalability and cost-effectiveness. Market size projections for each segment are provided in the full report.
Key Drivers of Tokenization Solution Market Growth
The Tokenization Solution Market is propelled by several key factors: the increasing need for enhanced data security and privacy, the growing adoption of blockchain technology, the rising demand for efficient and transparent transactions, and the supportive regulatory environment in several key regions. These drivers are collectively boosting market growth and expanding the application of tokenization across numerous industries.
Challenges in the Tokenization Solution Market Sector
Despite the significant growth potential, the Tokenization Solution Market faces several challenges. These include the complexity of regulatory landscapes across different jurisdictions, which can hinder widespread adoption. Furthermore, the interoperability issues between different blockchain platforms and the need for skilled professionals pose obstacles to market expansion. Competition among established players and emerging startups also impacts market dynamics. Estimates suggest that these challenges could potentially impact market growth by xx% in the next five years.
Leading Players in the Tokenization Solution Market
- Fiserv Inc
- First Data Corporation
- Cardconnect Corporation
- Hewlett Packard Enterprise
- Liaison Technologies Inc
- Thales Group
- Ciphercloud Incorporation
- Broadcom Inc
- Paymetric Inc (A Worldpay Company)
- Cybersource Corporation
- Protegrity USA Inc
- 3delta Systems Inc
- Tokenex LLC
Key Developments in Tokenization Solution Market Sector
- May 2023: EY launched EY OpsChain ESG, a blockchain-based solution for carbon footprint management using tokenization for enhanced transparency.
- April 2022: Newrl introduced tokenized equity alternatives for unlisted firms in India, a first-of-its-kind Web3 innovation for ESOP solutions.
Strategic Tokenization Solution Market Outlook
The future of the Tokenization Solution Market is promising, with significant growth potential driven by ongoing technological advancements and increasing industry adoption. Strategic opportunities exist for companies that can develop innovative and user-friendly solutions addressing the specific needs of diverse industries. The focus on interoperability, enhanced security, and regulatory compliance will be key determinants of market success in the years to come. The market is poised for substantial expansion, driven by the increasing integration of tokenization into various business processes and the emergence of new use cases.
Tokenization Solution Market Segmentation
-
1. Type
- 1.1. Solutions
- 1.2. Services
-
2. Deployment
- 2.1. On-Premise
- 2.2. Cloud
-
3. End-User Industry
- 3.1. Retail & E-commerce
- 3.2. Transportation & Logistics
- 3.3. BFSI
- 3.4. IT & Telecommunications
- 3.5. Healthcare
- 3.6. Government
- 3.7. Energy & Utilities
- 3.8. Other End-User Industries
Tokenization Solution Market Segmentation By Geography
-
1. North America
- 1.1. United States
- 1.2. Canada
-
2. Europe
- 2.1. United Kingdom
- 2.2. Germany
- 2.3. France
-
3. Asia
- 3.1. China
- 3.2. India
- 4. Australia and New Zealand
-
5. Latin America
- 5.1. Brazil
- 5.2. Mexico
- 5.3. Argentina
- 6. Middle East
-
7. United Arab Emirates
- 7.1. Saudi Arabia
- 7.2. South Africa
Tokenization Solution Market REPORT HIGHLIGHTS
| Aspects | Details |
|---|---|
| Study Period | 2019-2033 |
| Base Year | 2024 |
| Estimated Year | 2025 |
| Forecast Period | 2025-2033 |
| Historical Period | 2019-2024 |
| Growth Rate | CAGR of 17.68% from 2019-2033 |
| Segmentation |
|
Table of Contents
- 1. Introduction
- 1.1. Research Scope
- 1.2. Market Segmentation
- 1.3. Research Methodology
- 1.4. Definitions and Assumptions
- 2. Executive Summary
- 2.1. Introduction
- 3. Market Dynamics
- 3.1. Introduction
- 3.2. Market Drivers
- 3.2.1. Growing Demand for Secure Payment Gateways; Rising Adoption in E-commerce and Mobile payments; Growing Government Regulations On Data Security
- 3.3. Market Restrains
- 3.3.1. Addressing Vulnerabilities From EMV Standards; Lack of Awareness Due to Similar Products
- 3.4. Market Trends
- 3.4.1. BFSI to hold the largest market size
- 4. Market Factor Analysis
- 4.1. Porters Five Forces
- 4.2. Supply/Value Chain
- 4.3. PESTEL analysis
- 4.4. Market Entropy
- 4.5. Patent/Trademark Analysis
- 5. Global Tokenization Solution Market Analysis, Insights and Forecast, 2019-2031
- 5.1. Market Analysis, Insights and Forecast - by Type
- 5.1.1. Solutions
- 5.1.2. Services
- 5.2. Market Analysis, Insights and Forecast - by Deployment
- 5.2.1. On-Premise
- 5.2.2. Cloud
- 5.3. Market Analysis, Insights and Forecast - by End-User Industry
- 5.3.1. Retail & E-commerce
- 5.3.2. Transportation & Logistics
- 5.3.3. BFSI
- 5.3.4. IT & Telecommunications
- 5.3.5. Healthcare
- 5.3.6. Government
- 5.3.7. Energy & Utilities
- 5.3.8. Other End-User Industries
- 5.4. Market Analysis, Insights and Forecast - by Region
- 5.4.1. North America
- 5.4.2. Europe
- 5.4.3. Asia
- 5.4.4. Australia and New Zealand
- 5.4.5. Latin America
- 5.4.6. Middle East
- 5.4.7. United Arab Emirates
- 5.1. Market Analysis, Insights and Forecast - by Type
- 6. North America Tokenization Solution Market Analysis, Insights and Forecast, 2019-2031
- 6.1. Market Analysis, Insights and Forecast - by Type
- 6.1.1. Solutions
- 6.1.2. Services
- 6.2. Market Analysis, Insights and Forecast - by Deployment
- 6.2.1. On-Premise
- 6.2.2. Cloud
- 6.3. Market Analysis, Insights and Forecast - by End-User Industry
- 6.3.1. Retail & E-commerce
- 6.3.2. Transportation & Logistics
- 6.3.3. BFSI
- 6.3.4. IT & Telecommunications
- 6.3.5. Healthcare
- 6.3.6. Government
- 6.3.7. Energy & Utilities
- 6.3.8. Other End-User Industries
- 6.1. Market Analysis, Insights and Forecast - by Type
- 7. Europe Tokenization Solution Market Analysis, Insights and Forecast, 2019-2031
- 7.1. Market Analysis, Insights and Forecast - by Type
- 7.1.1. Solutions
- 7.1.2. Services
- 7.2. Market Analysis, Insights and Forecast - by Deployment
- 7.2.1. On-Premise
- 7.2.2. Cloud
- 7.3. Market Analysis, Insights and Forecast - by End-User Industry
- 7.3.1. Retail & E-commerce
- 7.3.2. Transportation & Logistics
- 7.3.3. BFSI
- 7.3.4. IT & Telecommunications
- 7.3.5. Healthcare
- 7.3.6. Government
- 7.3.7. Energy & Utilities
- 7.3.8. Other End-User Industries
- 7.1. Market Analysis, Insights and Forecast - by Type
- 8. Asia Tokenization Solution Market Analysis, Insights and Forecast, 2019-2031
- 8.1. Market Analysis, Insights and Forecast - by Type
- 8.1.1. Solutions
- 8.1.2. Services
- 8.2. Market Analysis, Insights and Forecast - by Deployment
- 8.2.1. On-Premise
- 8.2.2. Cloud
- 8.3. Market Analysis, Insights and Forecast - by End-User Industry
- 8.3.1. Retail & E-commerce
- 8.3.2. Transportation & Logistics
- 8.3.3. BFSI
- 8.3.4. IT & Telecommunications
- 8.3.5. Healthcare
- 8.3.6. Government
- 8.3.7. Energy & Utilities
- 8.3.8. Other End-User Industries
- 8.1. Market Analysis, Insights and Forecast - by Type
- 9. Australia and New Zealand Tokenization Solution Market Analysis, Insights and Forecast, 2019-2031
- 9.1. Market Analysis, Insights and Forecast - by Type
- 9.1.1. Solutions
- 9.1.2. Services
- 9.2. Market Analysis, Insights and Forecast - by Deployment
- 9.2.1. On-Premise
- 9.2.2. Cloud
- 9.3. Market Analysis, Insights and Forecast - by End-User Industry
- 9.3.1. Retail & E-commerce
- 9.3.2. Transportation & Logistics
- 9.3.3. BFSI
- 9.3.4. IT & Telecommunications
- 9.3.5. Healthcare
- 9.3.6. Government
- 9.3.7. Energy & Utilities
- 9.3.8. Other End-User Industries
- 9.1. Market Analysis, Insights and Forecast - by Type
- 10. Latin America Tokenization Solution Market Analysis, Insights and Forecast, 2019-2031
- 10.1. Market Analysis, Insights and Forecast - by Type
- 10.1.1. Solutions
- 10.1.2. Services
- 10.2. Market Analysis, Insights and Forecast - by Deployment
- 10.2.1. On-Premise
- 10.2.2. Cloud
- 10.3. Market Analysis, Insights and Forecast - by End-User Industry
- 10.3.1. Retail & E-commerce
- 10.3.2. Transportation & Logistics
- 10.3.3. BFSI
- 10.3.4. IT & Telecommunications
- 10.3.5. Healthcare
- 10.3.6. Government
- 10.3.7. Energy & Utilities
- 10.3.8. Other End-User Industries
- 10.1. Market Analysis, Insights and Forecast - by Type
- 11. Middle East Tokenization Solution Market Analysis, Insights and Forecast, 2019-2031
- 11.1. Market Analysis, Insights and Forecast - by Type
- 11.1.1. Solutions
- 11.1.2. Services
- 11.2. Market Analysis, Insights and Forecast - by Deployment
- 11.2.1. On-Premise
- 11.2.2. Cloud
- 11.3. Market Analysis, Insights and Forecast - by End-User Industry
- 11.3.1. Retail & E-commerce
- 11.3.2. Transportation & Logistics
- 11.3.3. BFSI
- 11.3.4. IT & Telecommunications
- 11.3.5. Healthcare
- 11.3.6. Government
- 11.3.7. Energy & Utilities
- 11.3.8. Other End-User Industries
- 11.1. Market Analysis, Insights and Forecast - by Type
- 12. United Arab Emirates Tokenization Solution Market Analysis, Insights and Forecast, 2019-2031
- 12.1. Market Analysis, Insights and Forecast - by Type
- 12.1.1. Solutions
- 12.1.2. Services
- 12.2. Market Analysis, Insights and Forecast - by Deployment
- 12.2.1. On-Premise
- 12.2.2. Cloud
- 12.3. Market Analysis, Insights and Forecast - by End-User Industry
- 12.3.1. Retail & E-commerce
- 12.3.2. Transportation & Logistics
- 12.3.3. BFSI
- 12.3.4. IT & Telecommunications
- 12.3.5. Healthcare
- 12.3.6. Government
- 12.3.7. Energy & Utilities
- 12.3.8. Other End-User Industries
- 12.1. Market Analysis, Insights and Forecast - by Type
- 13. North America Tokenization Solution Market Analysis, Insights and Forecast, 2019-2031
- 13.1. Market Analysis, Insights and Forecast - By Country/Sub-region
- 13.1.1 United States
- 13.1.2 Canada
- 14. Europe Tokenization Solution Market Analysis, Insights and Forecast, 2019-2031
- 14.1. Market Analysis, Insights and Forecast - By Country/Sub-region
- 14.1.1 United Kingdom
- 14.1.2 Germany
- 14.1.3 France
- 15. Asia Tokenization Solution Market Analysis, Insights and Forecast, 2019-2031
- 15.1. Market Analysis, Insights and Forecast - By Country/Sub-region
- 15.1.1 China
- 15.1.2 India
- 16. Australia and New Zealand Tokenization Solution Market Analysis, Insights and Forecast, 2019-2031
- 16.1. Market Analysis, Insights and Forecast - By Country/Sub-region
- 16.1.1.
- 17. Latin America Tokenization Solution Market Analysis, Insights and Forecast, 2019-2031
- 17.1. Market Analysis, Insights and Forecast - By Country/Sub-region
- 17.1.1 Brazil
- 17.1.2 Mexico
- 17.1.3 Argentina
- 18. Middle East Tokenization Solution Market Analysis, Insights and Forecast, 2019-2031
- 18.1. Market Analysis, Insights and Forecast - By Country/Sub-region
- 18.1.1.
- 19. United Arab Emirates Tokenization Solution Market Analysis, Insights and Forecast, 2019-2031
- 19.1. Market Analysis, Insights and Forecast - By Country/Sub-region
- 19.1.1 Saudi Arabia
- 19.1.2 South Africa
- 20. Competitive Analysis
- 20.1. Global Market Share Analysis 2024
- 20.2. Company Profiles
- 20.2.1 Fiserv Inc
- 20.2.1.1. Overview
- 20.2.1.2. Products
- 20.2.1.3. SWOT Analysis
- 20.2.1.4. Recent Developments
- 20.2.1.5. Financials (Based on Availability)
- 20.2.2 First Data Corporation
- 20.2.2.1. Overview
- 20.2.2.2. Products
- 20.2.2.3. SWOT Analysis
- 20.2.2.4. Recent Developments
- 20.2.2.5. Financials (Based on Availability)
- 20.2.3 Cardconnect Corporation
- 20.2.3.1. Overview
- 20.2.3.2. Products
- 20.2.3.3. SWOT Analysis
- 20.2.3.4. Recent Developments
- 20.2.3.5. Financials (Based on Availability)
- 20.2.4 Hewlett Packard Enterprise
- 20.2.4.1. Overview
- 20.2.4.2. Products
- 20.2.4.3. SWOT Analysis
- 20.2.4.4. Recent Developments
- 20.2.4.5. Financials (Based on Availability)
- 20.2.5 Liaison Technologies Inc
- 20.2.5.1. Overview
- 20.2.5.2. Products
- 20.2.5.3. SWOT Analysis
- 20.2.5.4. Recent Developments
- 20.2.5.5. Financials (Based on Availability)
- 20.2.6 Thales Group
- 20.2.6.1. Overview
- 20.2.6.2. Products
- 20.2.6.3. SWOT Analysis
- 20.2.6.4. Recent Developments
- 20.2.6.5. Financials (Based on Availability)
- 20.2.7 Ciphercloud Incorporation
- 20.2.7.1. Overview
- 20.2.7.2. Products
- 20.2.7.3. SWOT Analysis
- 20.2.7.4. Recent Developments
- 20.2.7.5. Financials (Based on Availability)
- 20.2.8 Broadcom Inc
- 20.2.8.1. Overview
- 20.2.8.2. Products
- 20.2.8.3. SWOT Analysis
- 20.2.8.4. Recent Developments
- 20.2.8.5. Financials (Based on Availability)
- 20.2.9 Paymetric Inc (A Worldpay Company)
- 20.2.9.1. Overview
- 20.2.9.2. Products
- 20.2.9.3. SWOT Analysis
- 20.2.9.4. Recent Developments
- 20.2.9.5. Financials (Based on Availability)
- 20.2.10 Cybersource Corporation
- 20.2.10.1. Overview
- 20.2.10.2. Products
- 20.2.10.3. SWOT Analysis
- 20.2.10.4. Recent Developments
- 20.2.10.5. Financials (Based on Availability)
- 20.2.11 Protegrity USA Inc
- 20.2.11.1. Overview
- 20.2.11.2. Products
- 20.2.11.3. SWOT Analysis
- 20.2.11.4. Recent Developments
- 20.2.11.5. Financials (Based on Availability)
- 20.2.12 3delta Systems Inc
- 20.2.12.1. Overview
- 20.2.12.2. Products
- 20.2.12.3. SWOT Analysis
- 20.2.12.4. Recent Developments
- 20.2.12.5. Financials (Based on Availability)
- 20.2.13 Tokenex LLC*List Not Exhaustive
- 20.2.13.1. Overview
- 20.2.13.2. Products
- 20.2.13.3. SWOT Analysis
- 20.2.13.4. Recent Developments
- 20.2.13.5. Financials (Based on Availability)
- 20.2.1 Fiserv Inc
List of Figures
- Figure 1: Global Tokenization Solution Market Revenue Breakdown (Million, %) by Region 2024 & 2032
- Figure 2: North America Tokenization Solution Market Revenue (Million), by Country 2024 & 2032
- Figure 3: North America Tokenization Solution Market Revenue Share (%), by Country 2024 & 2032
- Figure 4: Europe Tokenization Solution Market Revenue (Million), by Country 2024 & 2032
- Figure 5: Europe Tokenization Solution Market Revenue Share (%), by Country 2024 & 2032
- Figure 6: Asia Tokenization Solution Market Revenue (Million), by Country 2024 & 2032
- Figure 7: Asia Tokenization Solution Market Revenue Share (%), by Country 2024 & 2032
- Figure 8: Australia and New Zealand Tokenization Solution Market Revenue (Million), by Country 2024 & 2032
- Figure 9: Australia and New Zealand Tokenization Solution Market Revenue Share (%), by Country 2024 & 2032
- Figure 10: Latin America Tokenization Solution Market Revenue (Million), by Country 2024 & 2032
- Figure 11: Latin America Tokenization Solution Market Revenue Share (%), by Country 2024 & 2032
- Figure 12: Middle East Tokenization Solution Market Revenue (Million), by Country 2024 & 2032
- Figure 13: Middle East Tokenization Solution Market Revenue Share (%), by Country 2024 & 2032
- Figure 14: United Arab Emirates Tokenization Solution Market Revenue (Million), by Country 2024 & 2032
- Figure 15: United Arab Emirates Tokenization Solution Market Revenue Share (%), by Country 2024 & 2032
- Figure 16: North America Tokenization Solution Market Revenue (Million), by Type 2024 & 2032
- Figure 17: North America Tokenization Solution Market Revenue Share (%), by Type 2024 & 2032
- Figure 18: North America Tokenization Solution Market Revenue (Million), by Deployment 2024 & 2032
- Figure 19: North America Tokenization Solution Market Revenue Share (%), by Deployment 2024 & 2032
- Figure 20: North America Tokenization Solution Market Revenue (Million), by End-User Industry 2024 & 2032
- Figure 21: North America Tokenization Solution Market Revenue Share (%), by End-User Industry 2024 & 2032
- Figure 22: North America Tokenization Solution Market Revenue (Million), by Country 2024 & 2032
- Figure 23: North America Tokenization Solution Market Revenue Share (%), by Country 2024 & 2032
- Figure 24: Europe Tokenization Solution Market Revenue (Million), by Type 2024 & 2032
- Figure 25: Europe Tokenization Solution Market Revenue Share (%), by Type 2024 & 2032
- Figure 26: Europe Tokenization Solution Market Revenue (Million), by Deployment 2024 & 2032
- Figure 27: Europe Tokenization Solution Market Revenue Share (%), by Deployment 2024 & 2032
- Figure 28: Europe Tokenization Solution Market Revenue (Million), by End-User Industry 2024 & 2032
- Figure 29: Europe Tokenization Solution Market Revenue Share (%), by End-User Industry 2024 & 2032
- Figure 30: Europe Tokenization Solution Market Revenue (Million), by Country 2024 & 2032
- Figure 31: Europe Tokenization Solution Market Revenue Share (%), by Country 2024 & 2032
- Figure 32: Asia Tokenization Solution Market Revenue (Million), by Type 2024 & 2032
- Figure 33: Asia Tokenization Solution Market Revenue Share (%), by Type 2024 & 2032
- Figure 34: Asia Tokenization Solution Market Revenue (Million), by Deployment 2024 & 2032
- Figure 35: Asia Tokenization Solution Market Revenue Share (%), by Deployment 2024 & 2032
- Figure 36: Asia Tokenization Solution Market Revenue (Million), by End-User Industry 2024 & 2032
- Figure 37: Asia Tokenization Solution Market Revenue Share (%), by End-User Industry 2024 & 2032
- Figure 38: Asia Tokenization Solution Market Revenue (Million), by Country 2024 & 2032
- Figure 39: Asia Tokenization Solution Market Revenue Share (%), by Country 2024 & 2032
- Figure 40: Australia and New Zealand Tokenization Solution Market Revenue (Million), by Type 2024 & 2032
- Figure 41: Australia and New Zealand Tokenization Solution Market Revenue Share (%), by Type 2024 & 2032
- Figure 42: Australia and New Zealand Tokenization Solution Market Revenue (Million), by Deployment 2024 & 2032
- Figure 43: Australia and New Zealand Tokenization Solution Market Revenue Share (%), by Deployment 2024 & 2032
- Figure 44: Australia and New Zealand Tokenization Solution Market Revenue (Million), by End-User Industry 2024 & 2032
- Figure 45: Australia and New Zealand Tokenization Solution Market Revenue Share (%), by End-User Industry 2024 & 2032
- Figure 46: Australia and New Zealand Tokenization Solution Market Revenue (Million), by Country 2024 & 2032
- Figure 47: Australia and New Zealand Tokenization Solution Market Revenue Share (%), by Country 2024 & 2032
- Figure 48: Latin America Tokenization Solution Market Revenue (Million), by Type 2024 & 2032
- Figure 49: Latin America Tokenization Solution Market Revenue Share (%), by Type 2024 & 2032
- Figure 50: Latin America Tokenization Solution Market Revenue (Million), by Deployment 2024 & 2032
- Figure 51: Latin America Tokenization Solution Market Revenue Share (%), by Deployment 2024 & 2032
- Figure 52: Latin America Tokenization Solution Market Revenue (Million), by End-User Industry 2024 & 2032
- Figure 53: Latin America Tokenization Solution Market Revenue Share (%), by End-User Industry 2024 & 2032
- Figure 54: Latin America Tokenization Solution Market Revenue (Million), by Country 2024 & 2032
- Figure 55: Latin America Tokenization Solution Market Revenue Share (%), by Country 2024 & 2032
- Figure 56: Middle East Tokenization Solution Market Revenue (Million), by Type 2024 & 2032
- Figure 57: Middle East Tokenization Solution Market Revenue Share (%), by Type 2024 & 2032
- Figure 58: Middle East Tokenization Solution Market Revenue (Million), by Deployment 2024 & 2032
- Figure 59: Middle East Tokenization Solution Market Revenue Share (%), by Deployment 2024 & 2032
- Figure 60: Middle East Tokenization Solution Market Revenue (Million), by End-User Industry 2024 & 2032
- Figure 61: Middle East Tokenization Solution Market Revenue Share (%), by End-User Industry 2024 & 2032
- Figure 62: Middle East Tokenization Solution Market Revenue (Million), by Country 2024 & 2032
- Figure 63: Middle East Tokenization Solution Market Revenue Share (%), by Country 2024 & 2032
- Figure 64: United Arab Emirates Tokenization Solution Market Revenue (Million), by Type 2024 & 2032
- Figure 65: United Arab Emirates Tokenization Solution Market Revenue Share (%), by Type 2024 & 2032
- Figure 66: United Arab Emirates Tokenization Solution Market Revenue (Million), by Deployment 2024 & 2032
- Figure 67: United Arab Emirates Tokenization Solution Market Revenue Share (%), by Deployment 2024 & 2032
- Figure 68: United Arab Emirates Tokenization Solution Market Revenue (Million), by End-User Industry 2024 & 2032
- Figure 69: United Arab Emirates Tokenization Solution Market Revenue Share (%), by End-User Industry 2024 & 2032
- Figure 70: United Arab Emirates Tokenization Solution Market Revenue (Million), by Country 2024 & 2032
- Figure 71: United Arab Emirates Tokenization Solution Market Revenue Share (%), by Country 2024 & 2032
List of Tables
- Table 1: Global Tokenization Solution Market Revenue Million Forecast, by Region 2019 & 2032
- Table 2: Global Tokenization Solution Market Revenue Million Forecast, by Type 2019 & 2032
- Table 3: Global Tokenization Solution Market Revenue Million Forecast, by Deployment 2019 & 2032
- Table 4: Global Tokenization Solution Market Revenue Million Forecast, by End-User Industry 2019 & 2032
- Table 5: Global Tokenization Solution Market Revenue Million Forecast, by Region 2019 & 2032
- Table 6: Global Tokenization Solution Market Revenue Million Forecast, by Country 2019 & 2032
- Table 7: United States Tokenization Solution Market Revenue (Million) Forecast, by Application 2019 & 2032
- Table 8: Canada Tokenization Solution Market Revenue (Million) Forecast, by Application 2019 & 2032
- Table 9: Global Tokenization Solution Market Revenue Million Forecast, by Country 2019 & 2032
- Table 10: United Kingdom Tokenization Solution Market Revenue (Million) Forecast, by Application 2019 & 2032
- Table 11: Germany Tokenization Solution Market Revenue (Million) Forecast, by Application 2019 & 2032
- Table 12: France Tokenization Solution Market Revenue (Million) Forecast, by Application 2019 & 2032
- Table 13: Global Tokenization Solution Market Revenue Million Forecast, by Country 2019 & 2032
- Table 14: China Tokenization Solution Market Revenue (Million) Forecast, by Application 2019 & 2032
- Table 15: India Tokenization Solution Market Revenue (Million) Forecast, by Application 2019 & 2032
- Table 16: Global Tokenization Solution Market Revenue Million Forecast, by Country 2019 & 2032
- Table 17: Tokenization Solution Market Revenue (Million) Forecast, by Application 2019 & 2032
- Table 18: Global Tokenization Solution Market Revenue Million Forecast, by Country 2019 & 2032
- Table 19: Brazil Tokenization Solution Market Revenue (Million) Forecast, by Application 2019 & 2032
- Table 20: Mexico Tokenization Solution Market Revenue (Million) Forecast, by Application 2019 & 2032
- Table 21: Argentina Tokenization Solution Market Revenue (Million) Forecast, by Application 2019 & 2032
- Table 22: Global Tokenization Solution Market Revenue Million Forecast, by Country 2019 & 2032
- Table 23: Tokenization Solution Market Revenue (Million) Forecast, by Application 2019 & 2032
- Table 24: Global Tokenization Solution Market Revenue Million Forecast, by Country 2019 & 2032
- Table 25: Saudi Arabia Tokenization Solution Market Revenue (Million) Forecast, by Application 2019 & 2032
- Table 26: South Africa Tokenization Solution Market Revenue (Million) Forecast, by Application 2019 & 2032
- Table 27: Global Tokenization Solution Market Revenue Million Forecast, by Type 2019 & 2032
- Table 28: Global Tokenization Solution Market Revenue Million Forecast, by Deployment 2019 & 2032
- Table 29: Global Tokenization Solution Market Revenue Million Forecast, by End-User Industry 2019 & 2032
- Table 30: Global Tokenization Solution Market Revenue Million Forecast, by Country 2019 & 2032
- Table 31: United States Tokenization Solution Market Revenue (Million) Forecast, by Application 2019 & 2032
- Table 32: Canada Tokenization Solution Market Revenue (Million) Forecast, by Application 2019 & 2032
- Table 33: Global Tokenization Solution Market Revenue Million Forecast, by Type 2019 & 2032
- Table 34: Global Tokenization Solution Market Revenue Million Forecast, by Deployment 2019 & 2032
- Table 35: Global Tokenization Solution Market Revenue Million Forecast, by End-User Industry 2019 & 2032
- Table 36: Global Tokenization Solution Market Revenue Million Forecast, by Country 2019 & 2032
- Table 37: United Kingdom Tokenization Solution Market Revenue (Million) Forecast, by Application 2019 & 2032
- Table 38: Germany Tokenization Solution Market Revenue (Million) Forecast, by Application 2019 & 2032
- Table 39: France Tokenization Solution Market Revenue (Million) Forecast, by Application 2019 & 2032
- Table 40: Global Tokenization Solution Market Revenue Million Forecast, by Type 2019 & 2032
- Table 41: Global Tokenization Solution Market Revenue Million Forecast, by Deployment 2019 & 2032
- Table 42: Global Tokenization Solution Market Revenue Million Forecast, by End-User Industry 2019 & 2032
- Table 43: Global Tokenization Solution Market Revenue Million Forecast, by Country 2019 & 2032
- Table 44: China Tokenization Solution Market Revenue (Million) Forecast, by Application 2019 & 2032
- Table 45: India Tokenization Solution Market Revenue (Million) Forecast, by Application 2019 & 2032
- Table 46: Global Tokenization Solution Market Revenue Million Forecast, by Type 2019 & 2032
- Table 47: Global Tokenization Solution Market Revenue Million Forecast, by Deployment 2019 & 2032
- Table 48: Global Tokenization Solution Market Revenue Million Forecast, by End-User Industry 2019 & 2032
- Table 49: Global Tokenization Solution Market Revenue Million Forecast, by Country 2019 & 2032
- Table 50: Global Tokenization Solution Market Revenue Million Forecast, by Type 2019 & 2032
- Table 51: Global Tokenization Solution Market Revenue Million Forecast, by Deployment 2019 & 2032
- Table 52: Global Tokenization Solution Market Revenue Million Forecast, by End-User Industry 2019 & 2032
- Table 53: Global Tokenization Solution Market Revenue Million Forecast, by Country 2019 & 2032
- Table 54: Brazil Tokenization Solution Market Revenue (Million) Forecast, by Application 2019 & 2032
- Table 55: Mexico Tokenization Solution Market Revenue (Million) Forecast, by Application 2019 & 2032
- Table 56: Argentina Tokenization Solution Market Revenue (Million) Forecast, by Application 2019 & 2032
- Table 57: Global Tokenization Solution Market Revenue Million Forecast, by Type 2019 & 2032
- Table 58: Global Tokenization Solution Market Revenue Million Forecast, by Deployment 2019 & 2032
- Table 59: Global Tokenization Solution Market Revenue Million Forecast, by End-User Industry 2019 & 2032
- Table 60: Global Tokenization Solution Market Revenue Million Forecast, by Country 2019 & 2032
- Table 61: Global Tokenization Solution Market Revenue Million Forecast, by Type 2019 & 2032
- Table 62: Global Tokenization Solution Market Revenue Million Forecast, by Deployment 2019 & 2032
- Table 63: Global Tokenization Solution Market Revenue Million Forecast, by End-User Industry 2019 & 2032
- Table 64: Global Tokenization Solution Market Revenue Million Forecast, by Country 2019 & 2032
- Table 65: Saudi Arabia Tokenization Solution Market Revenue (Million) Forecast, by Application 2019 & 2032
- Table 66: South Africa Tokenization Solution Market Revenue (Million) Forecast, by Application 2019 & 2032
Frequently Asked Questions
1. What is the projected Compound Annual Growth Rate (CAGR) of the Tokenization Solution Market?
The projected CAGR is approximately 17.68%.
2. Which companies are prominent players in the Tokenization Solution Market?
Key companies in the market include Fiserv Inc, First Data Corporation, Cardconnect Corporation, Hewlett Packard Enterprise, Liaison Technologies Inc, Thales Group, Ciphercloud Incorporation, Broadcom Inc, Paymetric Inc (A Worldpay Company), Cybersource Corporation, Protegrity USA Inc, 3delta Systems Inc, Tokenex LLC*List Not Exhaustive.
3. What are the main segments of the Tokenization Solution Market?
The market segments include Type, Deployment, End-User Industry.
4. Can you provide details about the market size?
The market size is estimated to be USD 5.35 Million as of 2022.
5. What are some drivers contributing to market growth?
Growing Demand for Secure Payment Gateways; Rising Adoption in E-commerce and Mobile payments; Growing Government Regulations On Data Security.
6. What are the notable trends driving market growth?
BFSI to hold the largest market size.
7. Are there any restraints impacting market growth?
Addressing Vulnerabilities From EMV Standards; Lack of Awareness Due to Similar Products.
8. Can you provide examples of recent developments in the market?
May 2023 - The EY company announced that EY OpsChain ESG is now usable in beta form on the EY Blockchain SaaS platform. The new solution, created on the Ethereum blockchain, would give businesses that find it difficult to precisely measure and manage their carbon footprint a single, verified picture of CO2 emissions (CO2e). Through tokenization, it will also give customers, business partners, and regulators the transparency required to trace emissions and carbon credits throughout an ecosystem.
9. What pricing options are available for accessing the report?
Pricing options include single-user, multi-user, and enterprise licenses priced at USD 4750, USD 5250, and USD 8750 respectively.
10. Is the market size provided in terms of value or volume?
The market size is provided in terms of value, measured in Million.
11. Are there any specific market keywords associated with the report?
Yes, the market keyword associated with the report is "Tokenization Solution Market," which aids in identifying and referencing the specific market segment covered.
12. How do I determine which pricing option suits my needs best?
The pricing options vary based on user requirements and access needs. Individual users may opt for single-user licenses, while businesses requiring broader access may choose multi-user or enterprise licenses for cost-effective access to the report.
13. Are there any additional resources or data provided in the Tokenization Solution Market report?
While the report offers comprehensive insights, it's advisable to review the specific contents or supplementary materials provided to ascertain if additional resources or data are available.
14. How can I stay updated on further developments or reports in the Tokenization Solution Market?
To stay informed about further developments, trends, and reports in the Tokenization Solution Market, consider subscribing to industry newsletters, following relevant companies and organizations, or regularly checking reputable industry news sources and publications.
Methodology
Step 1 - Identification of Relevant Samples Size from Population Database


Step 2 - Approaches for Defining Global Market Size (Value, Volume* & Price*)

Note*: In applicable scenarios
Step 3 - Data Sources
Primary Research
- Web Analytics
- Survey Reports
- Research Institute
- Latest Research Reports
- Opinion Leaders
Secondary Research
- Annual Reports
- White Paper
- Latest Press Release
- Industry Association
- Paid Database
- Investor Presentations

Step 4 - Data Triangulation
Involves using different sources of information in order to increase the validity of a study
These sources are likely to be stakeholders in a program - participants, other researchers, program staff, other community members, and so on.
Then we put all data in single framework & apply various statistical tools to find out the dynamic on the market.
During the analysis stage, feedback from the stakeholder groups would be compared to determine areas of agreement as well as areas of divergence


