
Key Insights
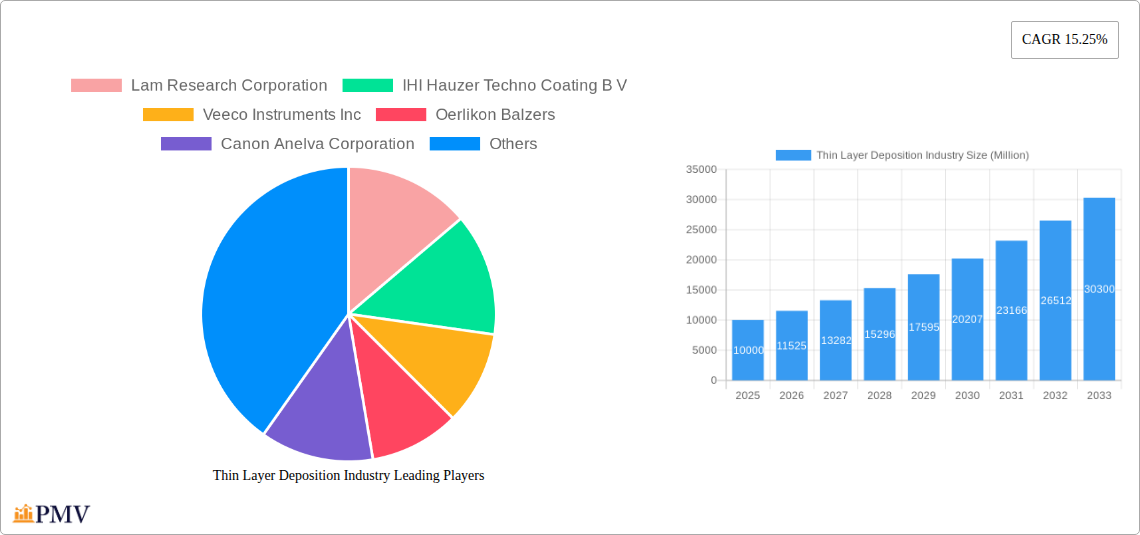
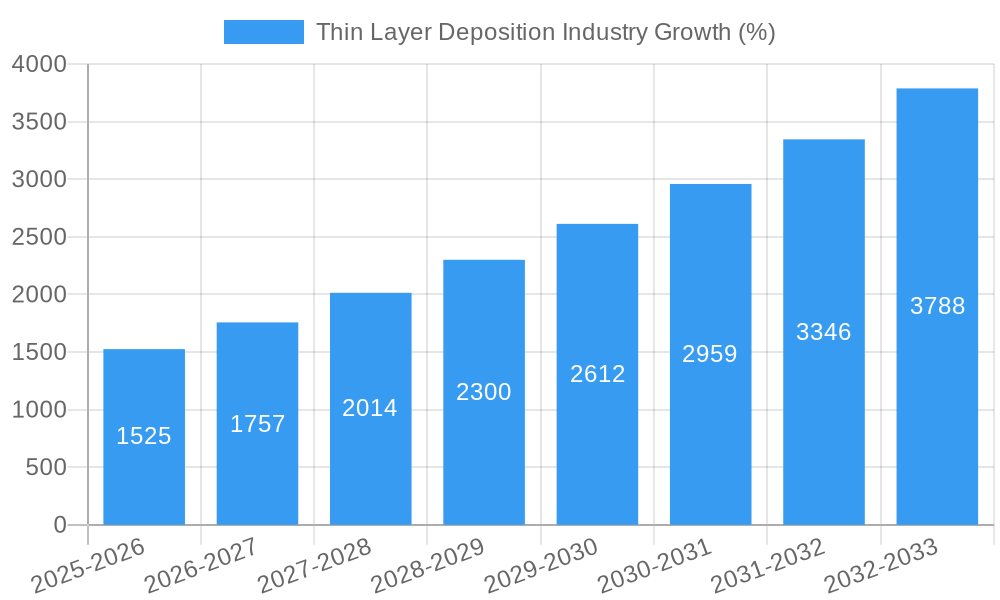
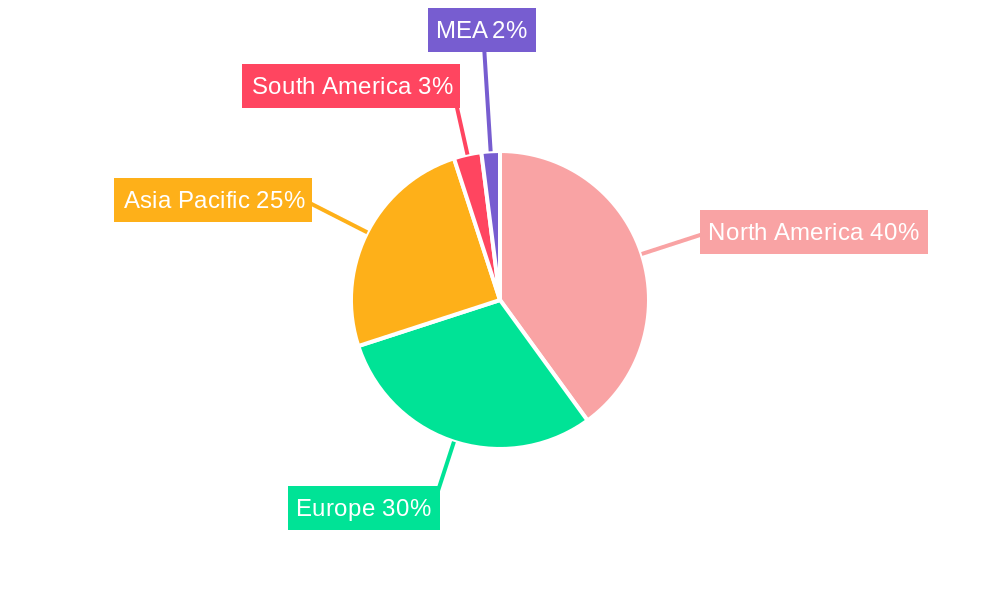
The Thin Layer Deposition (TLD) market is experiencing robust growth, driven by increasing demand across diverse sectors like semiconductors, electronics, and energy. A 15.25% CAGR indicates a significant expansion, projecting substantial market value increases throughout the forecast period (2025-2033). Key drivers include the miniaturization of electronic components, the rising adoption of advanced materials in various applications, and the continuous development of more efficient and precise deposition technologies. The market segmentation by deposition technology – Physical Vapor Deposition (PVD), Chemical Vapor Deposition (CVD), and Atomic Layer Deposition (ALD) – highlights the diverse technological landscape and opportunities for specialization. PVD, with its established infrastructure and wide applicability, currently holds a significant market share, but ALD is experiencing rapid growth due to its ability to create highly controlled and uniform thin films crucial for advanced applications like next-generation memory chips. Geographic distribution reflects the global nature of the industry, with North America and Asia Pacific currently dominating the market, fueled by strong semiconductor manufacturing hubs and robust research & development investments. However, emerging economies in Asia Pacific and regions like MEA are expected to showcase significant growth in the coming years as infrastructure development and technological adoption accelerates. Competitive pressures are high, with established players like Lam Research and Applied Materials competing against more specialized firms like CVD Equipment Corporation and IHI Hauzer Techno Coating. The ongoing focus on innovation in deposition techniques and material science continues to shape the future trajectory of this dynamic market, promising further expansion in the long term.
The restraints on market growth primarily stem from high capital investment requirements for advanced deposition equipment and the complexity of the manufacturing process. However, the long-term benefits of TLD in enhancing product performance and efficiency across various applications are expected to outweigh these challenges. The industry is also focusing on sustainable solutions, integrating environmentally friendly processes and materials to meet growing regulatory requirements and enhance the sector's overall sustainability profile. This focus, combined with ongoing technological advancements, further contributes to the positive outlook for the TLD market. The substantial market size in 2025, estimated based on the CAGR and historical data, underscores the significant financial opportunities in this segment. The continued integration of TLD in diverse industries will further propel market expansion throughout the forecast period.
Thin Layer Deposition Industry Market Report: 2019-2033
This comprehensive report provides a detailed analysis of the Thin Layer Deposition (TLD) industry, offering invaluable insights for stakeholders seeking to understand market dynamics, competitive landscapes, and future growth opportunities. The study covers the period 2019-2033, with a base year of 2025 and a forecast period of 2025-2033. The global market size is projected to reach xx Million by 2033.
Thin Layer Deposition Industry Market Structure & Competitive Dynamics
The Thin Layer Deposition market exhibits a moderately concentrated structure, with key players like Lam Research Corporation, IHI Hauzer Techno Coating B V, Veeco Instruments Inc, Oerlikon Balzers, Canon Anelva Corporation, CVD Equipment Corporation, Applied Materials Inc, ASM International NV, Tokyo Electron Limited, Aixtron SE, and Advanced Micro-Fabrication Equipment (AMEC) holding significant market share. Market concentration is influenced by factors such as technological advancements, economies of scale, and strategic partnerships.
The industry's innovation ecosystem thrives on collaborations between equipment manufacturers, material suppliers, and research institutions, leading to continuous improvement in deposition technologies. Stringent regulatory frameworks regarding environmental impact and material safety play a significant role in shaping industry practices. The presence of alternative coating technologies presents a competitive threat, although TLD's advantages in precision and performance often prevail. End-user trends towards miniaturization and higher performance in electronics and other sectors fuel market growth. M&A activity within the sector has been moderate, with deal values averaging xx Million in the past five years, driven by strategic expansions and technological integration.
Thin Layer Deposition Industry Industry Trends & Insights
The Thin Layer Deposition industry is experiencing robust growth, driven by increasing demand across diverse end-use sectors. The market registered a CAGR of xx% during the historical period (2019-2024) and is projected to maintain a CAGR of xx% during the forecast period (2025-2033). Technological disruptions, particularly in ALD and advancements in PVD, are enhancing deposition capabilities, leading to higher precision and throughput. Consumer preferences for smaller, faster, and more energy-efficient electronic devices significantly influence the demand for advanced TLD technologies. The competitive dynamics are characterized by ongoing innovation, strategic alliances, and intense competition among leading players, particularly in the segments with high market penetration like microelectronics. Market penetration of ALD in specialized applications, such as flexible electronics, is rapidly increasing.
Dominant Markets & Segments in Thin Layer Deposition Industry
The dominant market segment by deposition technology is Physical Vapor Deposition (PVD), holding a market share of xx% in 2025. This dominance is driven by:
- Established technology: PVD offers mature technology with cost-effective and scalable processes.
- Wide range of applications: Its versatility caters to a broad spectrum of industries.
- High throughput capabilities: PVD processes ensure efficient large-scale production.
However, Atomic Layer Deposition (ALD) is the fastest-growing segment, with a projected CAGR of xx% due to its ability to produce ultra-thin, highly conformal films crucial for advanced applications. The Asia-Pacific region currently represents the largest market for TLD, propelled by the robust growth of electronics manufacturing and supportive government policies. Growth drivers in this region include substantial investments in semiconductor fabrication plants and increased demand for high-performance electronic components.
Further, North America and Europe also display strong growth potential, backed by continuous R&D investments and the presence of key industry players.
Thin Layer Deposition Industry Product Innovations
Recent innovations in TLD encompass the development of novel materials and advanced process control systems. These advancements enhance deposition efficiency, precision, and film quality, leading to improved performance and reliability in various applications. The focus is on developing sustainable, eco-friendly processes that minimize waste and reduce environmental impact. These innovations cater to the growing demand for high-performance and specialized thin films across industries.
Report Segmentation & Scope
This report segments the Thin Layer Deposition market by deposition technology:
Physical Vapor Deposition (PVD): The PVD segment is expected to maintain its dominant position, exhibiting steady growth driven by its established technology base and broad applications in various industries. Market size is predicted to reach xx Million by 2033. Competitive dynamics in this segment are intense.
Chemical Vapor Deposition (CVD): The CVD segment is projected to experience moderate growth, driven by its unique capabilities in depositing specific materials and structures. The market size is projected to reach xx Million by 2033.
Atomic Layer Deposition (ALD): The ALD segment is anticipated to show the fastest growth due to its superior capabilities in creating ultra-thin, highly conformal films. The market size is projected to reach xx Million by 2033. The competitive landscape in ALD is characterized by intense innovation.
Key Drivers of Thin Layer Deposition Industry Growth
The Thin Layer Deposition industry's growth is primarily driven by the increasing demand for high-performance thin films in diverse sectors like electronics, automotive, and energy. Technological advancements in deposition techniques, alongside the development of new materials, enable superior film properties, further fueling market expansion. Government incentives and supportive policies for advanced manufacturing also contribute to the growth trajectory.
Challenges in the Thin Layer Deposition Industry Sector
Challenges include the high capital investment required for advanced equipment and the complexity of process optimization. Competition from alternative coating methods and fluctuations in raw material prices pose additional challenges. Moreover, stringent environmental regulations necessitate continuous improvement in process efficiency and waste management. These factors can impact profitability and hinder market growth if not effectively addressed.
Leading Players in the Thin Layer Deposition Industry Market
- Lam Research Corporation
- IHI Hauzer Techno Coating B V
- Veeco Instruments Inc
- Oerlikon Balzers
- Canon Anelva Corporation
- CVD Equipment Corporation
- Applied Materials Inc
- ASM International NV
- Tokyo Electron Limited
- Aixtron SE
- Advanced Micro-Fabrication Equipment (AMEC)
Key Developments in Thin Layer Deposition Industry Sector
- January 2023: Lam Research announced a new generation of ALD system.
- March 2022: Applied Materials acquired a smaller TLD company specializing in ALD technology.
- November 2021: Tokyo Electron released a high-throughput PVD system.
- (Add more recent developments with dates)
Strategic Thin Layer Deposition Industry Market Outlook
The Thin Layer Deposition market presents substantial growth potential driven by technological innovation and the increasing demand for advanced materials across multiple sectors. Strategic opportunities include focusing on niche applications like flexible electronics and developing sustainable, eco-friendly deposition processes. Investing in R&D and strategic partnerships will be crucial for sustained success in this dynamic and competitive market.
Thin Layer Deposition Industry Segmentation
-
1. Deposition Technology
- 1.1. Physical Vapor Deposition (PVD)
- 1.2. Chemical Vapor Deposition (CVD)
- 1.3. Atomic Layer Deposition (ALD)
-
2. End-Use Industry
-
2.1. Electronics
-
2.1.1. Automotive
-
2.1.1.1. Medical
- 2.1.1.1.1. Energy
-
2.1.1.1. Medical
-
2.1.1. Automotive
-
2.1. Electronics
Thin Layer Deposition Industry Segmentation By Geography
- 1. North America: United States Canada Mexico
- 2. Europe: Germany: France: Italy: United Kingdom Netherlands Rest of Europe
- 3. Asia Pacific: China, Japan, India, South Korea, Taiwan, Australia, Rest of Asia-Pacific
- 4. South America : Brazil, Argentina, Rest of South America
- 5. MEA: Middle East, Africa
Thin Layer Deposition Industry REPORT HIGHLIGHTS
| Aspects | Details |
|---|---|
| Study Period | 2019-2033 |
| Base Year | 2024 |
| Estimated Year | 2025 |
| Forecast Period | 2025-2033 |
| Historical Period | 2019-2024 |
| Growth Rate | CAGR of 15.25% from 2019-2033 |
| Segmentation |
|
Table of Contents
- 1. Introduction
- 1.1. Research Scope
- 1.2. Market Segmentation
- 1.3. Research Methodology
- 1.4. Definitions and Assumptions
- 2. Executive Summary
- 2.1. Introduction
- 3. Market Dynamics
- 3.1. Introduction
- 3.2. Market Drivers
- 3.2.1. ; Increase in Demand for Microelectronics and Consumer Electronics to Fuel the Demand; Surge in Demand of Sensors in the Smartphone Industry and Increasing Application of Solar Systems
- 3.3. Market Restrains
- 3.3.1. ; High Set up Cost; Increasing Cost of Raw Material
- 3.4. Market Trends
- 3.4.1. Increase in Demand for Microelectronics and Consumer Electronics to Fuel the Demand
- 4. Market Factor Analysis
- 4.1. Porters Five Forces
- 4.2. Supply/Value Chain
- 4.3. PESTEL analysis
- 4.4. Market Entropy
- 4.5. Patent/Trademark Analysis
- 5. Global Thin Layer Deposition Industry Analysis, Insights and Forecast, 2019-2031
- 5.1. Market Analysis, Insights and Forecast - by Deposition Technology
- 5.1.1. Physical Vapor Deposition (PVD)
- 5.1.2. Chemical Vapor Deposition (CVD)
- 5.1.3. Atomic Layer Deposition (ALD)
- 5.2. Market Analysis, Insights and Forecast - by End-Use Industry
- 5.2.1. Electronics
- 5.2.1.1. Automotive
- 5.2.1.1.1. Medical
- 5.2.1.1.1.1. Energy
- 5.2.1.1.1. Medical
- 5.2.1.1. Automotive
- 5.2.1. Electronics
- 5.3. Market Analysis, Insights and Forecast - by Region
- 5.3.1. North America: United States Canada Mexico
- 5.3.2. Europe: Germany: France: Italy: United Kingdom Netherlands Rest of Europe
- 5.3.3. Asia Pacific: China, Japan, India, South Korea, Taiwan, Australia, Rest of Asia-Pacific
- 5.3.4. South America : Brazil, Argentina, Rest of South America
- 5.3.5. MEA: Middle East, Africa
- 5.1. Market Analysis, Insights and Forecast - by Deposition Technology
- 6. North America: United States Canada Mexico Thin Layer Deposition Industry Analysis, Insights and Forecast, 2019-2031
- 6.1. Market Analysis, Insights and Forecast - by Deposition Technology
- 6.1.1. Physical Vapor Deposition (PVD)
- 6.1.2. Chemical Vapor Deposition (CVD)
- 6.1.3. Atomic Layer Deposition (ALD)
- 6.2. Market Analysis, Insights and Forecast - by End-Use Industry
- 6.2.1. Electronics
- 6.2.1.1. Automotive
- 6.2.1.1.1. Medical
- 6.2.1.1.1.1. Energy
- 6.2.1.1.1. Medical
- 6.2.1.1. Automotive
- 6.2.1. Electronics
- 6.1. Market Analysis, Insights and Forecast - by Deposition Technology
- 7. Europe: Germany: France: Italy: United Kingdom Netherlands Rest of Europe Thin Layer Deposition Industry Analysis, Insights and Forecast, 2019-2031
- 7.1. Market Analysis, Insights and Forecast - by Deposition Technology
- 7.1.1. Physical Vapor Deposition (PVD)
- 7.1.2. Chemical Vapor Deposition (CVD)
- 7.1.3. Atomic Layer Deposition (ALD)
- 7.2. Market Analysis, Insights and Forecast - by End-Use Industry
- 7.2.1. Electronics
- 7.2.1.1. Automotive
- 7.2.1.1.1. Medical
- 7.2.1.1.1.1. Energy
- 7.2.1.1.1. Medical
- 7.2.1.1. Automotive
- 7.2.1. Electronics
- 7.1. Market Analysis, Insights and Forecast - by Deposition Technology
- 8. Asia Pacific: China, Japan, India, South Korea, Taiwan, Australia, Rest of Asia-Pacific Thin Layer Deposition Industry Analysis, Insights and Forecast, 2019-2031
- 8.1. Market Analysis, Insights and Forecast - by Deposition Technology
- 8.1.1. Physical Vapor Deposition (PVD)
- 8.1.2. Chemical Vapor Deposition (CVD)
- 8.1.3. Atomic Layer Deposition (ALD)
- 8.2. Market Analysis, Insights and Forecast - by End-Use Industry
- 8.2.1. Electronics
- 8.2.1.1. Automotive
- 8.2.1.1.1. Medical
- 8.2.1.1.1.1. Energy
- 8.2.1.1.1. Medical
- 8.2.1.1. Automotive
- 8.2.1. Electronics
- 8.1. Market Analysis, Insights and Forecast - by Deposition Technology
- 9. South America : Brazil, Argentina, Rest of South America Thin Layer Deposition Industry Analysis, Insights and Forecast, 2019-2031
- 9.1. Market Analysis, Insights and Forecast - by Deposition Technology
- 9.1.1. Physical Vapor Deposition (PVD)
- 9.1.2. Chemical Vapor Deposition (CVD)
- 9.1.3. Atomic Layer Deposition (ALD)
- 9.2. Market Analysis, Insights and Forecast - by End-Use Industry
- 9.2.1. Electronics
- 9.2.1.1. Automotive
- 9.2.1.1.1. Medical
- 9.2.1.1.1.1. Energy
- 9.2.1.1.1. Medical
- 9.2.1.1. Automotive
- 9.2.1. Electronics
- 9.1. Market Analysis, Insights and Forecast - by Deposition Technology
- 10. MEA: Middle East, Africa Thin Layer Deposition Industry Analysis, Insights and Forecast, 2019-2031
- 10.1. Market Analysis, Insights and Forecast - by Deposition Technology
- 10.1.1. Physical Vapor Deposition (PVD)
- 10.1.2. Chemical Vapor Deposition (CVD)
- 10.1.3. Atomic Layer Deposition (ALD)
- 10.2. Market Analysis, Insights and Forecast - by End-Use Industry
- 10.2.1. Electronics
- 10.2.1.1. Automotive
- 10.2.1.1.1. Medical
- 10.2.1.1.1.1. Energy
- 10.2.1.1.1. Medical
- 10.2.1.1. Automotive
- 10.2.1. Electronics
- 10.1. Market Analysis, Insights and Forecast - by Deposition Technology
- 11. North America Thin Layer Deposition Industry Analysis, Insights and Forecast, 2019-2031
- 11.1. Market Analysis, Insights and Forecast - By Country/Sub-region
- 11.1.1 United States
- 11.1.2 Canada
- 11.1.3 Mexico
- 12. Europe Thin Layer Deposition Industry Analysis, Insights and Forecast, 2019-2031
- 12.1. Market Analysis, Insights and Forecast - By Country/Sub-region
- 12.1.1 Germany
- 12.1.2 United Kingdom
- 12.1.3 France
- 12.1.4 Spain
- 12.1.5 Italy
- 12.1.6 Spain
- 12.1.7 Belgium
- 12.1.8 Netherland
- 12.1.9 Nordics
- 12.1.10 Rest of Europe
- 13. Asia Pacific Thin Layer Deposition Industry Analysis, Insights and Forecast, 2019-2031
- 13.1. Market Analysis, Insights and Forecast - By Country/Sub-region
- 13.1.1 China
- 13.1.2 Japan
- 13.1.3 India
- 13.1.4 South Korea
- 13.1.5 Southeast Asia
- 13.1.6 Australia
- 13.1.7 Indonesia
- 13.1.8 Phillipes
- 13.1.9 Singapore
- 13.1.10 Thailandc
- 13.1.11 Rest of Asia Pacific
- 14. South America Thin Layer Deposition Industry Analysis, Insights and Forecast, 2019-2031
- 14.1. Market Analysis, Insights and Forecast - By Country/Sub-region
- 14.1.1 Brazil
- 14.1.2 Argentina
- 14.1.3 Peru
- 14.1.4 Chile
- 14.1.5 Colombia
- 14.1.6 Ecuador
- 14.1.7 Venezuela
- 14.1.8 Rest of South America
- 15. North America Thin Layer Deposition Industry Analysis, Insights and Forecast, 2019-2031
- 15.1. Market Analysis, Insights and Forecast - By Country/Sub-region
- 15.1.1 United States
- 15.1.2 Canada
- 15.1.3 Mexico
- 16. MEA Thin Layer Deposition Industry Analysis, Insights and Forecast, 2019-2031
- 16.1. Market Analysis, Insights and Forecast - By Country/Sub-region
- 16.1.1 United Arab Emirates
- 16.1.2 Saudi Arabia
- 16.1.3 South Africa
- 16.1.4 Rest of Middle East and Africa
- 17. Competitive Analysis
- 17.1. Global Market Share Analysis 2024
- 17.2. Company Profiles
- 17.2.1 Lam Research Corporation
- 17.2.1.1. Overview
- 17.2.1.2. Products
- 17.2.1.3. SWOT Analysis
- 17.2.1.4. Recent Developments
- 17.2.1.5. Financials (Based on Availability)
- 17.2.2 IHI Hauzer Techno Coating B V
- 17.2.2.1. Overview
- 17.2.2.2. Products
- 17.2.2.3. SWOT Analysis
- 17.2.2.4. Recent Developments
- 17.2.2.5. Financials (Based on Availability)
- 17.2.3 Veeco Instruments Inc
- 17.2.3.1. Overview
- 17.2.3.2. Products
- 17.2.3.3. SWOT Analysis
- 17.2.3.4. Recent Developments
- 17.2.3.5. Financials (Based on Availability)
- 17.2.4 Oerlikon Balzers
- 17.2.4.1. Overview
- 17.2.4.2. Products
- 17.2.4.3. SWOT Analysis
- 17.2.4.4. Recent Developments
- 17.2.4.5. Financials (Based on Availability)
- 17.2.5 Canon Anelva Corporation
- 17.2.5.1. Overview
- 17.2.5.2. Products
- 17.2.5.3. SWOT Analysis
- 17.2.5.4. Recent Developments
- 17.2.5.5. Financials (Based on Availability)
- 17.2.6 CVD Equipment Corporation
- 17.2.6.1. Overview
- 17.2.6.2. Products
- 17.2.6.3. SWOT Analysis
- 17.2.6.4. Recent Developments
- 17.2.6.5. Financials (Based on Availability)
- 17.2.7 Applied Materials Inc
- 17.2.7.1. Overview
- 17.2.7.2. Products
- 17.2.7.3. SWOT Analysis
- 17.2.7.4. Recent Developments
- 17.2.7.5. Financials (Based on Availability)
- 17.2.8 ASM International NV
- 17.2.8.1. Overview
- 17.2.8.2. Products
- 17.2.8.3. SWOT Analysis
- 17.2.8.4. Recent Developments
- 17.2.8.5. Financials (Based on Availability)
- 17.2.9 Tokyo Electron Limited
- 17.2.9.1. Overview
- 17.2.9.2. Products
- 17.2.9.3. SWOT Analysis
- 17.2.9.4. Recent Developments
- 17.2.9.5. Financials (Based on Availability)
- 17.2.10 Aixtron SE
- 17.2.10.1. Overview
- 17.2.10.2. Products
- 17.2.10.3. SWOT Analysis
- 17.2.10.4. Recent Developments
- 17.2.10.5. Financials (Based on Availability)
- 17.2.11 Advanced Micro-Fabrication Equipment (AMEC)
- 17.2.11.1. Overview
- 17.2.11.2. Products
- 17.2.11.3. SWOT Analysis
- 17.2.11.4. Recent Developments
- 17.2.11.5. Financials (Based on Availability)
- 17.2.1 Lam Research Corporation
List of Figures
- Figure 1: Global Thin Layer Deposition Industry Revenue Breakdown (Million, %) by Region 2024 & 2032
- Figure 2: North America Thin Layer Deposition Industry Revenue (Million), by Country 2024 & 2032
- Figure 3: North America Thin Layer Deposition Industry Revenue Share (%), by Country 2024 & 2032
- Figure 4: Europe Thin Layer Deposition Industry Revenue (Million), by Country 2024 & 2032
- Figure 5: Europe Thin Layer Deposition Industry Revenue Share (%), by Country 2024 & 2032
- Figure 6: Asia Pacific Thin Layer Deposition Industry Revenue (Million), by Country 2024 & 2032
- Figure 7: Asia Pacific Thin Layer Deposition Industry Revenue Share (%), by Country 2024 & 2032
- Figure 8: South America Thin Layer Deposition Industry Revenue (Million), by Country 2024 & 2032
- Figure 9: South America Thin Layer Deposition Industry Revenue Share (%), by Country 2024 & 2032
- Figure 10: North America Thin Layer Deposition Industry Revenue (Million), by Country 2024 & 2032
- Figure 11: North America Thin Layer Deposition Industry Revenue Share (%), by Country 2024 & 2032
- Figure 12: MEA Thin Layer Deposition Industry Revenue (Million), by Country 2024 & 2032
- Figure 13: MEA Thin Layer Deposition Industry Revenue Share (%), by Country 2024 & 2032
- Figure 14: North America: United States Canada Mexico Thin Layer Deposition Industry Revenue (Million), by Deposition Technology 2024 & 2032
- Figure 15: North America: United States Canada Mexico Thin Layer Deposition Industry Revenue Share (%), by Deposition Technology 2024 & 2032
- Figure 16: North America: United States Canada Mexico Thin Layer Deposition Industry Revenue (Million), by End-Use Industry 2024 & 2032
- Figure 17: North America: United States Canada Mexico Thin Layer Deposition Industry Revenue Share (%), by End-Use Industry 2024 & 2032
- Figure 18: North America: United States Canada Mexico Thin Layer Deposition Industry Revenue (Million), by Country 2024 & 2032
- Figure 19: North America: United States Canada Mexico Thin Layer Deposition Industry Revenue Share (%), by Country 2024 & 2032
- Figure 20: Europe: Germany: France: Italy: United Kingdom Netherlands Rest of Europe Thin Layer Deposition Industry Revenue (Million), by Deposition Technology 2024 & 2032
- Figure 21: Europe: Germany: France: Italy: United Kingdom Netherlands Rest of Europe Thin Layer Deposition Industry Revenue Share (%), by Deposition Technology 2024 & 2032
- Figure 22: Europe: Germany: France: Italy: United Kingdom Netherlands Rest of Europe Thin Layer Deposition Industry Revenue (Million), by End-Use Industry 2024 & 2032
- Figure 23: Europe: Germany: France: Italy: United Kingdom Netherlands Rest of Europe Thin Layer Deposition Industry Revenue Share (%), by End-Use Industry 2024 & 2032
- Figure 24: Europe: Germany: France: Italy: United Kingdom Netherlands Rest of Europe Thin Layer Deposition Industry Revenue (Million), by Country 2024 & 2032
- Figure 25: Europe: Germany: France: Italy: United Kingdom Netherlands Rest of Europe Thin Layer Deposition Industry Revenue Share (%), by Country 2024 & 2032
- Figure 26: Asia Pacific: China, Japan, India, South Korea, Taiwan, Australia, Rest of Asia-Pacific Thin Layer Deposition Industry Revenue (Million), by Deposition Technology 2024 & 2032
- Figure 27: Asia Pacific: China, Japan, India, South Korea, Taiwan, Australia, Rest of Asia-Pacific Thin Layer Deposition Industry Revenue Share (%), by Deposition Technology 2024 & 2032
- Figure 28: Asia Pacific: China, Japan, India, South Korea, Taiwan, Australia, Rest of Asia-Pacific Thin Layer Deposition Industry Revenue (Million), by End-Use Industry 2024 & 2032
- Figure 29: Asia Pacific: China, Japan, India, South Korea, Taiwan, Australia, Rest of Asia-Pacific Thin Layer Deposition Industry Revenue Share (%), by End-Use Industry 2024 & 2032
- Figure 30: Asia Pacific: China, Japan, India, South Korea, Taiwan, Australia, Rest of Asia-Pacific Thin Layer Deposition Industry Revenue (Million), by Country 2024 & 2032
- Figure 31: Asia Pacific: China, Japan, India, South Korea, Taiwan, Australia, Rest of Asia-Pacific Thin Layer Deposition Industry Revenue Share (%), by Country 2024 & 2032
- Figure 32: South America : Brazil, Argentina, Rest of South America Thin Layer Deposition Industry Revenue (Million), by Deposition Technology 2024 & 2032
- Figure 33: South America : Brazil, Argentina, Rest of South America Thin Layer Deposition Industry Revenue Share (%), by Deposition Technology 2024 & 2032
- Figure 34: South America : Brazil, Argentina, Rest of South America Thin Layer Deposition Industry Revenue (Million), by End-Use Industry 2024 & 2032
- Figure 35: South America : Brazil, Argentina, Rest of South America Thin Layer Deposition Industry Revenue Share (%), by End-Use Industry 2024 & 2032
- Figure 36: South America : Brazil, Argentina, Rest of South America Thin Layer Deposition Industry Revenue (Million), by Country 2024 & 2032
- Figure 37: South America : Brazil, Argentina, Rest of South America Thin Layer Deposition Industry Revenue Share (%), by Country 2024 & 2032
- Figure 38: MEA: Middle East, Africa Thin Layer Deposition Industry Revenue (Million), by Deposition Technology 2024 & 2032
- Figure 39: MEA: Middle East, Africa Thin Layer Deposition Industry Revenue Share (%), by Deposition Technology 2024 & 2032
- Figure 40: MEA: Middle East, Africa Thin Layer Deposition Industry Revenue (Million), by End-Use Industry 2024 & 2032
- Figure 41: MEA: Middle East, Africa Thin Layer Deposition Industry Revenue Share (%), by End-Use Industry 2024 & 2032
- Figure 42: MEA: Middle East, Africa Thin Layer Deposition Industry Revenue (Million), by Country 2024 & 2032
- Figure 43: MEA: Middle East, Africa Thin Layer Deposition Industry Revenue Share (%), by Country 2024 & 2032
List of Tables
- Table 1: Global Thin Layer Deposition Industry Revenue Million Forecast, by Region 2019 & 2032
- Table 2: Global Thin Layer Deposition Industry Revenue Million Forecast, by Deposition Technology 2019 & 2032
- Table 3: Global Thin Layer Deposition Industry Revenue Million Forecast, by End-Use Industry 2019 & 2032
- Table 4: Global Thin Layer Deposition Industry Revenue Million Forecast, by Region 2019 & 2032
- Table 5: Global Thin Layer Deposition Industry Revenue Million Forecast, by Country 2019 & 2032
- Table 6: United States Thin Layer Deposition Industry Revenue (Million) Forecast, by Application 2019 & 2032
- Table 7: Canada Thin Layer Deposition Industry Revenue (Million) Forecast, by Application 2019 & 2032
- Table 8: Mexico Thin Layer Deposition Industry Revenue (Million) Forecast, by Application 2019 & 2032
- Table 9: Global Thin Layer Deposition Industry Revenue Million Forecast, by Country 2019 & 2032
- Table 10: Germany Thin Layer Deposition Industry Revenue (Million) Forecast, by Application 2019 & 2032
- Table 11: United Kingdom Thin Layer Deposition Industry Revenue (Million) Forecast, by Application 2019 & 2032
- Table 12: France Thin Layer Deposition Industry Revenue (Million) Forecast, by Application 2019 & 2032
- Table 13: Spain Thin Layer Deposition Industry Revenue (Million) Forecast, by Application 2019 & 2032
- Table 14: Italy Thin Layer Deposition Industry Revenue (Million) Forecast, by Application 2019 & 2032
- Table 15: Spain Thin Layer Deposition Industry Revenue (Million) Forecast, by Application 2019 & 2032
- Table 16: Belgium Thin Layer Deposition Industry Revenue (Million) Forecast, by Application 2019 & 2032
- Table 17: Netherland Thin Layer Deposition Industry Revenue (Million) Forecast, by Application 2019 & 2032
- Table 18: Nordics Thin Layer Deposition Industry Revenue (Million) Forecast, by Application 2019 & 2032
- Table 19: Rest of Europe Thin Layer Deposition Industry Revenue (Million) Forecast, by Application 2019 & 2032
- Table 20: Global Thin Layer Deposition Industry Revenue Million Forecast, by Country 2019 & 2032
- Table 21: China Thin Layer Deposition Industry Revenue (Million) Forecast, by Application 2019 & 2032
- Table 22: Japan Thin Layer Deposition Industry Revenue (Million) Forecast, by Application 2019 & 2032
- Table 23: India Thin Layer Deposition Industry Revenue (Million) Forecast, by Application 2019 & 2032
- Table 24: South Korea Thin Layer Deposition Industry Revenue (Million) Forecast, by Application 2019 & 2032
- Table 25: Southeast Asia Thin Layer Deposition Industry Revenue (Million) Forecast, by Application 2019 & 2032
- Table 26: Australia Thin Layer Deposition Industry Revenue (Million) Forecast, by Application 2019 & 2032
- Table 27: Indonesia Thin Layer Deposition Industry Revenue (Million) Forecast, by Application 2019 & 2032
- Table 28: Phillipes Thin Layer Deposition Industry Revenue (Million) Forecast, by Application 2019 & 2032
- Table 29: Singapore Thin Layer Deposition Industry Revenue (Million) Forecast, by Application 2019 & 2032
- Table 30: Thailandc Thin Layer Deposition Industry Revenue (Million) Forecast, by Application 2019 & 2032
- Table 31: Rest of Asia Pacific Thin Layer Deposition Industry Revenue (Million) Forecast, by Application 2019 & 2032
- Table 32: Global Thin Layer Deposition Industry Revenue Million Forecast, by Country 2019 & 2032
- Table 33: Brazil Thin Layer Deposition Industry Revenue (Million) Forecast, by Application 2019 & 2032
- Table 34: Argentina Thin Layer Deposition Industry Revenue (Million) Forecast, by Application 2019 & 2032
- Table 35: Peru Thin Layer Deposition Industry Revenue (Million) Forecast, by Application 2019 & 2032
- Table 36: Chile Thin Layer Deposition Industry Revenue (Million) Forecast, by Application 2019 & 2032
- Table 37: Colombia Thin Layer Deposition Industry Revenue (Million) Forecast, by Application 2019 & 2032
- Table 38: Ecuador Thin Layer Deposition Industry Revenue (Million) Forecast, by Application 2019 & 2032
- Table 39: Venezuela Thin Layer Deposition Industry Revenue (Million) Forecast, by Application 2019 & 2032
- Table 40: Rest of South America Thin Layer Deposition Industry Revenue (Million) Forecast, by Application 2019 & 2032
- Table 41: Global Thin Layer Deposition Industry Revenue Million Forecast, by Country 2019 & 2032
- Table 42: United States Thin Layer Deposition Industry Revenue (Million) Forecast, by Application 2019 & 2032
- Table 43: Canada Thin Layer Deposition Industry Revenue (Million) Forecast, by Application 2019 & 2032
- Table 44: Mexico Thin Layer Deposition Industry Revenue (Million) Forecast, by Application 2019 & 2032
- Table 45: Global Thin Layer Deposition Industry Revenue Million Forecast, by Country 2019 & 2032
- Table 46: United Arab Emirates Thin Layer Deposition Industry Revenue (Million) Forecast, by Application 2019 & 2032
- Table 47: Saudi Arabia Thin Layer Deposition Industry Revenue (Million) Forecast, by Application 2019 & 2032
- Table 48: South Africa Thin Layer Deposition Industry Revenue (Million) Forecast, by Application 2019 & 2032
- Table 49: Rest of Middle East and Africa Thin Layer Deposition Industry Revenue (Million) Forecast, by Application 2019 & 2032
- Table 50: Global Thin Layer Deposition Industry Revenue Million Forecast, by Deposition Technology 2019 & 2032
- Table 51: Global Thin Layer Deposition Industry Revenue Million Forecast, by End-Use Industry 2019 & 2032
- Table 52: Global Thin Layer Deposition Industry Revenue Million Forecast, by Country 2019 & 2032
- Table 53: Global Thin Layer Deposition Industry Revenue Million Forecast, by Deposition Technology 2019 & 2032
- Table 54: Global Thin Layer Deposition Industry Revenue Million Forecast, by End-Use Industry 2019 & 2032
- Table 55: Global Thin Layer Deposition Industry Revenue Million Forecast, by Country 2019 & 2032
- Table 56: Global Thin Layer Deposition Industry Revenue Million Forecast, by Deposition Technology 2019 & 2032
- Table 57: Global Thin Layer Deposition Industry Revenue Million Forecast, by End-Use Industry 2019 & 2032
- Table 58: Global Thin Layer Deposition Industry Revenue Million Forecast, by Country 2019 & 2032
- Table 59: Global Thin Layer Deposition Industry Revenue Million Forecast, by Deposition Technology 2019 & 2032
- Table 60: Global Thin Layer Deposition Industry Revenue Million Forecast, by End-Use Industry 2019 & 2032
- Table 61: Global Thin Layer Deposition Industry Revenue Million Forecast, by Country 2019 & 2032
- Table 62: Global Thin Layer Deposition Industry Revenue Million Forecast, by Deposition Technology 2019 & 2032
- Table 63: Global Thin Layer Deposition Industry Revenue Million Forecast, by End-Use Industry 2019 & 2032
- Table 64: Global Thin Layer Deposition Industry Revenue Million Forecast, by Country 2019 & 2032
Frequently Asked Questions
1. What is the projected Compound Annual Growth Rate (CAGR) of the Thin Layer Deposition Industry?
The projected CAGR is approximately 15.25%.
2. Which companies are prominent players in the Thin Layer Deposition Industry?
Key companies in the market include Lam Research Corporation, IHI Hauzer Techno Coating B V, Veeco Instruments Inc, Oerlikon Balzers, Canon Anelva Corporation, CVD Equipment Corporation, Applied Materials Inc, ASM International NV, Tokyo Electron Limited, Aixtron SE, Advanced Micro-Fabrication Equipment (AMEC).
3. What are the main segments of the Thin Layer Deposition Industry?
The market segments include Deposition Technology, End-Use Industry.
4. Can you provide details about the market size?
The market size is estimated to be USD XX Million as of 2022.
5. What are some drivers contributing to market growth?
; Increase in Demand for Microelectronics and Consumer Electronics to Fuel the Demand; Surge in Demand of Sensors in the Smartphone Industry and Increasing Application of Solar Systems.
6. What are the notable trends driving market growth?
Increase in Demand for Microelectronics and Consumer Electronics to Fuel the Demand.
7. Are there any restraints impacting market growth?
; High Set up Cost; Increasing Cost of Raw Material.
8. Can you provide examples of recent developments in the market?
N/A
9. What pricing options are available for accessing the report?
Pricing options include single-user, multi-user, and enterprise licenses priced at USD 4750, USD 5250, and USD 8750 respectively.
10. Is the market size provided in terms of value or volume?
The market size is provided in terms of value, measured in Million.
11. Are there any specific market keywords associated with the report?
Yes, the market keyword associated with the report is "Thin Layer Deposition Industry," which aids in identifying and referencing the specific market segment covered.
12. How do I determine which pricing option suits my needs best?
The pricing options vary based on user requirements and access needs. Individual users may opt for single-user licenses, while businesses requiring broader access may choose multi-user or enterprise licenses for cost-effective access to the report.
13. Are there any additional resources or data provided in the Thin Layer Deposition Industry report?
While the report offers comprehensive insights, it's advisable to review the specific contents or supplementary materials provided to ascertain if additional resources or data are available.
14. How can I stay updated on further developments or reports in the Thin Layer Deposition Industry?
To stay informed about further developments, trends, and reports in the Thin Layer Deposition Industry, consider subscribing to industry newsletters, following relevant companies and organizations, or regularly checking reputable industry news sources and publications.
Methodology
Step 1 - Identification of Relevant Samples Size from Population Database


Step 2 - Approaches for Defining Global Market Size (Value, Volume* & Price*)

Note*: In applicable scenarios
Step 3 - Data Sources
Primary Research
- Web Analytics
- Survey Reports
- Research Institute
- Latest Research Reports
- Opinion Leaders
Secondary Research
- Annual Reports
- White Paper
- Latest Press Release
- Industry Association
- Paid Database
- Investor Presentations

Step 4 - Data Triangulation
Involves using different sources of information in order to increase the validity of a study
These sources are likely to be stakeholders in a program - participants, other researchers, program staff, other community members, and so on.
Then we put all data in single framework & apply various statistical tools to find out the dynamic on the market.
During the analysis stage, feedback from the stakeholder groups would be compared to determine areas of agreement as well as areas of divergence


