
Key Insights
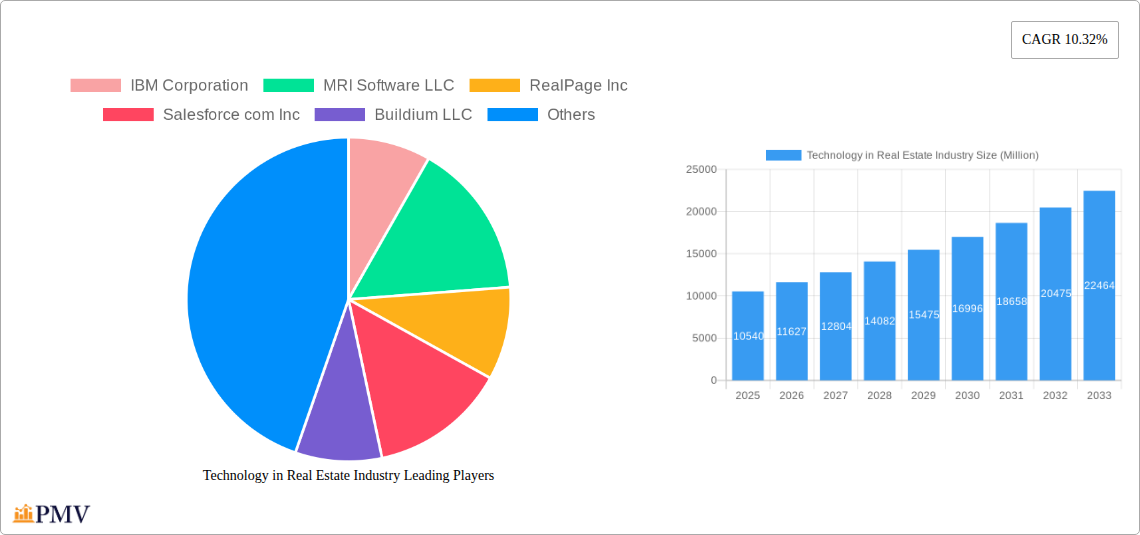
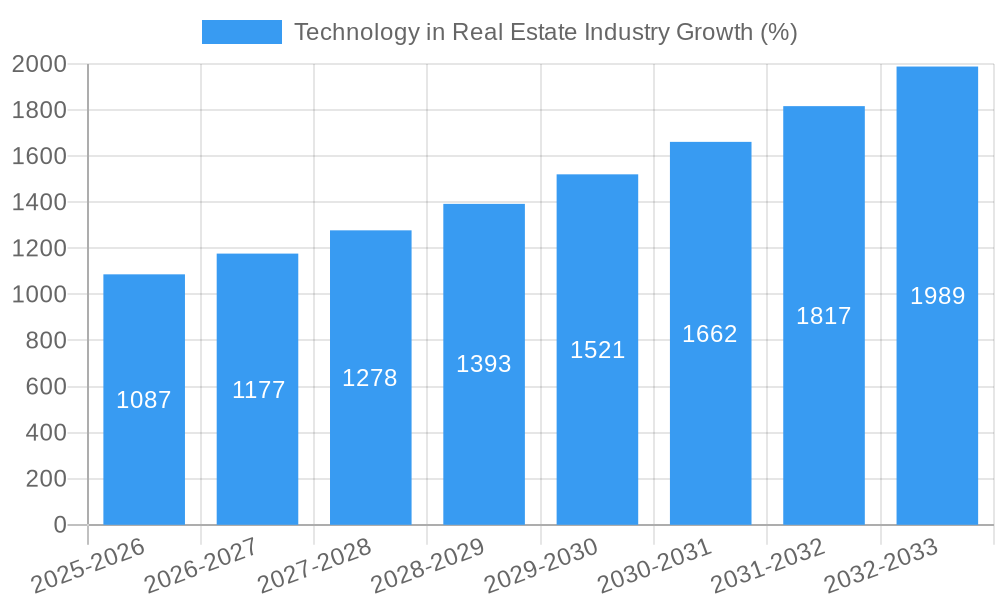
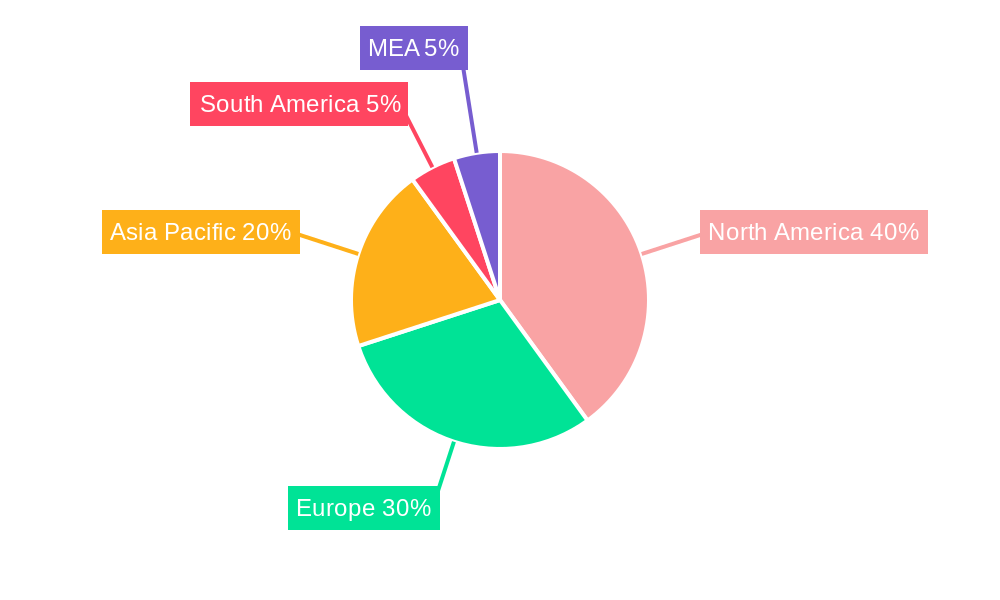
The global Technology in Real Estate (TRE) market, valued at $10.54 billion in 2025, is projected to experience robust growth, exhibiting a Compound Annual Growth Rate (CAGR) of 10.32% from 2025 to 2033. This expansion is fueled by several key drivers. The increasing adoption of cloud-based solutions offers scalability, cost-effectiveness, and improved accessibility for real estate firms of all sizes. Furthermore, the rising demand for enhanced data analytics and business intelligence tools empowers informed decision-making, optimized asset management, and improved customer relationship management (CRM). Stringent regulatory compliance requirements also drive the demand for specialized software solutions. The market segmentation reveals a strong preference for cloud deployment models over on-premise solutions, indicating a shift towards flexible and adaptable technological infrastructure. Within solutions, property management software, accounting software, and CRM systems are dominant segments, reflecting the core operational needs of the real estate industry. Geographically, North America currently holds a significant market share due to the advanced technological adoption and a large, well-established real estate sector. However, Asia Pacific is anticipated to witness rapid growth in the coming years, driven by increasing urbanization and infrastructure development. While challenges exist such as high initial investment costs and the need for skilled professionals to implement and maintain these technologies, the overall market trajectory remains positive, promising substantial growth opportunities for technology providers and real estate companies alike.
The competitive landscape is marked by a mix of established players like IBM, Salesforce, and Yardi Systems, alongside emerging tech companies offering specialized solutions. The ongoing consolidation and strategic partnerships within the industry indicate a trend towards comprehensive, integrated platforms that cater to a wide range of real estate needs. Future growth will likely be shaped by advancements in artificial intelligence (AI), the Internet of Things (IoT), and blockchain technology, which promise to revolutionize various aspects of real estate transactions, property management, and customer engagement. The increasing focus on sustainability and green building practices is also creating a niche market for specialized technology solutions that support environmentally conscious real estate development and management. This confluence of technological advancements, evolving business needs, and regulatory compliance will shape the future of the TRE market, promising continued expansion and innovation throughout the forecast period.
Technology in Real Estate Industry: A Comprehensive Market Report (2019-2033)
This in-depth report provides a comprehensive analysis of the Technology in Real Estate Industry market, projecting a market value exceeding $XX Million by 2033. It covers market structure, competitive dynamics, key trends, dominant segments, and leading players, offering valuable insights for investors, businesses, and industry professionals. The study period spans 2019-2033, with 2025 as the base and estimated year. The forecast period is 2025-2033, and the historical period is 2019-2024.
Technology in Real Estate Industry Market Structure & Competitive Dynamics
The Technology in Real Estate Industry market is characterized by a moderately concentrated landscape with several major players commanding significant market share. While the exact market share for each company is proprietary information, key players like Yardi Systems Inc, RealPage Inc, and MRI Software LLC hold substantial portions. The market exhibits a dynamic innovation ecosystem, driven by PropTech startups and established technology providers. Regulatory frameworks vary across geographies, impacting data privacy, security, and compliance requirements. Product substitution is occurring as cloud-based solutions increasingly replace on-premise systems. End-user trends favor integrated, scalable solutions that streamline operations and enhance decision-making. M&A activity is robust, with deal values exceeding $XX Million in recent years, indicating consolidation and expansion within the sector.
- Market Concentration: Moderate, with a few dominant players.
- Innovation Ecosystem: Highly active, fueled by PropTech startups and established tech firms.
- Regulatory Frameworks: Vary significantly by region, impacting compliance and data security.
- M&A Activity: Significant, with deal values exceeding $XX Million annually, driving market consolidation.
- End-User Trends: Shifting toward integrated, cloud-based solutions for enhanced efficiency.
Technology in Real Estate Industry Industry Trends & Insights
The Technology in Real Estate Industry market is experiencing robust growth, driven by factors such as increasing adoption of cloud-based solutions, rising demand for data-driven insights, and the growing need for improved operational efficiency. The market is witnessing significant technological disruptions, including the rise of AI, blockchain, and IoT in real estate applications. Consumer preferences are shifting towards user-friendly, mobile-accessible platforms offering personalized experiences. Competitive dynamics are intense, with companies investing heavily in R&D to develop innovative solutions and enhance their market position. The Compound Annual Growth Rate (CAGR) during the forecast period is estimated at XX%, indicating substantial market expansion. Market penetration of cloud-based solutions is projected to reach XX% by 2033.
Dominant Markets & Segments in Technology in Real Estate Industry
The North American region currently dominates the Technology in Real Estate Industry market, driven by strong economic growth, advanced technological infrastructure, and high adoption rates of PropTech solutions. Within the segments:
- By Deployment: Cloud-based solutions are experiencing faster growth than on-premise deployments, driven by scalability and cost-effectiveness.
- By Solution: Customer Relationship Management (CRM), Asset Management, and Enterprise Resource Planning (ERP) solutions are high-growth segments. Business Intelligence solutions are gaining traction, driven by a need for data-driven decision-making.
- By End User: The commercial real estate sector currently holds a larger market share than residential, driven by higher spending capacity and complex operational needs.
Key Drivers:
- North America: Strong economic growth, advanced tech infrastructure, high PropTech adoption.
- Cloud Deployment: Scalability, cost-effectiveness, accessibility, and ease of maintenance.
- CRM/Asset Management/ERP Solutions: Growing needs for streamlined operations, data management, and enhanced client relationships.
Technology in Real Estate Industry Product Innovations
Recent product innovations focus on integrating AI and Machine Learning for predictive analytics, improving property valuations, automating tasks, and enhancing tenant/client experiences. Blockchain technology is being explored for secure and transparent transaction processing. The integration of IoT devices enables real-time monitoring of building systems and improved energy efficiency. These innovations address market needs for streamlined workflows, improved risk management, enhanced data insights, and optimized resource utilization.
Report Segmentation & Scope
The report segments the Technology in Real Estate Industry market by deployment (on-premise, cloud), solution (documentation, accounting, compliance, business intelligence, ERP, CRM, asset management, other solutions), and end-user (residential, commercial). Each segment's growth projections, market sizes, and competitive dynamics are detailed within the report. For example, the cloud-based segment is projected to exhibit significant growth, while CRM and Asset Management solutions are expected to dominate in terms of revenue generation. The Commercial segment will show higher growth rates compared to Residential, driven by larger transactions and complex management needs.
Key Drivers of Technology in Real Estate Industry Growth
Several factors drive the growth of the Technology in Real Estate Industry. Technological advancements like AI, Blockchain, and IoT are transforming real estate operations. Strong economic growth in key markets fuels investment in PropTech solutions. Favorable government regulations and incentives supporting technology adoption in real estate further accelerate market expansion.
Challenges in the Technology in Real Estate Industry Sector
Key challenges include high upfront investment costs for implementing new technologies, concerns over data security and privacy, and the need for skilled personnel to manage and maintain these systems. Integration complexities between existing and new systems pose additional hurdles. Furthermore, competition among established players and emerging startups exerts pressure on pricing and profitability. These challenges impact market adoption and the pace of innovation.
Leading Players in the Technology in Real Estate Industry Market
- IBM Corporation
- MRI Software LLC
- RealPage Inc
- Salesforce com Inc
- Buildium LLC
- Yardi Systems Inc
- RealSpace Software Ltd
- AppFolio Inc
- Oracle Corporation
- Elinext
- The Sage Group PLC
- SAP SE
Key Developments in Technology in Real Estate Industry Sector
- September 2022: Launch of HDFC Real Estate Tech Innovators 2022, focusing on fintech, sales tech, construction tech, and sustainability tech. This initiative fosters innovation within the Indian real estate technology sector.
- July 2022: Partnership between DMZ and GroundBreak Ventures to launch a PropTech incubator, supporting the development of innovative startups. This increases the availability of new solutions and drives competition.
- March 2022: LaSalle Investment Management selects RealBlocks to manage its USD 77 Billion global real estate business, showcasing the increasing adoption of digital solutions for investor onboarding and document management. This significantly improves efficiency and transparency in large-scale real estate transactions.
Strategic Technology in Real Estate Industry Market Outlook
The Technology in Real Estate Industry market presents significant growth potential driven by ongoing technological advancements, increasing demand for efficient operations, and the growing adoption of cloud-based and data-driven solutions. Strategic opportunities lie in developing innovative solutions, expanding into new markets, and forging strategic partnerships to enhance market reach and capabilities. The focus on sustainability and green technologies within the real estate sector will also create further opportunities.
Technology in Real Estate Industry Segmentation
-
1. Deployment
- 1.1. On-premise
- 1.2. Cloud
-
2. Solution
- 2.1. Documentation
- 2.2. Accounting
- 2.3. Compliance
- 2.4. Business Intelligence
- 2.5. Enterprise Resource Planning
- 2.6. Customer Relationship Management
- 2.7. Asset Management
- 2.8. Other Solutions
-
3. End User
- 3.1. Residential
- 3.2. Commercial
Technology in Real Estate Industry Segmentation By Geography
- 1. North America
- 2. Europe
- 3. Asia Pacific
- 4. Latin America
- 5. Middle East and Africa
Technology in Real Estate Industry REPORT HIGHLIGHTS
| Aspects | Details |
|---|---|
| Study Period | 2019-2033 |
| Base Year | 2024 |
| Estimated Year | 2025 |
| Forecast Period | 2025-2033 |
| Historical Period | 2019-2024 |
| Growth Rate | CAGR of 10.32% from 2019-2033 |
| Segmentation |
|
Table of Contents
- 1. Introduction
- 1.1. Research Scope
- 1.2. Market Segmentation
- 1.3. Research Methodology
- 1.4. Definitions and Assumptions
- 2. Executive Summary
- 2.1. Introduction
- 3. Market Dynamics
- 3.1. Introduction
- 3.2. Market Drivers
- 3.2.1. Technologically Transforming the Real Estate Sector and Increasing Demand to Manage Projects; Increasing Adoption of Cloud-based Solution
- 3.3. Market Restrains
- 3.3.1. High Costs Associated with IT Solutions
- 3.4. Market Trends
- 3.4.1. Cloud Type of Deployment is Expected to Account for a Significant Share
- 4. Market Factor Analysis
- 4.1. Porters Five Forces
- 4.2. Supply/Value Chain
- 4.3. PESTEL analysis
- 4.4. Market Entropy
- 4.5. Patent/Trademark Analysis
- 5. Global Technology in Real Estate Industry Analysis, Insights and Forecast, 2019-2031
- 5.1. Market Analysis, Insights and Forecast - by Deployment
- 5.1.1. On-premise
- 5.1.2. Cloud
- 5.2. Market Analysis, Insights and Forecast - by Solution
- 5.2.1. Documentation
- 5.2.2. Accounting
- 5.2.3. Compliance
- 5.2.4. Business Intelligence
- 5.2.5. Enterprise Resource Planning
- 5.2.6. Customer Relationship Management
- 5.2.7. Asset Management
- 5.2.8. Other Solutions
- 5.3. Market Analysis, Insights and Forecast - by End User
- 5.3.1. Residential
- 5.3.2. Commercial
- 5.4. Market Analysis, Insights and Forecast - by Region
- 5.4.1. North America
- 5.4.2. Europe
- 5.4.3. Asia Pacific
- 5.4.4. Latin America
- 5.4.5. Middle East and Africa
- 5.1. Market Analysis, Insights and Forecast - by Deployment
- 6. North America Technology in Real Estate Industry Analysis, Insights and Forecast, 2019-2031
- 6.1. Market Analysis, Insights and Forecast - by Deployment
- 6.1.1. On-premise
- 6.1.2. Cloud
- 6.2. Market Analysis, Insights and Forecast - by Solution
- 6.2.1. Documentation
- 6.2.2. Accounting
- 6.2.3. Compliance
- 6.2.4. Business Intelligence
- 6.2.5. Enterprise Resource Planning
- 6.2.6. Customer Relationship Management
- 6.2.7. Asset Management
- 6.2.8. Other Solutions
- 6.3. Market Analysis, Insights and Forecast - by End User
- 6.3.1. Residential
- 6.3.2. Commercial
- 6.1. Market Analysis, Insights and Forecast - by Deployment
- 7. Europe Technology in Real Estate Industry Analysis, Insights and Forecast, 2019-2031
- 7.1. Market Analysis, Insights and Forecast - by Deployment
- 7.1.1. On-premise
- 7.1.2. Cloud
- 7.2. Market Analysis, Insights and Forecast - by Solution
- 7.2.1. Documentation
- 7.2.2. Accounting
- 7.2.3. Compliance
- 7.2.4. Business Intelligence
- 7.2.5. Enterprise Resource Planning
- 7.2.6. Customer Relationship Management
- 7.2.7. Asset Management
- 7.2.8. Other Solutions
- 7.3. Market Analysis, Insights and Forecast - by End User
- 7.3.1. Residential
- 7.3.2. Commercial
- 7.1. Market Analysis, Insights and Forecast - by Deployment
- 8. Asia Pacific Technology in Real Estate Industry Analysis, Insights and Forecast, 2019-2031
- 8.1. Market Analysis, Insights and Forecast - by Deployment
- 8.1.1. On-premise
- 8.1.2. Cloud
- 8.2. Market Analysis, Insights and Forecast - by Solution
- 8.2.1. Documentation
- 8.2.2. Accounting
- 8.2.3. Compliance
- 8.2.4. Business Intelligence
- 8.2.5. Enterprise Resource Planning
- 8.2.6. Customer Relationship Management
- 8.2.7. Asset Management
- 8.2.8. Other Solutions
- 8.3. Market Analysis, Insights and Forecast - by End User
- 8.3.1. Residential
- 8.3.2. Commercial
- 8.1. Market Analysis, Insights and Forecast - by Deployment
- 9. Latin America Technology in Real Estate Industry Analysis, Insights and Forecast, 2019-2031
- 9.1. Market Analysis, Insights and Forecast - by Deployment
- 9.1.1. On-premise
- 9.1.2. Cloud
- 9.2. Market Analysis, Insights and Forecast - by Solution
- 9.2.1. Documentation
- 9.2.2. Accounting
- 9.2.3. Compliance
- 9.2.4. Business Intelligence
- 9.2.5. Enterprise Resource Planning
- 9.2.6. Customer Relationship Management
- 9.2.7. Asset Management
- 9.2.8. Other Solutions
- 9.3. Market Analysis, Insights and Forecast - by End User
- 9.3.1. Residential
- 9.3.2. Commercial
- 9.1. Market Analysis, Insights and Forecast - by Deployment
- 10. Middle East and Africa Technology in Real Estate Industry Analysis, Insights and Forecast, 2019-2031
- 10.1. Market Analysis, Insights and Forecast - by Deployment
- 10.1.1. On-premise
- 10.1.2. Cloud
- 10.2. Market Analysis, Insights and Forecast - by Solution
- 10.2.1. Documentation
- 10.2.2. Accounting
- 10.2.3. Compliance
- 10.2.4. Business Intelligence
- 10.2.5. Enterprise Resource Planning
- 10.2.6. Customer Relationship Management
- 10.2.7. Asset Management
- 10.2.8. Other Solutions
- 10.3. Market Analysis, Insights and Forecast - by End User
- 10.3.1. Residential
- 10.3.2. Commercial
- 10.1. Market Analysis, Insights and Forecast - by Deployment
- 11. North America Technology in Real Estate Industry Analysis, Insights and Forecast, 2019-2031
- 11.1. Market Analysis, Insights and Forecast - By Country/Sub-region
- 11.1.1 United States
- 11.1.2 Canada
- 11.1.3 Mexico
- 12. Europe Technology in Real Estate Industry Analysis, Insights and Forecast, 2019-2031
- 12.1. Market Analysis, Insights and Forecast - By Country/Sub-region
- 12.1.1 Germany
- 12.1.2 United Kingdom
- 12.1.3 France
- 12.1.4 Spain
- 12.1.5 Italy
- 12.1.6 Spain
- 12.1.7 Belgium
- 12.1.8 Netherland
- 12.1.9 Nordics
- 12.1.10 Rest of Europe
- 13. Asia Pacific Technology in Real Estate Industry Analysis, Insights and Forecast, 2019-2031
- 13.1. Market Analysis, Insights and Forecast - By Country/Sub-region
- 13.1.1 China
- 13.1.2 Japan
- 13.1.3 India
- 13.1.4 South Korea
- 13.1.5 Southeast Asia
- 13.1.6 Australia
- 13.1.7 Indonesia
- 13.1.8 Phillipes
- 13.1.9 Singapore
- 13.1.10 Thailandc
- 13.1.11 Rest of Asia Pacific
- 14. South America Technology in Real Estate Industry Analysis, Insights and Forecast, 2019-2031
- 14.1. Market Analysis, Insights and Forecast - By Country/Sub-region
- 14.1.1 Brazil
- 14.1.2 Argentina
- 14.1.3 Peru
- 14.1.4 Chile
- 14.1.5 Colombia
- 14.1.6 Ecuador
- 14.1.7 Venezuela
- 14.1.8 Rest of South America
- 15. North America Technology in Real Estate Industry Analysis, Insights and Forecast, 2019-2031
- 15.1. Market Analysis, Insights and Forecast - By Country/Sub-region
- 15.1.1 United States
- 15.1.2 Canada
- 15.1.3 Mexico
- 16. MEA Technology in Real Estate Industry Analysis, Insights and Forecast, 2019-2031
- 16.1. Market Analysis, Insights and Forecast - By Country/Sub-region
- 16.1.1 United Arab Emirates
- 16.1.2 Saudi Arabia
- 16.1.3 South Africa
- 16.1.4 Rest of Middle East and Africa
- 17. Competitive Analysis
- 17.1. Global Market Share Analysis 2024
- 17.2. Company Profiles
- 17.2.1 IBM Corporation
- 17.2.1.1. Overview
- 17.2.1.2. Products
- 17.2.1.3. SWOT Analysis
- 17.2.1.4. Recent Developments
- 17.2.1.5. Financials (Based on Availability)
- 17.2.2 MRI Software LLC
- 17.2.2.1. Overview
- 17.2.2.2. Products
- 17.2.2.3. SWOT Analysis
- 17.2.2.4. Recent Developments
- 17.2.2.5. Financials (Based on Availability)
- 17.2.3 RealPage Inc
- 17.2.3.1. Overview
- 17.2.3.2. Products
- 17.2.3.3. SWOT Analysis
- 17.2.3.4. Recent Developments
- 17.2.3.5. Financials (Based on Availability)
- 17.2.4 Salesforce com Inc
- 17.2.4.1. Overview
- 17.2.4.2. Products
- 17.2.4.3. SWOT Analysis
- 17.2.4.4. Recent Developments
- 17.2.4.5. Financials (Based on Availability)
- 17.2.5 Buildium LLC
- 17.2.5.1. Overview
- 17.2.5.2. Products
- 17.2.5.3. SWOT Analysis
- 17.2.5.4. Recent Developments
- 17.2.5.5. Financials (Based on Availability)
- 17.2.6 Yardi Systems Inc
- 17.2.6.1. Overview
- 17.2.6.2. Products
- 17.2.6.3. SWOT Analysis
- 17.2.6.4. Recent Developments
- 17.2.6.5. Financials (Based on Availability)
- 17.2.7 RealSpace Software Ltd*List Not Exhaustive
- 17.2.7.1. Overview
- 17.2.7.2. Products
- 17.2.7.3. SWOT Analysis
- 17.2.7.4. Recent Developments
- 17.2.7.5. Financials (Based on Availability)
- 17.2.8 AppFolio Inc
- 17.2.8.1. Overview
- 17.2.8.2. Products
- 17.2.8.3. SWOT Analysis
- 17.2.8.4. Recent Developments
- 17.2.8.5. Financials (Based on Availability)
- 17.2.9 Oracle Corporation
- 17.2.9.1. Overview
- 17.2.9.2. Products
- 17.2.9.3. SWOT Analysis
- 17.2.9.4. Recent Developments
- 17.2.9.5. Financials (Based on Availability)
- 17.2.10 Elinext
- 17.2.10.1. Overview
- 17.2.10.2. Products
- 17.2.10.3. SWOT Analysis
- 17.2.10.4. Recent Developments
- 17.2.10.5. Financials (Based on Availability)
- 17.2.11 The Sage Group PLC
- 17.2.11.1. Overview
- 17.2.11.2. Products
- 17.2.11.3. SWOT Analysis
- 17.2.11.4. Recent Developments
- 17.2.11.5. Financials (Based on Availability)
- 17.2.12 SAP SE
- 17.2.12.1. Overview
- 17.2.12.2. Products
- 17.2.12.3. SWOT Analysis
- 17.2.12.4. Recent Developments
- 17.2.12.5. Financials (Based on Availability)
- 17.2.1 IBM Corporation
List of Figures
- Figure 1: Global Technology in Real Estate Industry Revenue Breakdown (Million, %) by Region 2024 & 2032
- Figure 2: North America Technology in Real Estate Industry Revenue (Million), by Country 2024 & 2032
- Figure 3: North America Technology in Real Estate Industry Revenue Share (%), by Country 2024 & 2032
- Figure 4: Europe Technology in Real Estate Industry Revenue (Million), by Country 2024 & 2032
- Figure 5: Europe Technology in Real Estate Industry Revenue Share (%), by Country 2024 & 2032
- Figure 6: Asia Pacific Technology in Real Estate Industry Revenue (Million), by Country 2024 & 2032
- Figure 7: Asia Pacific Technology in Real Estate Industry Revenue Share (%), by Country 2024 & 2032
- Figure 8: South America Technology in Real Estate Industry Revenue (Million), by Country 2024 & 2032
- Figure 9: South America Technology in Real Estate Industry Revenue Share (%), by Country 2024 & 2032
- Figure 10: North America Technology in Real Estate Industry Revenue (Million), by Country 2024 & 2032
- Figure 11: North America Technology in Real Estate Industry Revenue Share (%), by Country 2024 & 2032
- Figure 12: MEA Technology in Real Estate Industry Revenue (Million), by Country 2024 & 2032
- Figure 13: MEA Technology in Real Estate Industry Revenue Share (%), by Country 2024 & 2032
- Figure 14: North America Technology in Real Estate Industry Revenue (Million), by Deployment 2024 & 2032
- Figure 15: North America Technology in Real Estate Industry Revenue Share (%), by Deployment 2024 & 2032
- Figure 16: North America Technology in Real Estate Industry Revenue (Million), by Solution 2024 & 2032
- Figure 17: North America Technology in Real Estate Industry Revenue Share (%), by Solution 2024 & 2032
- Figure 18: North America Technology in Real Estate Industry Revenue (Million), by End User 2024 & 2032
- Figure 19: North America Technology in Real Estate Industry Revenue Share (%), by End User 2024 & 2032
- Figure 20: North America Technology in Real Estate Industry Revenue (Million), by Country 2024 & 2032
- Figure 21: North America Technology in Real Estate Industry Revenue Share (%), by Country 2024 & 2032
- Figure 22: Europe Technology in Real Estate Industry Revenue (Million), by Deployment 2024 & 2032
- Figure 23: Europe Technology in Real Estate Industry Revenue Share (%), by Deployment 2024 & 2032
- Figure 24: Europe Technology in Real Estate Industry Revenue (Million), by Solution 2024 & 2032
- Figure 25: Europe Technology in Real Estate Industry Revenue Share (%), by Solution 2024 & 2032
- Figure 26: Europe Technology in Real Estate Industry Revenue (Million), by End User 2024 & 2032
- Figure 27: Europe Technology in Real Estate Industry Revenue Share (%), by End User 2024 & 2032
- Figure 28: Europe Technology in Real Estate Industry Revenue (Million), by Country 2024 & 2032
- Figure 29: Europe Technology in Real Estate Industry Revenue Share (%), by Country 2024 & 2032
- Figure 30: Asia Pacific Technology in Real Estate Industry Revenue (Million), by Deployment 2024 & 2032
- Figure 31: Asia Pacific Technology in Real Estate Industry Revenue Share (%), by Deployment 2024 & 2032
- Figure 32: Asia Pacific Technology in Real Estate Industry Revenue (Million), by Solution 2024 & 2032
- Figure 33: Asia Pacific Technology in Real Estate Industry Revenue Share (%), by Solution 2024 & 2032
- Figure 34: Asia Pacific Technology in Real Estate Industry Revenue (Million), by End User 2024 & 2032
- Figure 35: Asia Pacific Technology in Real Estate Industry Revenue Share (%), by End User 2024 & 2032
- Figure 36: Asia Pacific Technology in Real Estate Industry Revenue (Million), by Country 2024 & 2032
- Figure 37: Asia Pacific Technology in Real Estate Industry Revenue Share (%), by Country 2024 & 2032
- Figure 38: Latin America Technology in Real Estate Industry Revenue (Million), by Deployment 2024 & 2032
- Figure 39: Latin America Technology in Real Estate Industry Revenue Share (%), by Deployment 2024 & 2032
- Figure 40: Latin America Technology in Real Estate Industry Revenue (Million), by Solution 2024 & 2032
- Figure 41: Latin America Technology in Real Estate Industry Revenue Share (%), by Solution 2024 & 2032
- Figure 42: Latin America Technology in Real Estate Industry Revenue (Million), by End User 2024 & 2032
- Figure 43: Latin America Technology in Real Estate Industry Revenue Share (%), by End User 2024 & 2032
- Figure 44: Latin America Technology in Real Estate Industry Revenue (Million), by Country 2024 & 2032
- Figure 45: Latin America Technology in Real Estate Industry Revenue Share (%), by Country 2024 & 2032
- Figure 46: Middle East and Africa Technology in Real Estate Industry Revenue (Million), by Deployment 2024 & 2032
- Figure 47: Middle East and Africa Technology in Real Estate Industry Revenue Share (%), by Deployment 2024 & 2032
- Figure 48: Middle East and Africa Technology in Real Estate Industry Revenue (Million), by Solution 2024 & 2032
- Figure 49: Middle East and Africa Technology in Real Estate Industry Revenue Share (%), by Solution 2024 & 2032
- Figure 50: Middle East and Africa Technology in Real Estate Industry Revenue (Million), by End User 2024 & 2032
- Figure 51: Middle East and Africa Technology in Real Estate Industry Revenue Share (%), by End User 2024 & 2032
- Figure 52: Middle East and Africa Technology in Real Estate Industry Revenue (Million), by Country 2024 & 2032
- Figure 53: Middle East and Africa Technology in Real Estate Industry Revenue Share (%), by Country 2024 & 2032
List of Tables
- Table 1: Global Technology in Real Estate Industry Revenue Million Forecast, by Region 2019 & 2032
- Table 2: Global Technology in Real Estate Industry Revenue Million Forecast, by Deployment 2019 & 2032
- Table 3: Global Technology in Real Estate Industry Revenue Million Forecast, by Solution 2019 & 2032
- Table 4: Global Technology in Real Estate Industry Revenue Million Forecast, by End User 2019 & 2032
- Table 5: Global Technology in Real Estate Industry Revenue Million Forecast, by Region 2019 & 2032
- Table 6: Global Technology in Real Estate Industry Revenue Million Forecast, by Country 2019 & 2032
- Table 7: United States Technology in Real Estate Industry Revenue (Million) Forecast, by Application 2019 & 2032
- Table 8: Canada Technology in Real Estate Industry Revenue (Million) Forecast, by Application 2019 & 2032
- Table 9: Mexico Technology in Real Estate Industry Revenue (Million) Forecast, by Application 2019 & 2032
- Table 10: Global Technology in Real Estate Industry Revenue Million Forecast, by Country 2019 & 2032
- Table 11: Germany Technology in Real Estate Industry Revenue (Million) Forecast, by Application 2019 & 2032
- Table 12: United Kingdom Technology in Real Estate Industry Revenue (Million) Forecast, by Application 2019 & 2032
- Table 13: France Technology in Real Estate Industry Revenue (Million) Forecast, by Application 2019 & 2032
- Table 14: Spain Technology in Real Estate Industry Revenue (Million) Forecast, by Application 2019 & 2032
- Table 15: Italy Technology in Real Estate Industry Revenue (Million) Forecast, by Application 2019 & 2032
- Table 16: Spain Technology in Real Estate Industry Revenue (Million) Forecast, by Application 2019 & 2032
- Table 17: Belgium Technology in Real Estate Industry Revenue (Million) Forecast, by Application 2019 & 2032
- Table 18: Netherland Technology in Real Estate Industry Revenue (Million) Forecast, by Application 2019 & 2032
- Table 19: Nordics Technology in Real Estate Industry Revenue (Million) Forecast, by Application 2019 & 2032
- Table 20: Rest of Europe Technology in Real Estate Industry Revenue (Million) Forecast, by Application 2019 & 2032
- Table 21: Global Technology in Real Estate Industry Revenue Million Forecast, by Country 2019 & 2032
- Table 22: China Technology in Real Estate Industry Revenue (Million) Forecast, by Application 2019 & 2032
- Table 23: Japan Technology in Real Estate Industry Revenue (Million) Forecast, by Application 2019 & 2032
- Table 24: India Technology in Real Estate Industry Revenue (Million) Forecast, by Application 2019 & 2032
- Table 25: South Korea Technology in Real Estate Industry Revenue (Million) Forecast, by Application 2019 & 2032
- Table 26: Southeast Asia Technology in Real Estate Industry Revenue (Million) Forecast, by Application 2019 & 2032
- Table 27: Australia Technology in Real Estate Industry Revenue (Million) Forecast, by Application 2019 & 2032
- Table 28: Indonesia Technology in Real Estate Industry Revenue (Million) Forecast, by Application 2019 & 2032
- Table 29: Phillipes Technology in Real Estate Industry Revenue (Million) Forecast, by Application 2019 & 2032
- Table 30: Singapore Technology in Real Estate Industry Revenue (Million) Forecast, by Application 2019 & 2032
- Table 31: Thailandc Technology in Real Estate Industry Revenue (Million) Forecast, by Application 2019 & 2032
- Table 32: Rest of Asia Pacific Technology in Real Estate Industry Revenue (Million) Forecast, by Application 2019 & 2032
- Table 33: Global Technology in Real Estate Industry Revenue Million Forecast, by Country 2019 & 2032
- Table 34: Brazil Technology in Real Estate Industry Revenue (Million) Forecast, by Application 2019 & 2032
- Table 35: Argentina Technology in Real Estate Industry Revenue (Million) Forecast, by Application 2019 & 2032
- Table 36: Peru Technology in Real Estate Industry Revenue (Million) Forecast, by Application 2019 & 2032
- Table 37: Chile Technology in Real Estate Industry Revenue (Million) Forecast, by Application 2019 & 2032
- Table 38: Colombia Technology in Real Estate Industry Revenue (Million) Forecast, by Application 2019 & 2032
- Table 39: Ecuador Technology in Real Estate Industry Revenue (Million) Forecast, by Application 2019 & 2032
- Table 40: Venezuela Technology in Real Estate Industry Revenue (Million) Forecast, by Application 2019 & 2032
- Table 41: Rest of South America Technology in Real Estate Industry Revenue (Million) Forecast, by Application 2019 & 2032
- Table 42: Global Technology in Real Estate Industry Revenue Million Forecast, by Country 2019 & 2032
- Table 43: United States Technology in Real Estate Industry Revenue (Million) Forecast, by Application 2019 & 2032
- Table 44: Canada Technology in Real Estate Industry Revenue (Million) Forecast, by Application 2019 & 2032
- Table 45: Mexico Technology in Real Estate Industry Revenue (Million) Forecast, by Application 2019 & 2032
- Table 46: Global Technology in Real Estate Industry Revenue Million Forecast, by Country 2019 & 2032
- Table 47: United Arab Emirates Technology in Real Estate Industry Revenue (Million) Forecast, by Application 2019 & 2032
- Table 48: Saudi Arabia Technology in Real Estate Industry Revenue (Million) Forecast, by Application 2019 & 2032
- Table 49: South Africa Technology in Real Estate Industry Revenue (Million) Forecast, by Application 2019 & 2032
- Table 50: Rest of Middle East and Africa Technology in Real Estate Industry Revenue (Million) Forecast, by Application 2019 & 2032
- Table 51: Global Technology in Real Estate Industry Revenue Million Forecast, by Deployment 2019 & 2032
- Table 52: Global Technology in Real Estate Industry Revenue Million Forecast, by Solution 2019 & 2032
- Table 53: Global Technology in Real Estate Industry Revenue Million Forecast, by End User 2019 & 2032
- Table 54: Global Technology in Real Estate Industry Revenue Million Forecast, by Country 2019 & 2032
- Table 55: Global Technology in Real Estate Industry Revenue Million Forecast, by Deployment 2019 & 2032
- Table 56: Global Technology in Real Estate Industry Revenue Million Forecast, by Solution 2019 & 2032
- Table 57: Global Technology in Real Estate Industry Revenue Million Forecast, by End User 2019 & 2032
- Table 58: Global Technology in Real Estate Industry Revenue Million Forecast, by Country 2019 & 2032
- Table 59: Global Technology in Real Estate Industry Revenue Million Forecast, by Deployment 2019 & 2032
- Table 60: Global Technology in Real Estate Industry Revenue Million Forecast, by Solution 2019 & 2032
- Table 61: Global Technology in Real Estate Industry Revenue Million Forecast, by End User 2019 & 2032
- Table 62: Global Technology in Real Estate Industry Revenue Million Forecast, by Country 2019 & 2032
- Table 63: Global Technology in Real Estate Industry Revenue Million Forecast, by Deployment 2019 & 2032
- Table 64: Global Technology in Real Estate Industry Revenue Million Forecast, by Solution 2019 & 2032
- Table 65: Global Technology in Real Estate Industry Revenue Million Forecast, by End User 2019 & 2032
- Table 66: Global Technology in Real Estate Industry Revenue Million Forecast, by Country 2019 & 2032
- Table 67: Global Technology in Real Estate Industry Revenue Million Forecast, by Deployment 2019 & 2032
- Table 68: Global Technology in Real Estate Industry Revenue Million Forecast, by Solution 2019 & 2032
- Table 69: Global Technology in Real Estate Industry Revenue Million Forecast, by End User 2019 & 2032
- Table 70: Global Technology in Real Estate Industry Revenue Million Forecast, by Country 2019 & 2032
Frequently Asked Questions
1. What is the projected Compound Annual Growth Rate (CAGR) of the Technology in Real Estate Industry?
The projected CAGR is approximately 10.32%.
2. Which companies are prominent players in the Technology in Real Estate Industry?
Key companies in the market include IBM Corporation, MRI Software LLC, RealPage Inc, Salesforce com Inc, Buildium LLC, Yardi Systems Inc, RealSpace Software Ltd*List Not Exhaustive, AppFolio Inc, Oracle Corporation, Elinext, The Sage Group PLC, SAP SE.
3. What are the main segments of the Technology in Real Estate Industry?
The market segments include Deployment, Solution, End User.
4. Can you provide details about the market size?
The market size is estimated to be USD 10.54 Million as of 2022.
5. What are some drivers contributing to market growth?
Technologically Transforming the Real Estate Sector and Increasing Demand to Manage Projects; Increasing Adoption of Cloud-based Solution.
6. What are the notable trends driving market growth?
Cloud Type of Deployment is Expected to Account for a Significant Share.
7. Are there any restraints impacting market growth?
High Costs Associated with IT Solutions.
8. Can you provide examples of recent developments in the market?
September 2022: HDFC Capital, the subsidiary of the Housing Development Finance Corporation (HDFC), and Invest India, the Indian government's arm to promote investment, jointly announced the launch of a proptech platform HDFC Real Estate Tech Innovators 2022. Launched under HDFC Capital's HDFC Affordable Real Estate and Technology (H@ART) platform, it will identify, recognize and award innovations in fintech, the sales tech, construction tech, and sustainability tech sectors.
9. What pricing options are available for accessing the report?
Pricing options include single-user, multi-user, and enterprise licenses priced at USD 4750, USD 5250, and USD 8750 respectively.
10. Is the market size provided in terms of value or volume?
The market size is provided in terms of value, measured in Million.
11. Are there any specific market keywords associated with the report?
Yes, the market keyword associated with the report is "Technology in Real Estate Industry," which aids in identifying and referencing the specific market segment covered.
12. How do I determine which pricing option suits my needs best?
The pricing options vary based on user requirements and access needs. Individual users may opt for single-user licenses, while businesses requiring broader access may choose multi-user or enterprise licenses for cost-effective access to the report.
13. Are there any additional resources or data provided in the Technology in Real Estate Industry report?
While the report offers comprehensive insights, it's advisable to review the specific contents or supplementary materials provided to ascertain if additional resources or data are available.
14. How can I stay updated on further developments or reports in the Technology in Real Estate Industry?
To stay informed about further developments, trends, and reports in the Technology in Real Estate Industry, consider subscribing to industry newsletters, following relevant companies and organizations, or regularly checking reputable industry news sources and publications.
Methodology
Step 1 - Identification of Relevant Samples Size from Population Database


Step 2 - Approaches for Defining Global Market Size (Value, Volume* & Price*)

Note*: In applicable scenarios
Step 3 - Data Sources
Primary Research
- Web Analytics
- Survey Reports
- Research Institute
- Latest Research Reports
- Opinion Leaders
Secondary Research
- Annual Reports
- White Paper
- Latest Press Release
- Industry Association
- Paid Database
- Investor Presentations

Step 4 - Data Triangulation
Involves using different sources of information in order to increase the validity of a study
These sources are likely to be stakeholders in a program - participants, other researchers, program staff, other community members, and so on.
Then we put all data in single framework & apply various statistical tools to find out the dynamic on the market.
During the analysis stage, feedback from the stakeholder groups would be compared to determine areas of agreement as well as areas of divergence


