
Key Insights
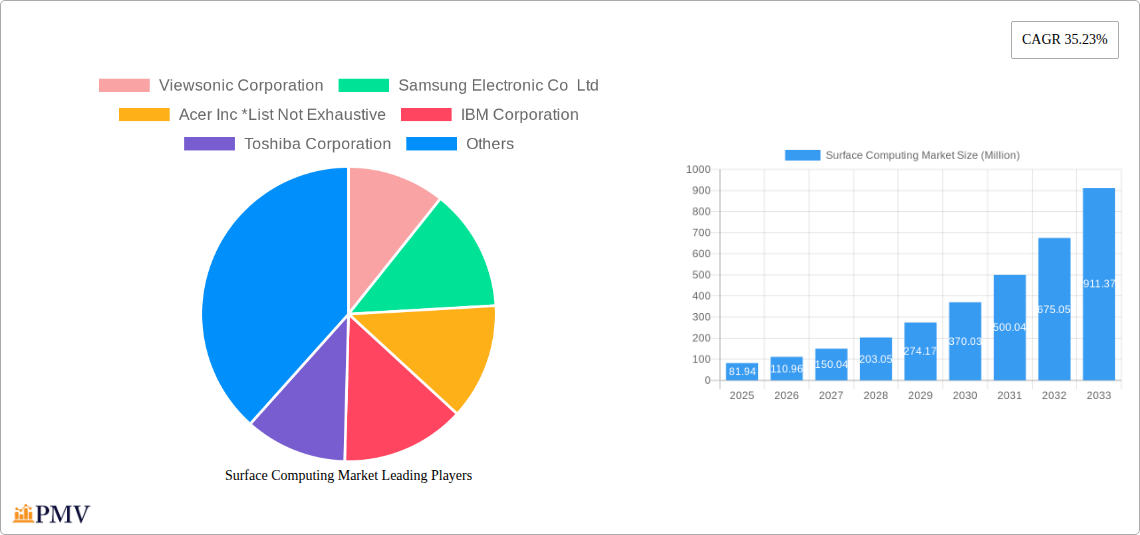
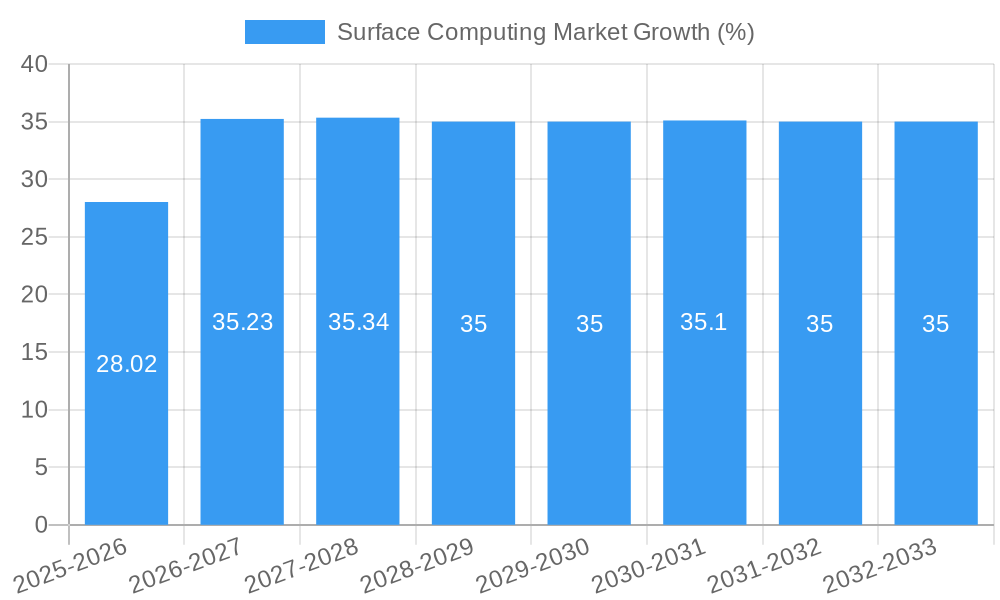
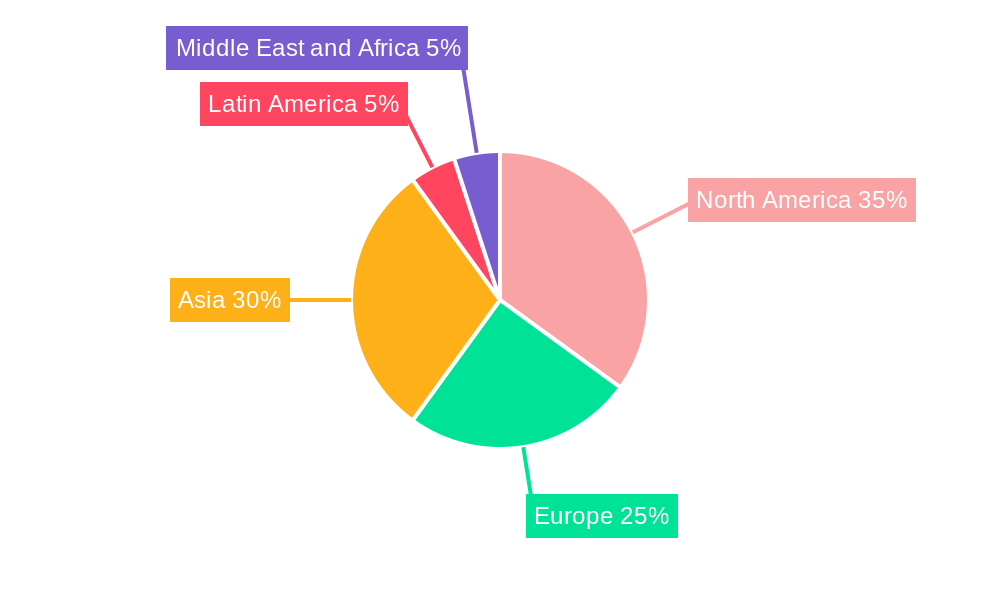
The surface computing market, valued at $81.94 million in 2025, is experiencing robust growth, projected to expand at a Compound Annual Growth Rate (CAGR) of 35.23% from 2025 to 2033. This surge is driven by several key factors. Firstly, the increasing adoption of interactive displays across diverse sectors like retail (digital signage, interactive kiosks), healthcare (patient information systems, telehealth), and education (interactive whiteboards) fuels market expansion. Secondly, technological advancements, such as improved touch sensitivity, higher resolutions, and the integration of augmented reality (AR) and virtual reality (VR) functionalities, are enhancing user experience and driving demand. The market is segmented by display type (flat, curved), touch functionality (single, multi-touch, multi-user), dimensionality (2D, 3D), and application (entertainment, retail, etc.). While challenges exist, such as the relatively high initial investment cost for businesses, these are being mitigated by the long-term cost savings and increased efficiency offered by surface computing solutions. The competitive landscape is dynamic, with major players like Samsung, LG, Microsoft, and others vying for market share through innovation and strategic partnerships. The Asia-Pacific region, particularly China and India, is anticipated to witness significant growth, owing to rapid technological adoption and increasing disposable incomes. North America and Europe, while mature markets, will continue to contribute substantially to overall market revenue due to existing infrastructure and technological sophistication.
The forecast period of 2025-2033 is expected to witness a significant shift in the market landscape. The integration of Artificial Intelligence (AI) and machine learning will lead to more intelligent and personalized user interfaces. Furthermore, the miniaturization of components and the development of more energy-efficient technologies will further accelerate market adoption. The focus on user experience and the development of more intuitive and user-friendly interfaces will remain crucial for market players seeking a competitive edge. The increasing demand for seamless integration with other technologies, like cloud computing and IoT, will play a significant role in shaping the future trajectory of the surface computing market. The convergence of technologies, coupled with the growing need for efficient and engaging interactive interfaces, will propel the market towards exponential growth in the coming years.
Surface Computing Market: A Comprehensive Report (2019-2033)
This in-depth report provides a comprehensive analysis of the global Surface Computing Market, offering invaluable insights for stakeholders across the industry. Covering the period from 2019 to 2033, with a focus on 2025, this report examines market structure, competitive dynamics, key trends, and future growth prospects. The report projects a market value of xx Million by 2033, representing a significant CAGR of xx% during the forecast period (2025-2033).
Surface Computing Market Structure & Competitive Dynamics
The surface computing market is characterized by a moderately concentrated landscape with key players vying for market share. Market concentration is influenced by the continuous influx of innovative technologies and evolving consumer preferences. The regulatory framework, while generally supportive of technological advancements, varies across regions impacting market accessibility and adoption rates. Product substitutes, such as traditional computing devices and emerging technologies, pose a competitive threat. End-user trends, particularly towards enhanced user experience and seamless integration, are shaping product development and marketing strategies. Mergers and acquisitions (M&A) play a significant role in shaping market dynamics; recent deals have totaled an estimated xx Million, primarily focused on expanding product portfolios and market reach. Major players like Microsoft, Samsung, and Apple maintain substantial market share, while smaller players focus on niche segments and innovative technologies.
- Market Share: Microsoft holds approximately xx% of the market share, followed by Samsung with xx% and Apple with xx%.
- M&A Activity: The average deal value in the last five years has been approximately xx Million, indicating consolidation within the sector.
Surface Computing Market Industry Trends & Insights
The surface computing market is experiencing robust growth driven by several factors. The increasing adoption of touch-enabled devices across various sectors, particularly in retail, healthcare, and education, is a significant driver. Technological advancements, such as the integration of artificial intelligence (AI) and improved display technologies (e.g., curved displays, 3D vision), are fueling innovation and enhancing user experience. Consumer preferences are shifting towards more intuitive and interactive interfaces, further boosting market demand. The competitive landscape is dynamic, with companies continuously striving to differentiate their offerings through unique features, functionalities, and design aesthetics. The market penetration of multi-touch and AI-integrated surface computing solutions is rapidly increasing, with a projected CAGR of xx% over the next decade.
Dominant Markets & Segments in Surface Computing Market
The North American region currently dominates the surface computing market, driven by strong technological innovation, high consumer spending, and the early adoption of new technologies. However, the Asia-Pacific region is projected to exhibit the highest growth rate over the forecast period due to the expanding middle class and increasing smartphone penetration.
Dominant Segments:
- Type: Flat displays currently hold the largest market share, but curved displays are experiencing rapid growth due to their enhanced visual appeal and immersive experience.
- Touch: Multi-touch technology is gaining traction due to its versatility and intuitive interface.
- Vision: Two-dimensional displays dominate the current market, but three-dimensional displays are witnessing increasing adoption in niche applications.
- Application: The commercial sector is the leading application segment, followed by entertainment and retail. Significant growth is expected in the healthcare and automotive sectors.
Key Drivers:
- North America: Strong technological infrastructure, high consumer spending, and early adoption of new technologies.
- Asia-Pacific: Rapid economic growth, expanding middle class, and increasing smartphone penetration.
- Europe: Government initiatives promoting digitalization and investment in advanced technologies.
Surface Computing Market Product Innovations
Recent product innovations have focused on integrating AI capabilities, enhancing display technologies (higher resolutions, improved color accuracy, curved displays), and improving overall user experience. Companies are developing more intuitive interfaces and introducing multi-user capabilities to cater to diverse needs. This focus on technological advancement aims to provide competitive advantages by delivering superior performance, functionality, and user-friendliness.
Report Segmentation & Scope
This report segments the surface computing market by:
Type: Flat Display, Curved Display, Components
- Flat Display: This segment dominates the market currently and is projected to maintain a significant share due to its cost-effectiveness and wide availability.
- Curved Display: This segment is experiencing substantial growth due to its immersive capabilities and aesthetic appeal.
- Components: This segment includes touchscreens, processors, and other essential components, which are vital for the overall market growth.
Touch: Single Touch, Multi-touch, Multi-user, Other Touches
- Multi-touch: This segment is witnessing rapid growth due to its enhanced user experience and versatile functionality.
Vision: Two Dimensional, Three Dimensional
- 2D Vision: This segment currently holds the largest market share.
- 3D Vision: This segment is growing but is still niche, with applications mainly in specialized industries.
Application: Entertainment, Retail, Hospitality, Healthcare, Commercial, Advertisement, Automotive, Education, Other Applications
- Each application segment displays distinct growth trajectories based on adoption rates and technological advancements within each respective sector.
Key Drivers of Surface Computing Market Growth
The surface computing market is propelled by technological advancements, such as improved display technologies (higher resolutions, enhanced color accuracy, and curved displays), integration of artificial intelligence (AI) and machine learning (ML) capabilities, and the development of more intuitive and user-friendly interfaces. Economic factors, like rising disposable incomes and increased investments in technological infrastructure in developing economies, are further driving market growth. Government initiatives to promote digitalization and smart technologies also positively influence market expansion.
Challenges in the Surface Computing Market Sector
Challenges include the high cost of advanced technologies, potentially hindering market penetration in price-sensitive regions. Supply chain disruptions and component shortages can lead to production delays and increase costs. Intense competition among established players and emerging companies can put downward pressure on prices and profit margins. Stringent regulatory requirements in certain regions could add to the complexity of product development and market entry.
Leading Players in the Surface Computing Market Market
- Viewsonic Corporation
- Samsung Electronic Co Ltd
- Acer Inc
- IBM Corporation
- Toshiba Corporation
- LG Electronics Inc
- Fujitsu Ltd
- Planar Systems Inc
- Microsoft Corporation [Microsoft]
- Dell Inc [Dell]
- 3M Co [3M]
- Qualcomm Technologies Inc [Qualcomm]
- Hewlett-Packard Ltd [HP]
- Lenovo Group Ltd [Lenovo]
- Apple Inc [Apple]
- Panasonic Corporation [Panasonic]
- Intel Corporation [Intel]
- Sony Corporation [Sony]
Key Developments in Surface Computing Market Sector
- May 2024: Microsoft announced new computers with built-in AI technology, accelerating the adoption of AI-powered PCs.
- March 2024: Microsoft released two new AI-powered PCs and advanced its management portal, enhancing business productivity with AI integration.
Strategic Surface Computing Market Outlook
The future of the surface computing market is bright, driven by ongoing technological advancements, increasing demand across diverse sectors, and the potential for disruptive innovations. Strategic opportunities lie in developing innovative products and services that cater to evolving consumer preferences, expanding into new geographic markets, and forging strategic partnerships to leverage complementary technologies and expertise. The market is poised for sustained growth, with opportunities for both established players and new entrants to capture market share.
Surface Computing Market Segmentation
-
1. Type
- 1.1. Flat Display
- 1.2. Curved Display
-
1.3. Components
- 1.3.1. Screen
- 1.3.2. Camera
- 1.3.3. Sensor
- 1.3.4. Processor
- 1.3.5. Software
- 1.3.6. Projector
- 1.3.7. Other Components
-
2. Touch
- 2.1. Single Touch
- 2.2. Multi-touch
- 2.3. Multi-user
- 2.4. Other Touches
-
3. Vision
- 3.1. Two Dimensional
- 3.2. Three Dimensional
-
4. Application
- 4.1. Entertainment
- 4.2. Retail
- 4.3. Hospitality
- 4.4. Healthcare
- 4.5. Commercial
- 4.6. Advertisement
- 4.7. Automotive
- 4.8. Education
- 4.9. Other Applications
Surface Computing Market Segmentation By Geography
-
1. North America
- 1.1. United States
- 1.2. Canada
-
2. Europe
- 2.1. United Kingdom
- 2.2. Germany
- 2.3. France
-
3. Asia
- 3.1. China
- 3.2. Japan
- 3.3. India
- 3.4. Australia and New Zealand
-
4. Latin America
- 4.1. Mexico
- 4.2. Brazil
- 4.3. Argentina
-
5. Middle East and Africa
- 5.1. Saudi Arabia
- 5.2. United Arab Emirates
- 5.3. South Africa
Surface Computing Market REPORT HIGHLIGHTS
| Aspects | Details |
|---|---|
| Study Period | 2019-2033 |
| Base Year | 2024 |
| Estimated Year | 2025 |
| Forecast Period | 2025-2033 |
| Historical Period | 2019-2024 |
| Growth Rate | CAGR of 35.23% from 2019-2033 |
| Segmentation |
|
Table of Contents
- 1. Introduction
- 1.1. Research Scope
- 1.2. Market Segmentation
- 1.3. Research Methodology
- 1.4. Definitions and Assumptions
- 2. Executive Summary
- 2.1. Introduction
- 3. Market Dynamics
- 3.1. Introduction
- 3.2. Market Drivers
- 3.2.1. More Advanced and User-friendly Interface - Natural User Interface (NUI); Increasing Business Revenue Due to Adoption of Multi-user Tabletops
- 3.3. Market Restrains
- 3.3.1. Limited Availability of Features; High Cost of Surface Computers
- 3.4. Market Trends
- 3.4.1. The Retail Sector is Expected to Hold a Significant Market Share
- 4. Market Factor Analysis
- 4.1. Porters Five Forces
- 4.2. Supply/Value Chain
- 4.3. PESTEL analysis
- 4.4. Market Entropy
- 4.5. Patent/Trademark Analysis
- 5. Global Surface Computing Market Analysis, Insights and Forecast, 2019-2031
- 5.1. Market Analysis, Insights and Forecast - by Type
- 5.1.1. Flat Display
- 5.1.2. Curved Display
- 5.1.3. Components
- 5.1.3.1. Screen
- 5.1.3.2. Camera
- 5.1.3.3. Sensor
- 5.1.3.4. Processor
- 5.1.3.5. Software
- 5.1.3.6. Projector
- 5.1.3.7. Other Components
- 5.2. Market Analysis, Insights and Forecast - by Touch
- 5.2.1. Single Touch
- 5.2.2. Multi-touch
- 5.2.3. Multi-user
- 5.2.4. Other Touches
- 5.3. Market Analysis, Insights and Forecast - by Vision
- 5.3.1. Two Dimensional
- 5.3.2. Three Dimensional
- 5.4. Market Analysis, Insights and Forecast - by Application
- 5.4.1. Entertainment
- 5.4.2. Retail
- 5.4.3. Hospitality
- 5.4.4. Healthcare
- 5.4.5. Commercial
- 5.4.6. Advertisement
- 5.4.7. Automotive
- 5.4.8. Education
- 5.4.9. Other Applications
- 5.5. Market Analysis, Insights and Forecast - by Region
- 5.5.1. North America
- 5.5.2. Europe
- 5.5.3. Asia
- 5.5.4. Latin America
- 5.5.5. Middle East and Africa
- 5.1. Market Analysis, Insights and Forecast - by Type
- 6. North America Surface Computing Market Analysis, Insights and Forecast, 2019-2031
- 6.1. Market Analysis, Insights and Forecast - by Type
- 6.1.1. Flat Display
- 6.1.2. Curved Display
- 6.1.3. Components
- 6.1.3.1. Screen
- 6.1.3.2. Camera
- 6.1.3.3. Sensor
- 6.1.3.4. Processor
- 6.1.3.5. Software
- 6.1.3.6. Projector
- 6.1.3.7. Other Components
- 6.2. Market Analysis, Insights and Forecast - by Touch
- 6.2.1. Single Touch
- 6.2.2. Multi-touch
- 6.2.3. Multi-user
- 6.2.4. Other Touches
- 6.3. Market Analysis, Insights and Forecast - by Vision
- 6.3.1. Two Dimensional
- 6.3.2. Three Dimensional
- 6.4. Market Analysis, Insights and Forecast - by Application
- 6.4.1. Entertainment
- 6.4.2. Retail
- 6.4.3. Hospitality
- 6.4.4. Healthcare
- 6.4.5. Commercial
- 6.4.6. Advertisement
- 6.4.7. Automotive
- 6.4.8. Education
- 6.4.9. Other Applications
- 6.1. Market Analysis, Insights and Forecast - by Type
- 7. Europe Surface Computing Market Analysis, Insights and Forecast, 2019-2031
- 7.1. Market Analysis, Insights and Forecast - by Type
- 7.1.1. Flat Display
- 7.1.2. Curved Display
- 7.1.3. Components
- 7.1.3.1. Screen
- 7.1.3.2. Camera
- 7.1.3.3. Sensor
- 7.1.3.4. Processor
- 7.1.3.5. Software
- 7.1.3.6. Projector
- 7.1.3.7. Other Components
- 7.2. Market Analysis, Insights and Forecast - by Touch
- 7.2.1. Single Touch
- 7.2.2. Multi-touch
- 7.2.3. Multi-user
- 7.2.4. Other Touches
- 7.3. Market Analysis, Insights and Forecast - by Vision
- 7.3.1. Two Dimensional
- 7.3.2. Three Dimensional
- 7.4. Market Analysis, Insights and Forecast - by Application
- 7.4.1. Entertainment
- 7.4.2. Retail
- 7.4.3. Hospitality
- 7.4.4. Healthcare
- 7.4.5. Commercial
- 7.4.6. Advertisement
- 7.4.7. Automotive
- 7.4.8. Education
- 7.4.9. Other Applications
- 7.1. Market Analysis, Insights and Forecast - by Type
- 8. Asia Surface Computing Market Analysis, Insights and Forecast, 2019-2031
- 8.1. Market Analysis, Insights and Forecast - by Type
- 8.1.1. Flat Display
- 8.1.2. Curved Display
- 8.1.3. Components
- 8.1.3.1. Screen
- 8.1.3.2. Camera
- 8.1.3.3. Sensor
- 8.1.3.4. Processor
- 8.1.3.5. Software
- 8.1.3.6. Projector
- 8.1.3.7. Other Components
- 8.2. Market Analysis, Insights and Forecast - by Touch
- 8.2.1. Single Touch
- 8.2.2. Multi-touch
- 8.2.3. Multi-user
- 8.2.4. Other Touches
- 8.3. Market Analysis, Insights and Forecast - by Vision
- 8.3.1. Two Dimensional
- 8.3.2. Three Dimensional
- 8.4. Market Analysis, Insights and Forecast - by Application
- 8.4.1. Entertainment
- 8.4.2. Retail
- 8.4.3. Hospitality
- 8.4.4. Healthcare
- 8.4.5. Commercial
- 8.4.6. Advertisement
- 8.4.7. Automotive
- 8.4.8. Education
- 8.4.9. Other Applications
- 8.1. Market Analysis, Insights and Forecast - by Type
- 9. Latin America Surface Computing Market Analysis, Insights and Forecast, 2019-2031
- 9.1. Market Analysis, Insights and Forecast - by Type
- 9.1.1. Flat Display
- 9.1.2. Curved Display
- 9.1.3. Components
- 9.1.3.1. Screen
- 9.1.3.2. Camera
- 9.1.3.3. Sensor
- 9.1.3.4. Processor
- 9.1.3.5. Software
- 9.1.3.6. Projector
- 9.1.3.7. Other Components
- 9.2. Market Analysis, Insights and Forecast - by Touch
- 9.2.1. Single Touch
- 9.2.2. Multi-touch
- 9.2.3. Multi-user
- 9.2.4. Other Touches
- 9.3. Market Analysis, Insights and Forecast - by Vision
- 9.3.1. Two Dimensional
- 9.3.2. Three Dimensional
- 9.4. Market Analysis, Insights and Forecast - by Application
- 9.4.1. Entertainment
- 9.4.2. Retail
- 9.4.3. Hospitality
- 9.4.4. Healthcare
- 9.4.5. Commercial
- 9.4.6. Advertisement
- 9.4.7. Automotive
- 9.4.8. Education
- 9.4.9. Other Applications
- 9.1. Market Analysis, Insights and Forecast - by Type
- 10. Middle East and Africa Surface Computing Market Analysis, Insights and Forecast, 2019-2031
- 10.1. Market Analysis, Insights and Forecast - by Type
- 10.1.1. Flat Display
- 10.1.2. Curved Display
- 10.1.3. Components
- 10.1.3.1. Screen
- 10.1.3.2. Camera
- 10.1.3.3. Sensor
- 10.1.3.4. Processor
- 10.1.3.5. Software
- 10.1.3.6. Projector
- 10.1.3.7. Other Components
- 10.2. Market Analysis, Insights and Forecast - by Touch
- 10.2.1. Single Touch
- 10.2.2. Multi-touch
- 10.2.3. Multi-user
- 10.2.4. Other Touches
- 10.3. Market Analysis, Insights and Forecast - by Vision
- 10.3.1. Two Dimensional
- 10.3.2. Three Dimensional
- 10.4. Market Analysis, Insights and Forecast - by Application
- 10.4.1. Entertainment
- 10.4.2. Retail
- 10.4.3. Hospitality
- 10.4.4. Healthcare
- 10.4.5. Commercial
- 10.4.6. Advertisement
- 10.4.7. Automotive
- 10.4.8. Education
- 10.4.9. Other Applications
- 10.1. Market Analysis, Insights and Forecast - by Type
- 11. North America Surface Computing Market Analysis, Insights and Forecast, 2019-2031
- 11.1. Market Analysis, Insights and Forecast - By Country/Sub-region
- 11.1.1 United States
- 11.1.2 Canada
- 12. Europe Surface Computing Market Analysis, Insights and Forecast, 2019-2031
- 12.1. Market Analysis, Insights and Forecast - By Country/Sub-region
- 12.1.1 United Kingdom
- 12.1.2 Germany
- 12.1.3 France
- 13. Asia Surface Computing Market Analysis, Insights and Forecast, 2019-2031
- 13.1. Market Analysis, Insights and Forecast - By Country/Sub-region
- 13.1.1 China
- 13.1.2 Japan
- 13.1.3 India
- 13.1.4 Australia and New Zealand
- 14. Latin America Surface Computing Market Analysis, Insights and Forecast, 2019-2031
- 14.1. Market Analysis, Insights and Forecast - By Country/Sub-region
- 14.1.1 Mexico
- 14.1.2 Brazil
- 14.1.3 Argentina
- 15. Middle East and Africa Surface Computing Market Analysis, Insights and Forecast, 2019-2031
- 15.1. Market Analysis, Insights and Forecast - By Country/Sub-region
- 15.1.1 Saudi Arabia
- 15.1.2 United Arab Emirates
- 15.1.3 South Africa
- 16. Competitive Analysis
- 16.1. Global Market Share Analysis 2024
- 16.2. Company Profiles
- 16.2.1 Viewsonic Corporation
- 16.2.1.1. Overview
- 16.2.1.2. Products
- 16.2.1.3. SWOT Analysis
- 16.2.1.4. Recent Developments
- 16.2.1.5. Financials (Based on Availability)
- 16.2.2 Samsung Electronic Co Ltd
- 16.2.2.1. Overview
- 16.2.2.2. Products
- 16.2.2.3. SWOT Analysis
- 16.2.2.4. Recent Developments
- 16.2.2.5. Financials (Based on Availability)
- 16.2.3 Acer Inc *List Not Exhaustive
- 16.2.3.1. Overview
- 16.2.3.2. Products
- 16.2.3.3. SWOT Analysis
- 16.2.3.4. Recent Developments
- 16.2.3.5. Financials (Based on Availability)
- 16.2.4 IBM Corporation
- 16.2.4.1. Overview
- 16.2.4.2. Products
- 16.2.4.3. SWOT Analysis
- 16.2.4.4. Recent Developments
- 16.2.4.5. Financials (Based on Availability)
- 16.2.5 Toshiba Corporation
- 16.2.5.1. Overview
- 16.2.5.2. Products
- 16.2.5.3. SWOT Analysis
- 16.2.5.4. Recent Developments
- 16.2.5.5. Financials (Based on Availability)
- 16.2.6 LG Electronics Inc
- 16.2.6.1. Overview
- 16.2.6.2. Products
- 16.2.6.3. SWOT Analysis
- 16.2.6.4. Recent Developments
- 16.2.6.5. Financials (Based on Availability)
- 16.2.7 Fujitsu Ltd
- 16.2.7.1. Overview
- 16.2.7.2. Products
- 16.2.7.3. SWOT Analysis
- 16.2.7.4. Recent Developments
- 16.2.7.5. Financials (Based on Availability)
- 16.2.8 Planar Systems Inc
- 16.2.8.1. Overview
- 16.2.8.2. Products
- 16.2.8.3. SWOT Analysis
- 16.2.8.4. Recent Developments
- 16.2.8.5. Financials (Based on Availability)
- 16.2.9 Microsoft Corporation
- 16.2.9.1. Overview
- 16.2.9.2. Products
- 16.2.9.3. SWOT Analysis
- 16.2.9.4. Recent Developments
- 16.2.9.5. Financials (Based on Availability)
- 16.2.10 Dell Inc
- 16.2.10.1. Overview
- 16.2.10.2. Products
- 16.2.10.3. SWOT Analysis
- 16.2.10.4. Recent Developments
- 16.2.10.5. Financials (Based on Availability)
- 16.2.11 3M Co
- 16.2.11.1. Overview
- 16.2.11.2. Products
- 16.2.11.3. SWOT Analysis
- 16.2.11.4. Recent Developments
- 16.2.11.5. Financials (Based on Availability)
- 16.2.12 Qualcomm Technologies Inc
- 16.2.12.1. Overview
- 16.2.12.2. Products
- 16.2.12.3. SWOT Analysis
- 16.2.12.4. Recent Developments
- 16.2.12.5. Financials (Based on Availability)
- 16.2.13 Hewlett-Packard Ltd
- 16.2.13.1. Overview
- 16.2.13.2. Products
- 16.2.13.3. SWOT Analysis
- 16.2.13.4. Recent Developments
- 16.2.13.5. Financials (Based on Availability)
- 16.2.14 Lenovo Group Ltd
- 16.2.14.1. Overview
- 16.2.14.2. Products
- 16.2.14.3. SWOT Analysis
- 16.2.14.4. Recent Developments
- 16.2.14.5. Financials (Based on Availability)
- 16.2.15 Apple Inc
- 16.2.15.1. Overview
- 16.2.15.2. Products
- 16.2.15.3. SWOT Analysis
- 16.2.15.4. Recent Developments
- 16.2.15.5. Financials (Based on Availability)
- 16.2.16 Panasonic Corporation
- 16.2.16.1. Overview
- 16.2.16.2. Products
- 16.2.16.3. SWOT Analysis
- 16.2.16.4. Recent Developments
- 16.2.16.5. Financials (Based on Availability)
- 16.2.17 Intel Corporation
- 16.2.17.1. Overview
- 16.2.17.2. Products
- 16.2.17.3. SWOT Analysis
- 16.2.17.4. Recent Developments
- 16.2.17.5. Financials (Based on Availability)
- 16.2.18 Sony Corporation
- 16.2.18.1. Overview
- 16.2.18.2. Products
- 16.2.18.3. SWOT Analysis
- 16.2.18.4. Recent Developments
- 16.2.18.5. Financials (Based on Availability)
- 16.2.1 Viewsonic Corporation
List of Figures
- Figure 1: Global Surface Computing Market Revenue Breakdown (Million, %) by Region 2024 & 2032
- Figure 2: North America Surface Computing Market Revenue (Million), by Country 2024 & 2032
- Figure 3: North America Surface Computing Market Revenue Share (%), by Country 2024 & 2032
- Figure 4: Europe Surface Computing Market Revenue (Million), by Country 2024 & 2032
- Figure 5: Europe Surface Computing Market Revenue Share (%), by Country 2024 & 2032
- Figure 6: Asia Surface Computing Market Revenue (Million), by Country 2024 & 2032
- Figure 7: Asia Surface Computing Market Revenue Share (%), by Country 2024 & 2032
- Figure 8: Latin America Surface Computing Market Revenue (Million), by Country 2024 & 2032
- Figure 9: Latin America Surface Computing Market Revenue Share (%), by Country 2024 & 2032
- Figure 10: Middle East and Africa Surface Computing Market Revenue (Million), by Country 2024 & 2032
- Figure 11: Middle East and Africa Surface Computing Market Revenue Share (%), by Country 2024 & 2032
- Figure 12: North America Surface Computing Market Revenue (Million), by Type 2024 & 2032
- Figure 13: North America Surface Computing Market Revenue Share (%), by Type 2024 & 2032
- Figure 14: North America Surface Computing Market Revenue (Million), by Touch 2024 & 2032
- Figure 15: North America Surface Computing Market Revenue Share (%), by Touch 2024 & 2032
- Figure 16: North America Surface Computing Market Revenue (Million), by Vision 2024 & 2032
- Figure 17: North America Surface Computing Market Revenue Share (%), by Vision 2024 & 2032
- Figure 18: North America Surface Computing Market Revenue (Million), by Application 2024 & 2032
- Figure 19: North America Surface Computing Market Revenue Share (%), by Application 2024 & 2032
- Figure 20: North America Surface Computing Market Revenue (Million), by Country 2024 & 2032
- Figure 21: North America Surface Computing Market Revenue Share (%), by Country 2024 & 2032
- Figure 22: Europe Surface Computing Market Revenue (Million), by Type 2024 & 2032
- Figure 23: Europe Surface Computing Market Revenue Share (%), by Type 2024 & 2032
- Figure 24: Europe Surface Computing Market Revenue (Million), by Touch 2024 & 2032
- Figure 25: Europe Surface Computing Market Revenue Share (%), by Touch 2024 & 2032
- Figure 26: Europe Surface Computing Market Revenue (Million), by Vision 2024 & 2032
- Figure 27: Europe Surface Computing Market Revenue Share (%), by Vision 2024 & 2032
- Figure 28: Europe Surface Computing Market Revenue (Million), by Application 2024 & 2032
- Figure 29: Europe Surface Computing Market Revenue Share (%), by Application 2024 & 2032
- Figure 30: Europe Surface Computing Market Revenue (Million), by Country 2024 & 2032
- Figure 31: Europe Surface Computing Market Revenue Share (%), by Country 2024 & 2032
- Figure 32: Asia Surface Computing Market Revenue (Million), by Type 2024 & 2032
- Figure 33: Asia Surface Computing Market Revenue Share (%), by Type 2024 & 2032
- Figure 34: Asia Surface Computing Market Revenue (Million), by Touch 2024 & 2032
- Figure 35: Asia Surface Computing Market Revenue Share (%), by Touch 2024 & 2032
- Figure 36: Asia Surface Computing Market Revenue (Million), by Vision 2024 & 2032
- Figure 37: Asia Surface Computing Market Revenue Share (%), by Vision 2024 & 2032
- Figure 38: Asia Surface Computing Market Revenue (Million), by Application 2024 & 2032
- Figure 39: Asia Surface Computing Market Revenue Share (%), by Application 2024 & 2032
- Figure 40: Asia Surface Computing Market Revenue (Million), by Country 2024 & 2032
- Figure 41: Asia Surface Computing Market Revenue Share (%), by Country 2024 & 2032
- Figure 42: Latin America Surface Computing Market Revenue (Million), by Type 2024 & 2032
- Figure 43: Latin America Surface Computing Market Revenue Share (%), by Type 2024 & 2032
- Figure 44: Latin America Surface Computing Market Revenue (Million), by Touch 2024 & 2032
- Figure 45: Latin America Surface Computing Market Revenue Share (%), by Touch 2024 & 2032
- Figure 46: Latin America Surface Computing Market Revenue (Million), by Vision 2024 & 2032
- Figure 47: Latin America Surface Computing Market Revenue Share (%), by Vision 2024 & 2032
- Figure 48: Latin America Surface Computing Market Revenue (Million), by Application 2024 & 2032
- Figure 49: Latin America Surface Computing Market Revenue Share (%), by Application 2024 & 2032
- Figure 50: Latin America Surface Computing Market Revenue (Million), by Country 2024 & 2032
- Figure 51: Latin America Surface Computing Market Revenue Share (%), by Country 2024 & 2032
- Figure 52: Middle East and Africa Surface Computing Market Revenue (Million), by Type 2024 & 2032
- Figure 53: Middle East and Africa Surface Computing Market Revenue Share (%), by Type 2024 & 2032
- Figure 54: Middle East and Africa Surface Computing Market Revenue (Million), by Touch 2024 & 2032
- Figure 55: Middle East and Africa Surface Computing Market Revenue Share (%), by Touch 2024 & 2032
- Figure 56: Middle East and Africa Surface Computing Market Revenue (Million), by Vision 2024 & 2032
- Figure 57: Middle East and Africa Surface Computing Market Revenue Share (%), by Vision 2024 & 2032
- Figure 58: Middle East and Africa Surface Computing Market Revenue (Million), by Application 2024 & 2032
- Figure 59: Middle East and Africa Surface Computing Market Revenue Share (%), by Application 2024 & 2032
- Figure 60: Middle East and Africa Surface Computing Market Revenue (Million), by Country 2024 & 2032
- Figure 61: Middle East and Africa Surface Computing Market Revenue Share (%), by Country 2024 & 2032
List of Tables
- Table 1: Global Surface Computing Market Revenue Million Forecast, by Region 2019 & 2032
- Table 2: Global Surface Computing Market Revenue Million Forecast, by Type 2019 & 2032
- Table 3: Global Surface Computing Market Revenue Million Forecast, by Touch 2019 & 2032
- Table 4: Global Surface Computing Market Revenue Million Forecast, by Vision 2019 & 2032
- Table 5: Global Surface Computing Market Revenue Million Forecast, by Application 2019 & 2032
- Table 6: Global Surface Computing Market Revenue Million Forecast, by Region 2019 & 2032
- Table 7: Global Surface Computing Market Revenue Million Forecast, by Country 2019 & 2032
- Table 8: United States Surface Computing Market Revenue (Million) Forecast, by Application 2019 & 2032
- Table 9: Canada Surface Computing Market Revenue (Million) Forecast, by Application 2019 & 2032
- Table 10: Global Surface Computing Market Revenue Million Forecast, by Country 2019 & 2032
- Table 11: United Kingdom Surface Computing Market Revenue (Million) Forecast, by Application 2019 & 2032
- Table 12: Germany Surface Computing Market Revenue (Million) Forecast, by Application 2019 & 2032
- Table 13: France Surface Computing Market Revenue (Million) Forecast, by Application 2019 & 2032
- Table 14: Global Surface Computing Market Revenue Million Forecast, by Country 2019 & 2032
- Table 15: China Surface Computing Market Revenue (Million) Forecast, by Application 2019 & 2032
- Table 16: Japan Surface Computing Market Revenue (Million) Forecast, by Application 2019 & 2032
- Table 17: India Surface Computing Market Revenue (Million) Forecast, by Application 2019 & 2032
- Table 18: Australia and New Zealand Surface Computing Market Revenue (Million) Forecast, by Application 2019 & 2032
- Table 19: Global Surface Computing Market Revenue Million Forecast, by Country 2019 & 2032
- Table 20: Mexico Surface Computing Market Revenue (Million) Forecast, by Application 2019 & 2032
- Table 21: Brazil Surface Computing Market Revenue (Million) Forecast, by Application 2019 & 2032
- Table 22: Argentina Surface Computing Market Revenue (Million) Forecast, by Application 2019 & 2032
- Table 23: Global Surface Computing Market Revenue Million Forecast, by Country 2019 & 2032
- Table 24: Saudi Arabia Surface Computing Market Revenue (Million) Forecast, by Application 2019 & 2032
- Table 25: United Arab Emirates Surface Computing Market Revenue (Million) Forecast, by Application 2019 & 2032
- Table 26: South Africa Surface Computing Market Revenue (Million) Forecast, by Application 2019 & 2032
- Table 27: Global Surface Computing Market Revenue Million Forecast, by Type 2019 & 2032
- Table 28: Global Surface Computing Market Revenue Million Forecast, by Touch 2019 & 2032
- Table 29: Global Surface Computing Market Revenue Million Forecast, by Vision 2019 & 2032
- Table 30: Global Surface Computing Market Revenue Million Forecast, by Application 2019 & 2032
- Table 31: Global Surface Computing Market Revenue Million Forecast, by Country 2019 & 2032
- Table 32: United States Surface Computing Market Revenue (Million) Forecast, by Application 2019 & 2032
- Table 33: Canada Surface Computing Market Revenue (Million) Forecast, by Application 2019 & 2032
- Table 34: Global Surface Computing Market Revenue Million Forecast, by Type 2019 & 2032
- Table 35: Global Surface Computing Market Revenue Million Forecast, by Touch 2019 & 2032
- Table 36: Global Surface Computing Market Revenue Million Forecast, by Vision 2019 & 2032
- Table 37: Global Surface Computing Market Revenue Million Forecast, by Application 2019 & 2032
- Table 38: Global Surface Computing Market Revenue Million Forecast, by Country 2019 & 2032
- Table 39: United Kingdom Surface Computing Market Revenue (Million) Forecast, by Application 2019 & 2032
- Table 40: Germany Surface Computing Market Revenue (Million) Forecast, by Application 2019 & 2032
- Table 41: France Surface Computing Market Revenue (Million) Forecast, by Application 2019 & 2032
- Table 42: Global Surface Computing Market Revenue Million Forecast, by Type 2019 & 2032
- Table 43: Global Surface Computing Market Revenue Million Forecast, by Touch 2019 & 2032
- Table 44: Global Surface Computing Market Revenue Million Forecast, by Vision 2019 & 2032
- Table 45: Global Surface Computing Market Revenue Million Forecast, by Application 2019 & 2032
- Table 46: Global Surface Computing Market Revenue Million Forecast, by Country 2019 & 2032
- Table 47: China Surface Computing Market Revenue (Million) Forecast, by Application 2019 & 2032
- Table 48: Japan Surface Computing Market Revenue (Million) Forecast, by Application 2019 & 2032
- Table 49: India Surface Computing Market Revenue (Million) Forecast, by Application 2019 & 2032
- Table 50: Australia and New Zealand Surface Computing Market Revenue (Million) Forecast, by Application 2019 & 2032
- Table 51: Global Surface Computing Market Revenue Million Forecast, by Type 2019 & 2032
- Table 52: Global Surface Computing Market Revenue Million Forecast, by Touch 2019 & 2032
- Table 53: Global Surface Computing Market Revenue Million Forecast, by Vision 2019 & 2032
- Table 54: Global Surface Computing Market Revenue Million Forecast, by Application 2019 & 2032
- Table 55: Global Surface Computing Market Revenue Million Forecast, by Country 2019 & 2032
- Table 56: Mexico Surface Computing Market Revenue (Million) Forecast, by Application 2019 & 2032
- Table 57: Brazil Surface Computing Market Revenue (Million) Forecast, by Application 2019 & 2032
- Table 58: Argentina Surface Computing Market Revenue (Million) Forecast, by Application 2019 & 2032
- Table 59: Global Surface Computing Market Revenue Million Forecast, by Type 2019 & 2032
- Table 60: Global Surface Computing Market Revenue Million Forecast, by Touch 2019 & 2032
- Table 61: Global Surface Computing Market Revenue Million Forecast, by Vision 2019 & 2032
- Table 62: Global Surface Computing Market Revenue Million Forecast, by Application 2019 & 2032
- Table 63: Global Surface Computing Market Revenue Million Forecast, by Country 2019 & 2032
- Table 64: Saudi Arabia Surface Computing Market Revenue (Million) Forecast, by Application 2019 & 2032
- Table 65: United Arab Emirates Surface Computing Market Revenue (Million) Forecast, by Application 2019 & 2032
- Table 66: South Africa Surface Computing Market Revenue (Million) Forecast, by Application 2019 & 2032
Frequently Asked Questions
1. What is the projected Compound Annual Growth Rate (CAGR) of the Surface Computing Market?
The projected CAGR is approximately 35.23%.
2. Which companies are prominent players in the Surface Computing Market?
Key companies in the market include Viewsonic Corporation, Samsung Electronic Co Ltd, Acer Inc *List Not Exhaustive, IBM Corporation, Toshiba Corporation, LG Electronics Inc, Fujitsu Ltd, Planar Systems Inc, Microsoft Corporation, Dell Inc, 3M Co, Qualcomm Technologies Inc, Hewlett-Packard Ltd, Lenovo Group Ltd, Apple Inc, Panasonic Corporation, Intel Corporation, Sony Corporation.
3. What are the main segments of the Surface Computing Market?
The market segments include Type, Touch, Vision, Application.
4. Can you provide details about the market size?
The market size is estimated to be USD 81.94 Million as of 2022.
5. What are some drivers contributing to market growth?
More Advanced and User-friendly Interface - Natural User Interface (NUI); Increasing Business Revenue Due to Adoption of Multi-user Tabletops.
6. What are the notable trends driving market growth?
The Retail Sector is Expected to Hold a Significant Market Share.
7. Are there any restraints impacting market growth?
Limited Availability of Features; High Cost of Surface Computers.
8. Can you provide examples of recent developments in the market?
May 2024 - Microsoft announced new computers with the company’s artificial intelligence tech built directly into them, boosting the race among tech giants to push out AI tools to the public and adding computer chips that are tailored to run AI technology to the company’s PCs and tablets will make AI tools and features run faster than if the technology runs through an internet connection, as most chatbots.
9. What pricing options are available for accessing the report?
Pricing options include single-user, multi-user, and enterprise licenses priced at USD 4750, USD 5250, and USD 8750 respectively.
10. Is the market size provided in terms of value or volume?
The market size is provided in terms of value, measured in Million.
11. Are there any specific market keywords associated with the report?
Yes, the market keyword associated with the report is "Surface Computing Market," which aids in identifying and referencing the specific market segment covered.
12. How do I determine which pricing option suits my needs best?
The pricing options vary based on user requirements and access needs. Individual users may opt for single-user licenses, while businesses requiring broader access may choose multi-user or enterprise licenses for cost-effective access to the report.
13. Are there any additional resources or data provided in the Surface Computing Market report?
While the report offers comprehensive insights, it's advisable to review the specific contents or supplementary materials provided to ascertain if additional resources or data are available.
14. How can I stay updated on further developments or reports in the Surface Computing Market?
To stay informed about further developments, trends, and reports in the Surface Computing Market, consider subscribing to industry newsletters, following relevant companies and organizations, or regularly checking reputable industry news sources and publications.
Methodology
Step 1 - Identification of Relevant Samples Size from Population Database


Step 2 - Approaches for Defining Global Market Size (Value, Volume* & Price*)

Note*: In applicable scenarios
Step 3 - Data Sources
Primary Research
- Web Analytics
- Survey Reports
- Research Institute
- Latest Research Reports
- Opinion Leaders
Secondary Research
- Annual Reports
- White Paper
- Latest Press Release
- Industry Association
- Paid Database
- Investor Presentations

Step 4 - Data Triangulation
Involves using different sources of information in order to increase the validity of a study
These sources are likely to be stakeholders in a program - participants, other researchers, program staff, other community members, and so on.
Then we put all data in single framework & apply various statistical tools to find out the dynamic on the market.
During the analysis stage, feedback from the stakeholder groups would be compared to determine areas of agreement as well as areas of divergence


