
Key Insights
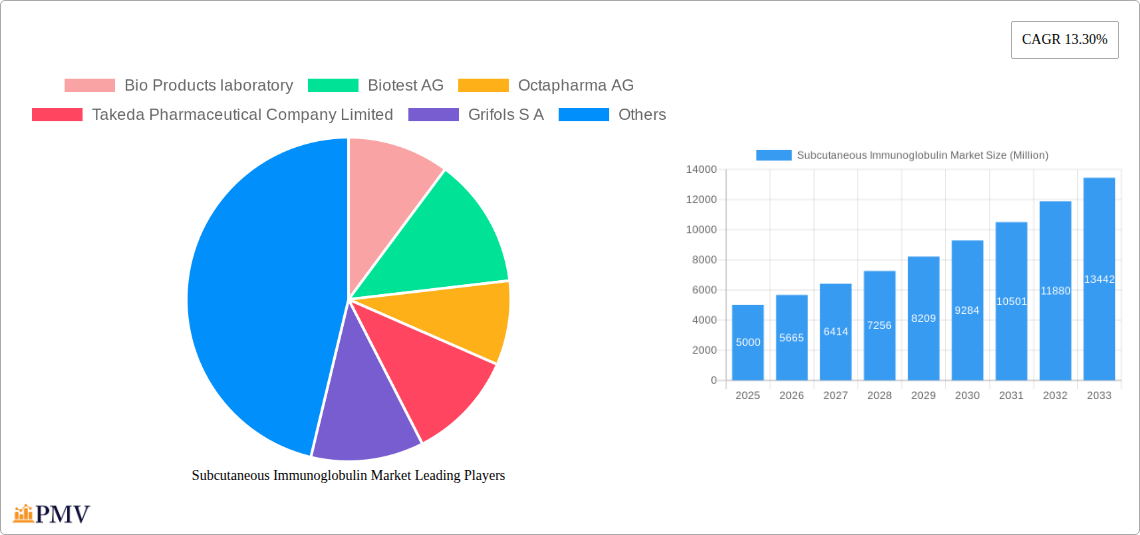
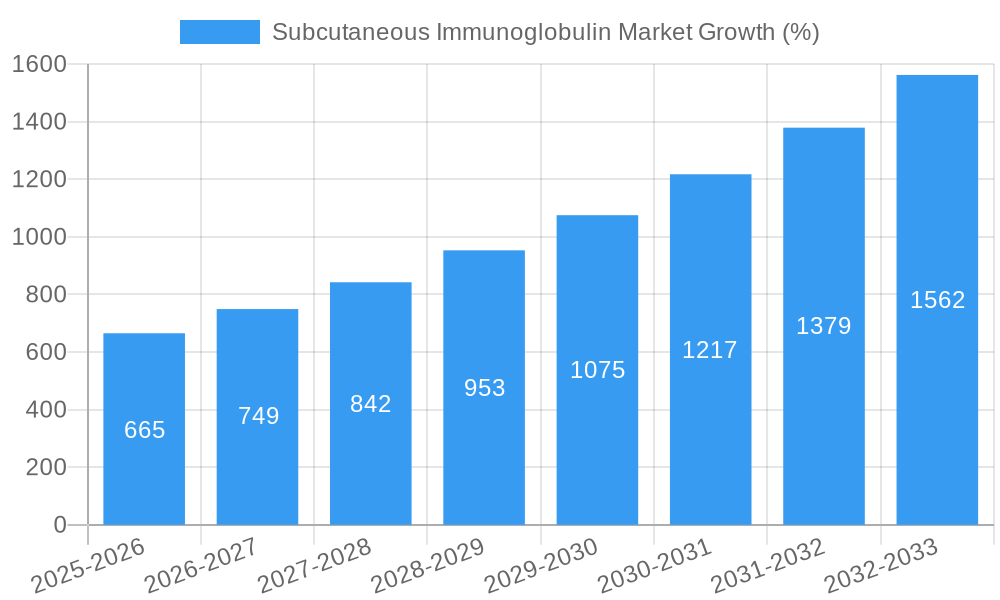
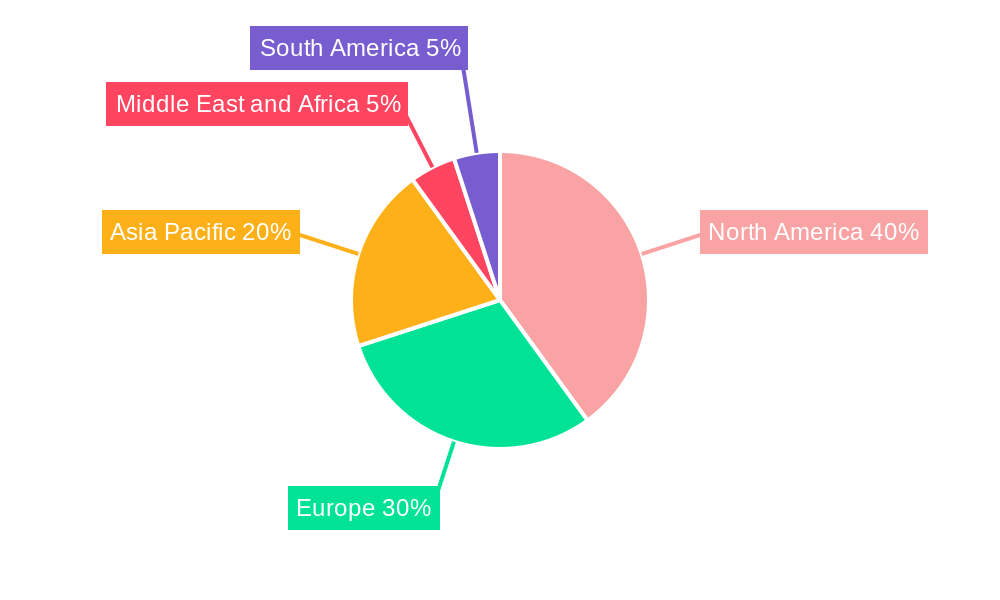
The subcutaneous immunoglobulin (SCIG) market is experiencing robust growth, driven by increasing prevalence of primary and secondary immunodeficiency diseases, rising awareness of SCIG therapy benefits, and technological advancements leading to improved product efficacy and patient convenience. The market's Compound Annual Growth Rate (CAGR) of 13.30% from 2019 to 2024 suggests a significant expansion, projected to continue into the forecast period (2025-2033). This growth is fueled by a shift towards home-based administration, reducing healthcare costs and improving patient quality of life. Key players like Bio Products Laboratory, Biotest AG, Octapharma AG, Takeda Pharmaceutical Company Limited, Grifols S.A., CSL Behring, and Kedrion S.p.A. are actively contributing to market expansion through research and development, product innovation, and strategic partnerships. The North American market currently holds a substantial share due to high healthcare expenditure and advanced healthcare infrastructure, while the Asia-Pacific region is expected to witness significant growth driven by rising disposable incomes and increasing awareness about immunodeficiency disorders. However, high treatment costs and potential side effects associated with SCIG therapy pose challenges to market growth. Segmentation by application (primary vs. secondary immunodeficiency) and end-user (hospitals vs. homecare settings) provides valuable insights into specific market dynamics, informing strategic decision-making for stakeholders.
The market segmentation reveals differing growth trajectories within the SCIG market. The primary immunodeficiency diseases segment likely holds a larger market share due to the inherent severity and chronic nature of these conditions. However, the secondary immunodeficiency diseases segment is poised for substantial growth as the understanding of its prevalence increases and treatment options expand. The shift towards homecare settings is further accelerating market growth, driven by increasing demand for convenient and cost-effective treatment options. This necessitates further development of user-friendly administration devices and enhanced patient support programs. Geographical expansion, particularly in emerging markets with growing healthcare infrastructure and increasing awareness, is a key growth strategy for companies in the SCIG market. Regulatory approvals and pricing policies will also continue to play a significant role in shaping the market's trajectory in the coming years. Ultimately, the forecast period suggests a promising outlook for the SCIG market, with opportunities for continued expansion driven by clinical advancements, technological innovations, and unmet patient needs.
Subcutaneous Immunoglobulin Market: A Comprehensive Report (2019-2033)
This comprehensive report provides an in-depth analysis of the Subcutaneous Immunoglobulin market, offering valuable insights into market dynamics, competitive landscapes, and future growth opportunities. Covering the period from 2019 to 2033, with a base year of 2025 and a forecast period of 2025-2033, this report is essential for businesses, investors, and stakeholders seeking to understand and navigate this evolving market. The global market is projected to reach xx Million by 2033, exhibiting a CAGR of xx% during the forecast period.
Subcutaneous Immunoglobulin Market Market Structure & Competitive Dynamics
The subcutaneous immunoglobulin market is characterized by a moderately concentrated structure, with a few major players holding significant market share. These key players are engaged in intense competition, driving innovation and influencing market dynamics. The market exhibits a dynamic innovation ecosystem, with ongoing research and development efforts focusing on improving product efficacy, safety, and convenience. Stringent regulatory frameworks, varying across different regions, play a significant role in shaping the market landscape. Product substitutes, such as intravenous immunoglobulin (IVIG), exist but often lack the convenience and ease of administration offered by subcutaneous formulations. End-user trends, particularly the growing preference for homecare settings, are shaping demand. Mergers and acquisitions (M&A) activities have played a crucial role in market consolidation and expansion. For instance, while specific M&A deal values are not publicly available for this specific market segment, we estimate that M&A activity contributed to approximately xx Million in market value between 2019 and 2024. Market share analysis reveals that the top five players collectively account for approximately xx% of the global market.
- Market Concentration: Moderately concentrated, with a few dominant players.
- Innovation Ecosystem: Active R&D focused on efficacy, safety, and convenience.
- Regulatory Frameworks: Stringent and varying across regions.
- Product Substitutes: IVIG exists but lacks the convenience of subcutaneous formulations.
- End-User Trends: Increasing preference for homecare settings.
- M&A Activities: Significant role in market consolidation and expansion.
Subcutaneous Immunoglobulin Market Industry Trends & Insights
The subcutaneous immunoglobulin market is experiencing robust growth, driven by several key factors. The increasing prevalence of primary and secondary immunodeficiency diseases is a primary driver, fueling demand for effective treatment options. Technological advancements, such as the development of more concentrated formulations and improved delivery systems, are enhancing the convenience and efficacy of subcutaneous immunoglobulin therapy. Changes in consumer preferences towards home-based treatment options are also contributing to market expansion. The competitive landscape is characterized by intense rivalry among leading players, leading to ongoing product innovation and improved market penetration. This competitive pressure is fostering improved accessibility, affordability, and treatment outcomes. The market penetration rate for subcutaneous immunoglobulin is estimated to be at xx% in 2025, projected to rise to xx% by 2033. The market is expected to exhibit a CAGR of xx% during the forecast period (2025-2033).
Dominant Markets & Segments in Subcutaneous Immunoglobulin Market
The North American region currently holds the dominant position in the subcutaneous immunoglobulin market, driven by factors such as high prevalence of immunodeficiency disorders, well-established healthcare infrastructure, and high disposable incomes. Within the application segments, Primary Immunodeficiency Diseases represents the largest segment, owing to the significant patient population and higher treatment needs. Hospitals currently dominate the end-user segment, followed by homecare settings, which are witnessing significant growth due to increased patient preference for convenient and cost-effective treatment at home.
- Leading Region: North America
- Key Drivers: High prevalence of immunodeficiency disorders, well-developed healthcare infrastructure, high disposable incomes.
- Dominant Application Segment: Primary Immunodeficiency Diseases
- Key Drivers: Significant patient population, higher treatment needs.
- Leading End-User Segment: Hospitals
- Key Drivers: Established infrastructure, expertise in administering complex treatments.
- Homecare Settings Growth: Increasing preference for convenience and cost-effectiveness.
Subcutaneous Immunoglobulin Market Product Innovations
Recent innovations in subcutaneous immunoglobulin products focus on developing higher-concentrated formulations to reduce injection volume and improve patient convenience. New delivery systems, including pre-filled syringes and auto-injectors, are also enhancing ease of administration. These advancements improve patient compliance and therapeutic outcomes, directly enhancing market appeal and competitive advantages. The incorporation of advanced technologies is driving the development of next-generation subcutaneous immunoglobulin products with improved efficacy and safety profiles.
Report Segmentation & Scope
This report segments the subcutaneous immunoglobulin market by application (Primary Immunodeficiency Diseases, Secondary Immunodeficiency Diseases, Others) and by end-user (Hospitals, Homecare Settings, Others). Each segment is analyzed in detail, providing insights into growth projections, market size, and competitive dynamics. For example, the Primary Immunodeficiency Diseases segment is expected to experience significant growth due to the increasing prevalence of these disorders. The Homecare Settings segment is also projected to witness rapid growth, driven by the preference for convenient and cost-effective home-based treatment. The "Others" segments in both application and end-user categories are expected to exhibit steady growth, contributing to the overall market expansion.
Key Drivers of Subcutaneous Immunoglobulin Market Growth
Several factors are driving the growth of the subcutaneous immunoglobulin market, including the increasing prevalence of primary and secondary immunodeficiency diseases, the development of more convenient and efficacious subcutaneous formulations, and the rising adoption of home healthcare settings. Furthermore, favorable reimbursement policies and supportive regulatory frameworks in many countries are also boosting market expansion. Technological advancements, including the development of innovative delivery systems and higher-concentration formulations, are significantly contributing to market growth.
Challenges in the Subcutaneous Immunoglobulin Market Sector
Despite the positive growth outlook, the subcutaneous immunoglobulin market faces several challenges. High production costs and complex manufacturing processes can impact affordability and accessibility. Stringent regulatory approvals and varying reimbursement policies across different regions can create hurdles for market entry and expansion. Competition from alternative therapies and potential supply chain disruptions can also pose significant challenges to market growth. These factors combined could negatively impact the market’s ability to achieve projected growth rates. We estimate these challenges could result in a xx Million reduction in projected market value by 2033.
Leading Players in the Subcutaneous Immunoglobulin Market Market
- Bio Products Laboratory
- Biotest AG
- Octapharma AG
- Takeda Pharmaceutical Company Limited
- Grifols S.A.
- CSL Behring
- Kedrion S.p.A
Key Developments in Subcutaneous Immunoglobulin Market Sector
- August 2022: Genentech (Roche Group) announced that its Phase III IMscin001 study evaluating a subcutaneous formulation of Tecentriq (atezolizumab) met its co-primary endpoints. This development signals a shift toward subcutaneous administration for certain cancer treatments.
- April 2022: Kite Pharma Inc. received FDA approval for axicabtagene ciloleucel (Yescarta) for adult patients with large B-cell lymphoma (LBCL). This approval broadened the treatment options for lymphoma, indirectly impacting the demand for immunoglobulins in specific patient populations.
Strategic Subcutaneous Immunoglobulin Market Market Outlook
The subcutaneous immunoglobulin market presents significant growth potential, driven by ongoing technological advancements, increasing prevalence of immunodeficiency disorders, and a shift toward convenient home-based treatment options. Strategic opportunities lie in developing innovative formulations, expanding into emerging markets, and forging strategic partnerships to enhance market penetration. Focus on improving patient accessibility and affordability will play a crucial role in realizing the full market potential. Further research focusing on novel delivery mechanisms and personalized medicine approaches holds significant promise for future market growth.
Subcutaneous Immunoglobulin Market Segmentation
-
1. Application
- 1.1. Primary Immunodeficiency Diseases
- 1.2. Secondary Immunodeficiency Diseases
- 1.3. Other Applications
-
2. End User
- 2.1. Hospitals
- 2.2. Homecare Settings
- 2.3. Other End Users
Subcutaneous Immunoglobulin Market Segmentation By Geography
-
1. North America
- 1.1. United States
- 1.2. Canada
- 1.3. Mexico
-
2. Europe
- 2.1. Germany
- 2.2. United Kingdom
- 2.3. France
- 2.4. Italy
- 2.5. Spain
- 2.6. Rest of Europe
-
3. Asia Pacific
- 3.1. China
- 3.2. Japan
- 3.3. India
- 3.4. Australia
- 3.5. South Korea
- 3.6. Rest of Asia Pacific
-
4. Middle East and Africa
- 4.1. GCC
- 4.2. South Africa
- 4.3. Rest of Middle East and Africa
-
5. South America
- 5.1. Brazil
- 5.2. Argentina
- 5.3. Rest of South America
Subcutaneous Immunoglobulin Market REPORT HIGHLIGHTS
| Aspects | Details |
|---|---|
| Study Period | 2019-2033 |
| Base Year | 2024 |
| Estimated Year | 2025 |
| Forecast Period | 2025-2033 |
| Historical Period | 2019-2024 |
| Growth Rate | CAGR of 13.30% from 2019-2033 |
| Segmentation |
|
Table of Contents
- 1. Introduction
- 1.1. Research Scope
- 1.2. Market Segmentation
- 1.3. Research Methodology
- 1.4. Definitions and Assumptions
- 2. Executive Summary
- 2.1. Introduction
- 3. Market Dynamics
- 3.1. Introduction
- 3.2. Market Drivers
- 3.2.1. Increasing Use of Subcutaneous Immunoglobulin For Primary Immunodeficiency Disorders; Increasing Geriatric Population and Patient Pool; Rise in Government Funding
- 3.3. Market Restrains
- 3.3.1. Stringent Government Regulations; High Risk of Side Effects
- 3.4. Market Trends
- 3.4.1. Secondary Immunodeficiency Diseases are Expected to Witness a Strong Growth Over the Forecast Period
- 4. Market Factor Analysis
- 4.1. Porters Five Forces
- 4.2. Supply/Value Chain
- 4.3. PESTEL analysis
- 4.4. Market Entropy
- 4.5. Patent/Trademark Analysis
- 5. Global Subcutaneous Immunoglobulin Market Analysis, Insights and Forecast, 2019-2031
- 5.1. Market Analysis, Insights and Forecast - by Application
- 5.1.1. Primary Immunodeficiency Diseases
- 5.1.2. Secondary Immunodeficiency Diseases
- 5.1.3. Other Applications
- 5.2. Market Analysis, Insights and Forecast - by End User
- 5.2.1. Hospitals
- 5.2.2. Homecare Settings
- 5.2.3. Other End Users
- 5.3. Market Analysis, Insights and Forecast - by Region
- 5.3.1. North America
- 5.3.2. Europe
- 5.3.3. Asia Pacific
- 5.3.4. Middle East and Africa
- 5.3.5. South America
- 5.1. Market Analysis, Insights and Forecast - by Application
- 6. North America Subcutaneous Immunoglobulin Market Analysis, Insights and Forecast, 2019-2031
- 6.1. Market Analysis, Insights and Forecast - by Application
- 6.1.1. Primary Immunodeficiency Diseases
- 6.1.2. Secondary Immunodeficiency Diseases
- 6.1.3. Other Applications
- 6.2. Market Analysis, Insights and Forecast - by End User
- 6.2.1. Hospitals
- 6.2.2. Homecare Settings
- 6.2.3. Other End Users
- 6.1. Market Analysis, Insights and Forecast - by Application
- 7. Europe Subcutaneous Immunoglobulin Market Analysis, Insights and Forecast, 2019-2031
- 7.1. Market Analysis, Insights and Forecast - by Application
- 7.1.1. Primary Immunodeficiency Diseases
- 7.1.2. Secondary Immunodeficiency Diseases
- 7.1.3. Other Applications
- 7.2. Market Analysis, Insights and Forecast - by End User
- 7.2.1. Hospitals
- 7.2.2. Homecare Settings
- 7.2.3. Other End Users
- 7.1. Market Analysis, Insights and Forecast - by Application
- 8. Asia Pacific Subcutaneous Immunoglobulin Market Analysis, Insights and Forecast, 2019-2031
- 8.1. Market Analysis, Insights and Forecast - by Application
- 8.1.1. Primary Immunodeficiency Diseases
- 8.1.2. Secondary Immunodeficiency Diseases
- 8.1.3. Other Applications
- 8.2. Market Analysis, Insights and Forecast - by End User
- 8.2.1. Hospitals
- 8.2.2. Homecare Settings
- 8.2.3. Other End Users
- 8.1. Market Analysis, Insights and Forecast - by Application
- 9. Middle East and Africa Subcutaneous Immunoglobulin Market Analysis, Insights and Forecast, 2019-2031
- 9.1. Market Analysis, Insights and Forecast - by Application
- 9.1.1. Primary Immunodeficiency Diseases
- 9.1.2. Secondary Immunodeficiency Diseases
- 9.1.3. Other Applications
- 9.2. Market Analysis, Insights and Forecast - by End User
- 9.2.1. Hospitals
- 9.2.2. Homecare Settings
- 9.2.3. Other End Users
- 9.1. Market Analysis, Insights and Forecast - by Application
- 10. South America Subcutaneous Immunoglobulin Market Analysis, Insights and Forecast, 2019-2031
- 10.1. Market Analysis, Insights and Forecast - by Application
- 10.1.1. Primary Immunodeficiency Diseases
- 10.1.2. Secondary Immunodeficiency Diseases
- 10.1.3. Other Applications
- 10.2. Market Analysis, Insights and Forecast - by End User
- 10.2.1. Hospitals
- 10.2.2. Homecare Settings
- 10.2.3. Other End Users
- 10.1. Market Analysis, Insights and Forecast - by Application
- 11. North America Subcutaneous Immunoglobulin Market Analysis, Insights and Forecast, 2019-2031
- 11.1. Market Analysis, Insights and Forecast - By Country/Sub-region
- 11.1.1 United States
- 11.1.2 Canada
- 11.1.3 Mexico
- 12. Europe Subcutaneous Immunoglobulin Market Analysis, Insights and Forecast, 2019-2031
- 12.1. Market Analysis, Insights and Forecast - By Country/Sub-region
- 12.1.1 Germany
- 12.1.2 United Kingdom
- 12.1.3 France
- 12.1.4 Italy
- 12.1.5 Spain
- 12.1.6 Rest of Europe
- 13. Asia Pacific Subcutaneous Immunoglobulin Market Analysis, Insights and Forecast, 2019-2031
- 13.1. Market Analysis, Insights and Forecast - By Country/Sub-region
- 13.1.1 China
- 13.1.2 Japan
- 13.1.3 India
- 13.1.4 Australia
- 13.1.5 South Korea
- 13.1.6 Rest of Asia Pacific
- 14. Middle East and Africa Subcutaneous Immunoglobulin Market Analysis, Insights and Forecast, 2019-2031
- 14.1. Market Analysis, Insights and Forecast - By Country/Sub-region
- 14.1.1 GCC
- 14.1.2 South Africa
- 14.1.3 Rest of Middle East and Africa
- 15. South America Subcutaneous Immunoglobulin Market Analysis, Insights and Forecast, 2019-2031
- 15.1. Market Analysis, Insights and Forecast - By Country/Sub-region
- 15.1.1 Brazil
- 15.1.2 Argentina
- 15.1.3 Rest of South America
- 16. Competitive Analysis
- 16.1. Global Market Share Analysis 2024
- 16.2. Company Profiles
- 16.2.1 Bio Products laboratory
- 16.2.1.1. Overview
- 16.2.1.2. Products
- 16.2.1.3. SWOT Analysis
- 16.2.1.4. Recent Developments
- 16.2.1.5. Financials (Based on Availability)
- 16.2.2 Biotest AG
- 16.2.2.1. Overview
- 16.2.2.2. Products
- 16.2.2.3. SWOT Analysis
- 16.2.2.4. Recent Developments
- 16.2.2.5. Financials (Based on Availability)
- 16.2.3 Octapharma AG
- 16.2.3.1. Overview
- 16.2.3.2. Products
- 16.2.3.3. SWOT Analysis
- 16.2.3.4. Recent Developments
- 16.2.3.5. Financials (Based on Availability)
- 16.2.4 Takeda Pharmaceutical Company Limited
- 16.2.4.1. Overview
- 16.2.4.2. Products
- 16.2.4.3. SWOT Analysis
- 16.2.4.4. Recent Developments
- 16.2.4.5. Financials (Based on Availability)
- 16.2.5 Grifols S A
- 16.2.5.1. Overview
- 16.2.5.2. Products
- 16.2.5.3. SWOT Analysis
- 16.2.5.4. Recent Developments
- 16.2.5.5. Financials (Based on Availability)
- 16.2.6 CSL Behring
- 16.2.6.1. Overview
- 16.2.6.2. Products
- 16.2.6.3. SWOT Analysis
- 16.2.6.4. Recent Developments
- 16.2.6.5. Financials (Based on Availability)
- 16.2.7 Kedrion S p A
- 16.2.7.1. Overview
- 16.2.7.2. Products
- 16.2.7.3. SWOT Analysis
- 16.2.7.4. Recent Developments
- 16.2.7.5. Financials (Based on Availability)
- 16.2.1 Bio Products laboratory
List of Figures
- Figure 1: Global Subcutaneous Immunoglobulin Market Revenue Breakdown (Million, %) by Region 2024 & 2032
- Figure 2: Global Subcutaneous Immunoglobulin Market Volume Breakdown (K Unit, %) by Region 2024 & 2032
- Figure 3: North America Subcutaneous Immunoglobulin Market Revenue (Million), by Country 2024 & 2032
- Figure 4: North America Subcutaneous Immunoglobulin Market Volume (K Unit), by Country 2024 & 2032
- Figure 5: North America Subcutaneous Immunoglobulin Market Revenue Share (%), by Country 2024 & 2032
- Figure 6: North America Subcutaneous Immunoglobulin Market Volume Share (%), by Country 2024 & 2032
- Figure 7: Europe Subcutaneous Immunoglobulin Market Revenue (Million), by Country 2024 & 2032
- Figure 8: Europe Subcutaneous Immunoglobulin Market Volume (K Unit), by Country 2024 & 2032
- Figure 9: Europe Subcutaneous Immunoglobulin Market Revenue Share (%), by Country 2024 & 2032
- Figure 10: Europe Subcutaneous Immunoglobulin Market Volume Share (%), by Country 2024 & 2032
- Figure 11: Asia Pacific Subcutaneous Immunoglobulin Market Revenue (Million), by Country 2024 & 2032
- Figure 12: Asia Pacific Subcutaneous Immunoglobulin Market Volume (K Unit), by Country 2024 & 2032
- Figure 13: Asia Pacific Subcutaneous Immunoglobulin Market Revenue Share (%), by Country 2024 & 2032
- Figure 14: Asia Pacific Subcutaneous Immunoglobulin Market Volume Share (%), by Country 2024 & 2032
- Figure 15: Middle East and Africa Subcutaneous Immunoglobulin Market Revenue (Million), by Country 2024 & 2032
- Figure 16: Middle East and Africa Subcutaneous Immunoglobulin Market Volume (K Unit), by Country 2024 & 2032
- Figure 17: Middle East and Africa Subcutaneous Immunoglobulin Market Revenue Share (%), by Country 2024 & 2032
- Figure 18: Middle East and Africa Subcutaneous Immunoglobulin Market Volume Share (%), by Country 2024 & 2032
- Figure 19: South America Subcutaneous Immunoglobulin Market Revenue (Million), by Country 2024 & 2032
- Figure 20: South America Subcutaneous Immunoglobulin Market Volume (K Unit), by Country 2024 & 2032
- Figure 21: South America Subcutaneous Immunoglobulin Market Revenue Share (%), by Country 2024 & 2032
- Figure 22: South America Subcutaneous Immunoglobulin Market Volume Share (%), by Country 2024 & 2032
- Figure 23: North America Subcutaneous Immunoglobulin Market Revenue (Million), by Application 2024 & 2032
- Figure 24: North America Subcutaneous Immunoglobulin Market Volume (K Unit), by Application 2024 & 2032
- Figure 25: North America Subcutaneous Immunoglobulin Market Revenue Share (%), by Application 2024 & 2032
- Figure 26: North America Subcutaneous Immunoglobulin Market Volume Share (%), by Application 2024 & 2032
- Figure 27: North America Subcutaneous Immunoglobulin Market Revenue (Million), by End User 2024 & 2032
- Figure 28: North America Subcutaneous Immunoglobulin Market Volume (K Unit), by End User 2024 & 2032
- Figure 29: North America Subcutaneous Immunoglobulin Market Revenue Share (%), by End User 2024 & 2032
- Figure 30: North America Subcutaneous Immunoglobulin Market Volume Share (%), by End User 2024 & 2032
- Figure 31: North America Subcutaneous Immunoglobulin Market Revenue (Million), by Country 2024 & 2032
- Figure 32: North America Subcutaneous Immunoglobulin Market Volume (K Unit), by Country 2024 & 2032
- Figure 33: North America Subcutaneous Immunoglobulin Market Revenue Share (%), by Country 2024 & 2032
- Figure 34: North America Subcutaneous Immunoglobulin Market Volume Share (%), by Country 2024 & 2032
- Figure 35: Europe Subcutaneous Immunoglobulin Market Revenue (Million), by Application 2024 & 2032
- Figure 36: Europe Subcutaneous Immunoglobulin Market Volume (K Unit), by Application 2024 & 2032
- Figure 37: Europe Subcutaneous Immunoglobulin Market Revenue Share (%), by Application 2024 & 2032
- Figure 38: Europe Subcutaneous Immunoglobulin Market Volume Share (%), by Application 2024 & 2032
- Figure 39: Europe Subcutaneous Immunoglobulin Market Revenue (Million), by End User 2024 & 2032
- Figure 40: Europe Subcutaneous Immunoglobulin Market Volume (K Unit), by End User 2024 & 2032
- Figure 41: Europe Subcutaneous Immunoglobulin Market Revenue Share (%), by End User 2024 & 2032
- Figure 42: Europe Subcutaneous Immunoglobulin Market Volume Share (%), by End User 2024 & 2032
- Figure 43: Europe Subcutaneous Immunoglobulin Market Revenue (Million), by Country 2024 & 2032
- Figure 44: Europe Subcutaneous Immunoglobulin Market Volume (K Unit), by Country 2024 & 2032
- Figure 45: Europe Subcutaneous Immunoglobulin Market Revenue Share (%), by Country 2024 & 2032
- Figure 46: Europe Subcutaneous Immunoglobulin Market Volume Share (%), by Country 2024 & 2032
- Figure 47: Asia Pacific Subcutaneous Immunoglobulin Market Revenue (Million), by Application 2024 & 2032
- Figure 48: Asia Pacific Subcutaneous Immunoglobulin Market Volume (K Unit), by Application 2024 & 2032
- Figure 49: Asia Pacific Subcutaneous Immunoglobulin Market Revenue Share (%), by Application 2024 & 2032
- Figure 50: Asia Pacific Subcutaneous Immunoglobulin Market Volume Share (%), by Application 2024 & 2032
- Figure 51: Asia Pacific Subcutaneous Immunoglobulin Market Revenue (Million), by End User 2024 & 2032
- Figure 52: Asia Pacific Subcutaneous Immunoglobulin Market Volume (K Unit), by End User 2024 & 2032
- Figure 53: Asia Pacific Subcutaneous Immunoglobulin Market Revenue Share (%), by End User 2024 & 2032
- Figure 54: Asia Pacific Subcutaneous Immunoglobulin Market Volume Share (%), by End User 2024 & 2032
- Figure 55: Asia Pacific Subcutaneous Immunoglobulin Market Revenue (Million), by Country 2024 & 2032
- Figure 56: Asia Pacific Subcutaneous Immunoglobulin Market Volume (K Unit), by Country 2024 & 2032
- Figure 57: Asia Pacific Subcutaneous Immunoglobulin Market Revenue Share (%), by Country 2024 & 2032
- Figure 58: Asia Pacific Subcutaneous Immunoglobulin Market Volume Share (%), by Country 2024 & 2032
- Figure 59: Middle East and Africa Subcutaneous Immunoglobulin Market Revenue (Million), by Application 2024 & 2032
- Figure 60: Middle East and Africa Subcutaneous Immunoglobulin Market Volume (K Unit), by Application 2024 & 2032
- Figure 61: Middle East and Africa Subcutaneous Immunoglobulin Market Revenue Share (%), by Application 2024 & 2032
- Figure 62: Middle East and Africa Subcutaneous Immunoglobulin Market Volume Share (%), by Application 2024 & 2032
- Figure 63: Middle East and Africa Subcutaneous Immunoglobulin Market Revenue (Million), by End User 2024 & 2032
- Figure 64: Middle East and Africa Subcutaneous Immunoglobulin Market Volume (K Unit), by End User 2024 & 2032
- Figure 65: Middle East and Africa Subcutaneous Immunoglobulin Market Revenue Share (%), by End User 2024 & 2032
- Figure 66: Middle East and Africa Subcutaneous Immunoglobulin Market Volume Share (%), by End User 2024 & 2032
- Figure 67: Middle East and Africa Subcutaneous Immunoglobulin Market Revenue (Million), by Country 2024 & 2032
- Figure 68: Middle East and Africa Subcutaneous Immunoglobulin Market Volume (K Unit), by Country 2024 & 2032
- Figure 69: Middle East and Africa Subcutaneous Immunoglobulin Market Revenue Share (%), by Country 2024 & 2032
- Figure 70: Middle East and Africa Subcutaneous Immunoglobulin Market Volume Share (%), by Country 2024 & 2032
- Figure 71: South America Subcutaneous Immunoglobulin Market Revenue (Million), by Application 2024 & 2032
- Figure 72: South America Subcutaneous Immunoglobulin Market Volume (K Unit), by Application 2024 & 2032
- Figure 73: South America Subcutaneous Immunoglobulin Market Revenue Share (%), by Application 2024 & 2032
- Figure 74: South America Subcutaneous Immunoglobulin Market Volume Share (%), by Application 2024 & 2032
- Figure 75: South America Subcutaneous Immunoglobulin Market Revenue (Million), by End User 2024 & 2032
- Figure 76: South America Subcutaneous Immunoglobulin Market Volume (K Unit), by End User 2024 & 2032
- Figure 77: South America Subcutaneous Immunoglobulin Market Revenue Share (%), by End User 2024 & 2032
- Figure 78: South America Subcutaneous Immunoglobulin Market Volume Share (%), by End User 2024 & 2032
- Figure 79: South America Subcutaneous Immunoglobulin Market Revenue (Million), by Country 2024 & 2032
- Figure 80: South America Subcutaneous Immunoglobulin Market Volume (K Unit), by Country 2024 & 2032
- Figure 81: South America Subcutaneous Immunoglobulin Market Revenue Share (%), by Country 2024 & 2032
- Figure 82: South America Subcutaneous Immunoglobulin Market Volume Share (%), by Country 2024 & 2032
List of Tables
- Table 1: Global Subcutaneous Immunoglobulin Market Revenue Million Forecast, by Region 2019 & 2032
- Table 2: Global Subcutaneous Immunoglobulin Market Volume K Unit Forecast, by Region 2019 & 2032
- Table 3: Global Subcutaneous Immunoglobulin Market Revenue Million Forecast, by Application 2019 & 2032
- Table 4: Global Subcutaneous Immunoglobulin Market Volume K Unit Forecast, by Application 2019 & 2032
- Table 5: Global Subcutaneous Immunoglobulin Market Revenue Million Forecast, by End User 2019 & 2032
- Table 6: Global Subcutaneous Immunoglobulin Market Volume K Unit Forecast, by End User 2019 & 2032
- Table 7: Global Subcutaneous Immunoglobulin Market Revenue Million Forecast, by Region 2019 & 2032
- Table 8: Global Subcutaneous Immunoglobulin Market Volume K Unit Forecast, by Region 2019 & 2032
- Table 9: Global Subcutaneous Immunoglobulin Market Revenue Million Forecast, by Country 2019 & 2032
- Table 10: Global Subcutaneous Immunoglobulin Market Volume K Unit Forecast, by Country 2019 & 2032
- Table 11: United States Subcutaneous Immunoglobulin Market Revenue (Million) Forecast, by Application 2019 & 2032
- Table 12: United States Subcutaneous Immunoglobulin Market Volume (K Unit) Forecast, by Application 2019 & 2032
- Table 13: Canada Subcutaneous Immunoglobulin Market Revenue (Million) Forecast, by Application 2019 & 2032
- Table 14: Canada Subcutaneous Immunoglobulin Market Volume (K Unit) Forecast, by Application 2019 & 2032
- Table 15: Mexico Subcutaneous Immunoglobulin Market Revenue (Million) Forecast, by Application 2019 & 2032
- Table 16: Mexico Subcutaneous Immunoglobulin Market Volume (K Unit) Forecast, by Application 2019 & 2032
- Table 17: Global Subcutaneous Immunoglobulin Market Revenue Million Forecast, by Country 2019 & 2032
- Table 18: Global Subcutaneous Immunoglobulin Market Volume K Unit Forecast, by Country 2019 & 2032
- Table 19: Germany Subcutaneous Immunoglobulin Market Revenue (Million) Forecast, by Application 2019 & 2032
- Table 20: Germany Subcutaneous Immunoglobulin Market Volume (K Unit) Forecast, by Application 2019 & 2032
- Table 21: United Kingdom Subcutaneous Immunoglobulin Market Revenue (Million) Forecast, by Application 2019 & 2032
- Table 22: United Kingdom Subcutaneous Immunoglobulin Market Volume (K Unit) Forecast, by Application 2019 & 2032
- Table 23: France Subcutaneous Immunoglobulin Market Revenue (Million) Forecast, by Application 2019 & 2032
- Table 24: France Subcutaneous Immunoglobulin Market Volume (K Unit) Forecast, by Application 2019 & 2032
- Table 25: Italy Subcutaneous Immunoglobulin Market Revenue (Million) Forecast, by Application 2019 & 2032
- Table 26: Italy Subcutaneous Immunoglobulin Market Volume (K Unit) Forecast, by Application 2019 & 2032
- Table 27: Spain Subcutaneous Immunoglobulin Market Revenue (Million) Forecast, by Application 2019 & 2032
- Table 28: Spain Subcutaneous Immunoglobulin Market Volume (K Unit) Forecast, by Application 2019 & 2032
- Table 29: Rest of Europe Subcutaneous Immunoglobulin Market Revenue (Million) Forecast, by Application 2019 & 2032
- Table 30: Rest of Europe Subcutaneous Immunoglobulin Market Volume (K Unit) Forecast, by Application 2019 & 2032
- Table 31: Global Subcutaneous Immunoglobulin Market Revenue Million Forecast, by Country 2019 & 2032
- Table 32: Global Subcutaneous Immunoglobulin Market Volume K Unit Forecast, by Country 2019 & 2032
- Table 33: China Subcutaneous Immunoglobulin Market Revenue (Million) Forecast, by Application 2019 & 2032
- Table 34: China Subcutaneous Immunoglobulin Market Volume (K Unit) Forecast, by Application 2019 & 2032
- Table 35: Japan Subcutaneous Immunoglobulin Market Revenue (Million) Forecast, by Application 2019 & 2032
- Table 36: Japan Subcutaneous Immunoglobulin Market Volume (K Unit) Forecast, by Application 2019 & 2032
- Table 37: India Subcutaneous Immunoglobulin Market Revenue (Million) Forecast, by Application 2019 & 2032
- Table 38: India Subcutaneous Immunoglobulin Market Volume (K Unit) Forecast, by Application 2019 & 2032
- Table 39: Australia Subcutaneous Immunoglobulin Market Revenue (Million) Forecast, by Application 2019 & 2032
- Table 40: Australia Subcutaneous Immunoglobulin Market Volume (K Unit) Forecast, by Application 2019 & 2032
- Table 41: South Korea Subcutaneous Immunoglobulin Market Revenue (Million) Forecast, by Application 2019 & 2032
- Table 42: South Korea Subcutaneous Immunoglobulin Market Volume (K Unit) Forecast, by Application 2019 & 2032
- Table 43: Rest of Asia Pacific Subcutaneous Immunoglobulin Market Revenue (Million) Forecast, by Application 2019 & 2032
- Table 44: Rest of Asia Pacific Subcutaneous Immunoglobulin Market Volume (K Unit) Forecast, by Application 2019 & 2032
- Table 45: Global Subcutaneous Immunoglobulin Market Revenue Million Forecast, by Country 2019 & 2032
- Table 46: Global Subcutaneous Immunoglobulin Market Volume K Unit Forecast, by Country 2019 & 2032
- Table 47: GCC Subcutaneous Immunoglobulin Market Revenue (Million) Forecast, by Application 2019 & 2032
- Table 48: GCC Subcutaneous Immunoglobulin Market Volume (K Unit) Forecast, by Application 2019 & 2032
- Table 49: South Africa Subcutaneous Immunoglobulin Market Revenue (Million) Forecast, by Application 2019 & 2032
- Table 50: South Africa Subcutaneous Immunoglobulin Market Volume (K Unit) Forecast, by Application 2019 & 2032
- Table 51: Rest of Middle East and Africa Subcutaneous Immunoglobulin Market Revenue (Million) Forecast, by Application 2019 & 2032
- Table 52: Rest of Middle East and Africa Subcutaneous Immunoglobulin Market Volume (K Unit) Forecast, by Application 2019 & 2032
- Table 53: Global Subcutaneous Immunoglobulin Market Revenue Million Forecast, by Country 2019 & 2032
- Table 54: Global Subcutaneous Immunoglobulin Market Volume K Unit Forecast, by Country 2019 & 2032
- Table 55: Brazil Subcutaneous Immunoglobulin Market Revenue (Million) Forecast, by Application 2019 & 2032
- Table 56: Brazil Subcutaneous Immunoglobulin Market Volume (K Unit) Forecast, by Application 2019 & 2032
- Table 57: Argentina Subcutaneous Immunoglobulin Market Revenue (Million) Forecast, by Application 2019 & 2032
- Table 58: Argentina Subcutaneous Immunoglobulin Market Volume (K Unit) Forecast, by Application 2019 & 2032
- Table 59: Rest of South America Subcutaneous Immunoglobulin Market Revenue (Million) Forecast, by Application 2019 & 2032
- Table 60: Rest of South America Subcutaneous Immunoglobulin Market Volume (K Unit) Forecast, by Application 2019 & 2032
- Table 61: Global Subcutaneous Immunoglobulin Market Revenue Million Forecast, by Application 2019 & 2032
- Table 62: Global Subcutaneous Immunoglobulin Market Volume K Unit Forecast, by Application 2019 & 2032
- Table 63: Global Subcutaneous Immunoglobulin Market Revenue Million Forecast, by End User 2019 & 2032
- Table 64: Global Subcutaneous Immunoglobulin Market Volume K Unit Forecast, by End User 2019 & 2032
- Table 65: Global Subcutaneous Immunoglobulin Market Revenue Million Forecast, by Country 2019 & 2032
- Table 66: Global Subcutaneous Immunoglobulin Market Volume K Unit Forecast, by Country 2019 & 2032
- Table 67: United States Subcutaneous Immunoglobulin Market Revenue (Million) Forecast, by Application 2019 & 2032
- Table 68: United States Subcutaneous Immunoglobulin Market Volume (K Unit) Forecast, by Application 2019 & 2032
- Table 69: Canada Subcutaneous Immunoglobulin Market Revenue (Million) Forecast, by Application 2019 & 2032
- Table 70: Canada Subcutaneous Immunoglobulin Market Volume (K Unit) Forecast, by Application 2019 & 2032
- Table 71: Mexico Subcutaneous Immunoglobulin Market Revenue (Million) Forecast, by Application 2019 & 2032
- Table 72: Mexico Subcutaneous Immunoglobulin Market Volume (K Unit) Forecast, by Application 2019 & 2032
- Table 73: Global Subcutaneous Immunoglobulin Market Revenue Million Forecast, by Application 2019 & 2032
- Table 74: Global Subcutaneous Immunoglobulin Market Volume K Unit Forecast, by Application 2019 & 2032
- Table 75: Global Subcutaneous Immunoglobulin Market Revenue Million Forecast, by End User 2019 & 2032
- Table 76: Global Subcutaneous Immunoglobulin Market Volume K Unit Forecast, by End User 2019 & 2032
- Table 77: Global Subcutaneous Immunoglobulin Market Revenue Million Forecast, by Country 2019 & 2032
- Table 78: Global Subcutaneous Immunoglobulin Market Volume K Unit Forecast, by Country 2019 & 2032
- Table 79: Germany Subcutaneous Immunoglobulin Market Revenue (Million) Forecast, by Application 2019 & 2032
- Table 80: Germany Subcutaneous Immunoglobulin Market Volume (K Unit) Forecast, by Application 2019 & 2032
- Table 81: United Kingdom Subcutaneous Immunoglobulin Market Revenue (Million) Forecast, by Application 2019 & 2032
- Table 82: United Kingdom Subcutaneous Immunoglobulin Market Volume (K Unit) Forecast, by Application 2019 & 2032
- Table 83: France Subcutaneous Immunoglobulin Market Revenue (Million) Forecast, by Application 2019 & 2032
- Table 84: France Subcutaneous Immunoglobulin Market Volume (K Unit) Forecast, by Application 2019 & 2032
- Table 85: Italy Subcutaneous Immunoglobulin Market Revenue (Million) Forecast, by Application 2019 & 2032
- Table 86: Italy Subcutaneous Immunoglobulin Market Volume (K Unit) Forecast, by Application 2019 & 2032
- Table 87: Spain Subcutaneous Immunoglobulin Market Revenue (Million) Forecast, by Application 2019 & 2032
- Table 88: Spain Subcutaneous Immunoglobulin Market Volume (K Unit) Forecast, by Application 2019 & 2032
- Table 89: Rest of Europe Subcutaneous Immunoglobulin Market Revenue (Million) Forecast, by Application 2019 & 2032
- Table 90: Rest of Europe Subcutaneous Immunoglobulin Market Volume (K Unit) Forecast, by Application 2019 & 2032
- Table 91: Global Subcutaneous Immunoglobulin Market Revenue Million Forecast, by Application 2019 & 2032
- Table 92: Global Subcutaneous Immunoglobulin Market Volume K Unit Forecast, by Application 2019 & 2032
- Table 93: Global Subcutaneous Immunoglobulin Market Revenue Million Forecast, by End User 2019 & 2032
- Table 94: Global Subcutaneous Immunoglobulin Market Volume K Unit Forecast, by End User 2019 & 2032
- Table 95: Global Subcutaneous Immunoglobulin Market Revenue Million Forecast, by Country 2019 & 2032
- Table 96: Global Subcutaneous Immunoglobulin Market Volume K Unit Forecast, by Country 2019 & 2032
- Table 97: China Subcutaneous Immunoglobulin Market Revenue (Million) Forecast, by Application 2019 & 2032
- Table 98: China Subcutaneous Immunoglobulin Market Volume (K Unit) Forecast, by Application 2019 & 2032
- Table 99: Japan Subcutaneous Immunoglobulin Market Revenue (Million) Forecast, by Application 2019 & 2032
- Table 100: Japan Subcutaneous Immunoglobulin Market Volume (K Unit) Forecast, by Application 2019 & 2032
- Table 101: India Subcutaneous Immunoglobulin Market Revenue (Million) Forecast, by Application 2019 & 2032
- Table 102: India Subcutaneous Immunoglobulin Market Volume (K Unit) Forecast, by Application 2019 & 2032
- Table 103: Australia Subcutaneous Immunoglobulin Market Revenue (Million) Forecast, by Application 2019 & 2032
- Table 104: Australia Subcutaneous Immunoglobulin Market Volume (K Unit) Forecast, by Application 2019 & 2032
- Table 105: South Korea Subcutaneous Immunoglobulin Market Revenue (Million) Forecast, by Application 2019 & 2032
- Table 106: South Korea Subcutaneous Immunoglobulin Market Volume (K Unit) Forecast, by Application 2019 & 2032
- Table 107: Rest of Asia Pacific Subcutaneous Immunoglobulin Market Revenue (Million) Forecast, by Application 2019 & 2032
- Table 108: Rest of Asia Pacific Subcutaneous Immunoglobulin Market Volume (K Unit) Forecast, by Application 2019 & 2032
- Table 109: Global Subcutaneous Immunoglobulin Market Revenue Million Forecast, by Application 2019 & 2032
- Table 110: Global Subcutaneous Immunoglobulin Market Volume K Unit Forecast, by Application 2019 & 2032
- Table 111: Global Subcutaneous Immunoglobulin Market Revenue Million Forecast, by End User 2019 & 2032
- Table 112: Global Subcutaneous Immunoglobulin Market Volume K Unit Forecast, by End User 2019 & 2032
- Table 113: Global Subcutaneous Immunoglobulin Market Revenue Million Forecast, by Country 2019 & 2032
- Table 114: Global Subcutaneous Immunoglobulin Market Volume K Unit Forecast, by Country 2019 & 2032
- Table 115: GCC Subcutaneous Immunoglobulin Market Revenue (Million) Forecast, by Application 2019 & 2032
- Table 116: GCC Subcutaneous Immunoglobulin Market Volume (K Unit) Forecast, by Application 2019 & 2032
- Table 117: South Africa Subcutaneous Immunoglobulin Market Revenue (Million) Forecast, by Application 2019 & 2032
- Table 118: South Africa Subcutaneous Immunoglobulin Market Volume (K Unit) Forecast, by Application 2019 & 2032
- Table 119: Rest of Middle East and Africa Subcutaneous Immunoglobulin Market Revenue (Million) Forecast, by Application 2019 & 2032
- Table 120: Rest of Middle East and Africa Subcutaneous Immunoglobulin Market Volume (K Unit) Forecast, by Application 2019 & 2032
- Table 121: Global Subcutaneous Immunoglobulin Market Revenue Million Forecast, by Application 2019 & 2032
- Table 122: Global Subcutaneous Immunoglobulin Market Volume K Unit Forecast, by Application 2019 & 2032
- Table 123: Global Subcutaneous Immunoglobulin Market Revenue Million Forecast, by End User 2019 & 2032
- Table 124: Global Subcutaneous Immunoglobulin Market Volume K Unit Forecast, by End User 2019 & 2032
- Table 125: Global Subcutaneous Immunoglobulin Market Revenue Million Forecast, by Country 2019 & 2032
- Table 126: Global Subcutaneous Immunoglobulin Market Volume K Unit Forecast, by Country 2019 & 2032
- Table 127: Brazil Subcutaneous Immunoglobulin Market Revenue (Million) Forecast, by Application 2019 & 2032
- Table 128: Brazil Subcutaneous Immunoglobulin Market Volume (K Unit) Forecast, by Application 2019 & 2032
- Table 129: Argentina Subcutaneous Immunoglobulin Market Revenue (Million) Forecast, by Application 2019 & 2032
- Table 130: Argentina Subcutaneous Immunoglobulin Market Volume (K Unit) Forecast, by Application 2019 & 2032
- Table 131: Rest of South America Subcutaneous Immunoglobulin Market Revenue (Million) Forecast, by Application 2019 & 2032
- Table 132: Rest of South America Subcutaneous Immunoglobulin Market Volume (K Unit) Forecast, by Application 2019 & 2032
Frequently Asked Questions
1. What is the projected Compound Annual Growth Rate (CAGR) of the Subcutaneous Immunoglobulin Market?
The projected CAGR is approximately 13.30%.
2. Which companies are prominent players in the Subcutaneous Immunoglobulin Market?
Key companies in the market include Bio Products laboratory, Biotest AG, Octapharma AG, Takeda Pharmaceutical Company Limited, Grifols S A, CSL Behring, Kedrion S p A.
3. What are the main segments of the Subcutaneous Immunoglobulin Market?
The market segments include Application, End User.
4. Can you provide details about the market size?
The market size is estimated to be USD XX Million as of 2022.
5. What are some drivers contributing to market growth?
Increasing Use of Subcutaneous Immunoglobulin For Primary Immunodeficiency Disorders; Increasing Geriatric Population and Patient Pool; Rise in Government Funding.
6. What are the notable trends driving market growth?
Secondary Immunodeficiency Diseases are Expected to Witness a Strong Growth Over the Forecast Period.
7. Are there any restraints impacting market growth?
Stringent Government Regulations; High Risk of Side Effects.
8. Can you provide examples of recent developments in the market?
In August 2022, Genentech, a member of the Roche Group announced that the Phase III IMscin001 study evaluating a subcutaneous formulation of Tecentriq (atezolizumab) met its co-primary endpoints.
9. What pricing options are available for accessing the report?
Pricing options include single-user, multi-user, and enterprise licenses priced at USD 4750, USD 5250, and USD 8750 respectively.
10. Is the market size provided in terms of value or volume?
The market size is provided in terms of value, measured in Million and volume, measured in K Unit.
11. Are there any specific market keywords associated with the report?
Yes, the market keyword associated with the report is "Subcutaneous Immunoglobulin Market," which aids in identifying and referencing the specific market segment covered.
12. How do I determine which pricing option suits my needs best?
The pricing options vary based on user requirements and access needs. Individual users may opt for single-user licenses, while businesses requiring broader access may choose multi-user or enterprise licenses for cost-effective access to the report.
13. Are there any additional resources or data provided in the Subcutaneous Immunoglobulin Market report?
While the report offers comprehensive insights, it's advisable to review the specific contents or supplementary materials provided to ascertain if additional resources or data are available.
14. How can I stay updated on further developments or reports in the Subcutaneous Immunoglobulin Market?
To stay informed about further developments, trends, and reports in the Subcutaneous Immunoglobulin Market, consider subscribing to industry newsletters, following relevant companies and organizations, or regularly checking reputable industry news sources and publications.
Methodology
Step 1 - Identification of Relevant Samples Size from Population Database


Step 2 - Approaches for Defining Global Market Size (Value, Volume* & Price*)

Note*: In applicable scenarios
Step 3 - Data Sources
Primary Research
- Web Analytics
- Survey Reports
- Research Institute
- Latest Research Reports
- Opinion Leaders
Secondary Research
- Annual Reports
- White Paper
- Latest Press Release
- Industry Association
- Paid Database
- Investor Presentations

Step 4 - Data Triangulation
Involves using different sources of information in order to increase the validity of a study
These sources are likely to be stakeholders in a program - participants, other researchers, program staff, other community members, and so on.
Then we put all data in single framework & apply various statistical tools to find out the dynamic on the market.
During the analysis stage, feedback from the stakeholder groups would be compared to determine areas of agreement as well as areas of divergence


