
Key Insights
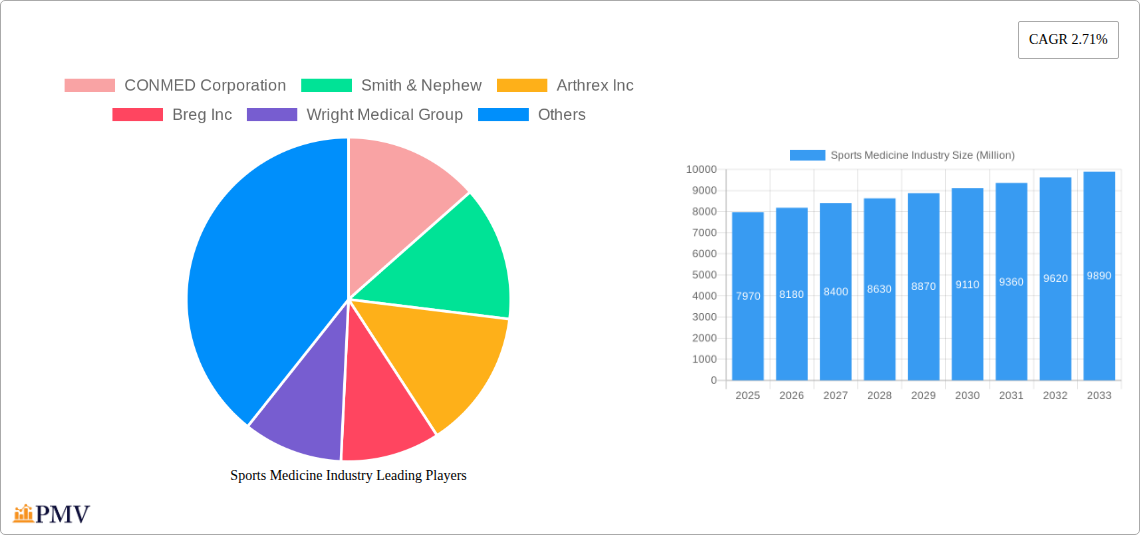
The global sports medicine market, valued at $7.97 billion in 2025, is projected to experience steady growth, driven by several key factors. Rising participation in sports and recreational activities, coupled with an aging population experiencing age-related musculoskeletal issues, fuels demand for advanced treatments and rehabilitation solutions. Technological advancements in minimally invasive surgical techniques, such as arthroscopy, and the development of innovative implants and biomaterials contribute to improved patient outcomes and market expansion. The increasing prevalence of sports-related injuries, particularly knee, shoulder, and ankle injuries, further stimulates market growth. Furthermore, the growing awareness of preventative care and the rising adoption of technologically advanced rehabilitation methods are contributing factors. The market is segmented across various product categories including implants, arthroscopy devices, prosthetics, orthobiologics, braces, bandages, and other products, catering to diverse injury types across different applications including knee, shoulder, ankle, back, and elbow injuries. Competition within the market is intense, with key players like Johnson & Johnson, Zimmer Biomet, and Stryker constantly innovating and expanding their product portfolios.
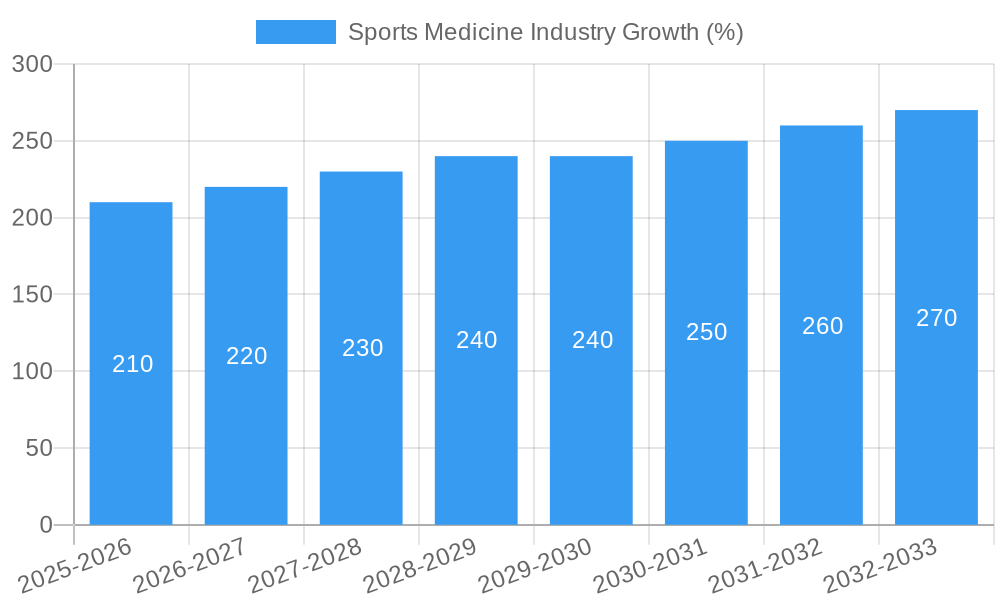
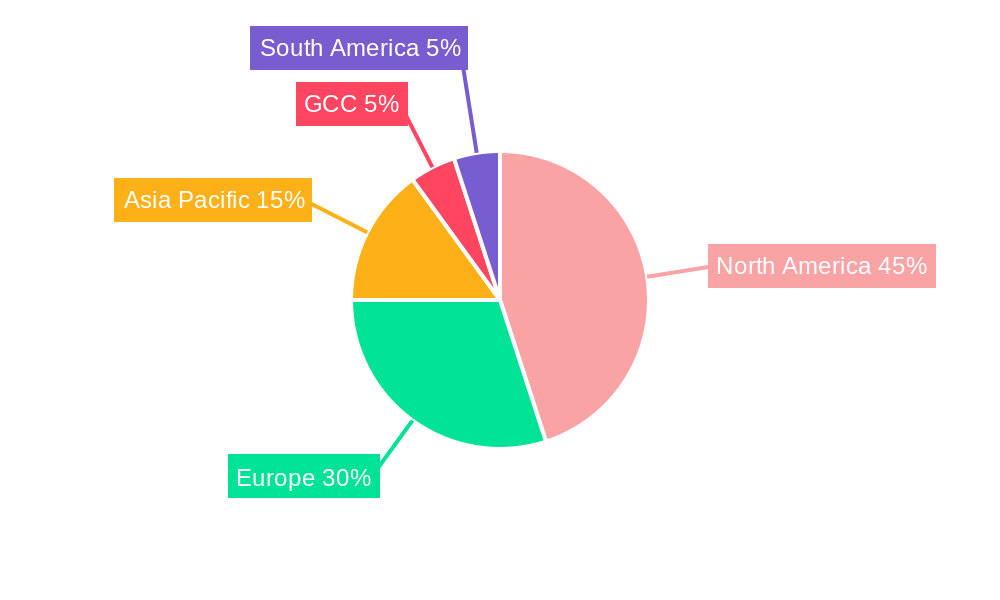
Geographical distribution of market revenue shows a significant share held by North America, fueled by high healthcare expenditure and advanced medical infrastructure. Europe is another substantial market, driven by similar factors. The Asia-Pacific region is expected to experience significant growth in the forecast period (2025-2033), driven by rising disposable incomes, increasing healthcare awareness, and a burgeoning middle class. While regulatory hurdles and high treatment costs might pose some restraints, the overall market outlook remains positive, with a projected Compound Annual Growth Rate (CAGR) of 2.71% over the forecast period. This growth is expected to be driven by continued advancements in minimally invasive procedures, personalized medicine approaches, and an increasing focus on improving patient rehabilitation outcomes. Factors such as rising healthcare costs and the potential for reimbursement challenges remain considerations for market participants.
Sports Medicine Industry Market Report: 2019-2033
This comprehensive report provides an in-depth analysis of the global sports medicine industry, projecting a market value exceeding $XX Million by 2033. The study period covers 2019-2033, with 2025 as the base and estimated year. This report offers actionable insights for industry stakeholders, including manufacturers, distributors, investors, and healthcare professionals. The report utilizes a robust methodology, incorporating both qualitative and quantitative analysis to provide a holistic view of the market.
Sports Medicine Industry Market Structure & Competitive Dynamics
The global sports medicine market is characterized by a moderately concentrated structure, with key players like CONMED Corporation, Smith & Nephew, Arthrex Inc, Breg Inc, Wright Medical Group, DJO Global Inc, Performance Health, Medtronic PLC, Johnson & Johnson, Mueller Sports Medicine Inc, Stryker Corporation, and Zimmer Biomet Holdings Inc holding significant market share. The combined market share of the top five players is estimated at xx%. Innovation ecosystems are vibrant, driven by ongoing research and development in materials science, minimally invasive surgical techniques, and digital health technologies. Stringent regulatory frameworks, particularly concerning medical device approvals (e.g., FDA clearances), significantly impact market entry and product lifecycle. The market witnesses substantial M&A activity, with deal values exceeding $XX Million in recent years. Examples include [Insert Specific M&A examples with values if available, otherwise use "XX Million" as a placeholder for deal values]. End-user trends show a growing preference for minimally invasive procedures and personalized medicine approaches.
- Market Concentration: Moderately concentrated, with top 5 players holding xx% market share.
- Innovation: Strong R&D focus on materials science, minimally invasive surgery, and digital health.
- Regulatory Landscape: Stringent, impacting product approvals and market entry.
- M&A Activity: Significant, with deal values exceeding $XX Million annually.
- End-User Trends: Preference for minimally invasive procedures and personalized medicine.
Sports Medicine Industry Industry Trends & Insights
The sports medicine market is experiencing robust growth, projected to exhibit a CAGR of xx% during the forecast period (2025-2033). This growth is driven by several factors, including the rising prevalence of sports-related injuries, an aging global population, increasing healthcare expenditure, and advancements in medical technology. Technological disruptions, such as the introduction of robotic surgery and AI-powered diagnostic tools, are transforming surgical practices and improving patient outcomes. Consumer preferences are shifting towards less invasive procedures with faster recovery times, spurring innovation in areas like arthroscopy and biologics. Intense competition among established players and emerging companies fuels further innovation and market expansion. Market penetration of advanced products like smart braces and connected rehabilitation devices is increasing rapidly, particularly in developed regions.
Dominant Markets & Segments in Sports Medicine Industry
The North American region currently dominates the sports medicine market, driven by high healthcare expenditure, advanced medical infrastructure, and a strong preference for minimally invasive surgeries. Within product segments, Implants hold the largest market share, followed by Arthroscopy Devices. Regarding applications, Knee Injuries represent a significant portion of the market due to high incidence rates and the availability of advanced treatment options.
- Leading Region: North America
- Leading Product Segment: Implants
- Leading Application Segment: Knee Injuries
Key Drivers for Dominance:
- North America: High healthcare expenditure, advanced medical infrastructure, and a strong preference for minimally invasive surgeries.
- Implants: High demand, technological advancements leading to improved outcomes.
- Knee Injuries: High incidence rates, availability of advanced treatment options.
Sports Medicine Industry Product Innovations
Recent years have witnessed significant innovations in sports medicine products, including the development of biocompatible implants with enhanced osseointegration, minimally invasive arthroscopic instruments with improved precision, and advanced prosthetics with enhanced functionality and durability. The integration of smart technologies into braces and rehabilitation devices provides real-time data monitoring and personalized treatment plans. These innovations are designed to improve patient outcomes, reduce recovery times, and enhance overall treatment efficacy, aligning with growing market demand for advanced, minimally invasive solutions.
Report Segmentation & Scope
This report segments the sports medicine market by product (Implants, Arthroscopy Devices, Prosthetics, Orthobiologics, Braces, Bandages and Tapes, Other Products) and application (Knee Injuries, Shoulder Injuries, Ankle and Foot Injuries, Back and Spine Injuries, Elbow and Wrist Injuries, Other Applications). Each segment's growth projections, market size (in Millions), and competitive dynamics are analyzed separately within the report. For example, the Implants segment is expected to witness significant growth due to the increasing demand for joint replacement surgeries, while the Arthroscopy Devices segment is projected to experience moderate growth driven by the rising adoption of minimally invasive procedures.
Key Drivers of Sports Medicine Industry Growth
Several factors contribute to the growth of the sports medicine industry. Technological advancements in minimally invasive surgical techniques, biomaterials, and imaging technologies are significantly improving treatment outcomes. The rising prevalence of sports-related injuries and an aging population are driving demand for advanced medical solutions. Favorable regulatory environments and increased healthcare spending in several regions are further boosting market expansion.
Challenges in the Sports Medicine Industry Sector
The sports medicine industry faces challenges such as stringent regulatory requirements for medical device approvals, increasing competition from both established and emerging players, and potential supply chain disruptions. High research and development costs coupled with price pressure from payers pose significant hurdles for profitability. Furthermore, ethical considerations surrounding the use of advanced technologies and the potential for overuse of medical devices are emerging concerns. The impact of these challenges on market growth is estimated to be a reduction in CAGR by approximately xx%.
Leading Players in the Sports Medicine Industry Market
- CONMED Corporation
- Smith & Nephew
- Arthrex Inc
- Breg Inc
- Wright Medical Group
- DJO Global Inc
- Performance Health
- Medtronic PLC
- Johnson & Johnson
- Mueller Sports Medicine Inc
- Stryker Corporation
- Zimmer Biomet Holdings Inc
Key Developments in Sports Medicine Industry Sector
- July 2020: Anika Therapeutics Inc. received USFDA clearance for six innovative orthopedic and sports medicine products.
- June 2020: Smith & Nephew launched "Intellio," a platform connecting and managing sports medicine systems.
Strategic Sports Medicine Industry Market Outlook
The future of the sports medicine industry appears promising, driven by continuous technological advancements, increasing healthcare expenditure, and a growing awareness of the importance of sports-related injury prevention and treatment. Strategic opportunities exist for companies focusing on personalized medicine, minimally invasive techniques, and the integration of digital technologies. The market presents significant potential for growth, especially in emerging economies with rapidly expanding healthcare sectors. The continued focus on innovation and technological advancements will be critical in shaping the future landscape of the sports medicine industry.
Sports Medicine Industry Segmentation
-
1. Product
- 1.1. Implants
- 1.2. Arthroscopy Devices
- 1.3. Prosthetics
- 1.4. Orthobiologics
- 1.5. Braces
- 1.6. Bandages and Tapes
- 1.7. Other Products
-
2. Application
- 2.1. Knee Injuries
- 2.2. Shoulder Injuries
- 2.3. Ankle and Foot Injuries
- 2.4. Back and Spine Injuries
- 2.5. Elbow and Wrist Injuries
- 2.6. Other Applications
Sports Medicine Industry Segmentation By Geography
-
1. North America
- 1.1. United States
- 1.2. Canada
- 1.3. Mexico
-
2. Europe
- 2.1. Germany
- 2.2. United Kingdom
- 2.3. France
- 2.4. Italy
- 2.5. Spain
- 2.6. Rest of Europe
-
3. Asia Pacific
- 3.1. China
- 3.2. Japan
- 3.3. India
- 3.4. Australia
- 3.5. South Korea
- 3.6. Rest of Asia Pacific
- 4. Middle East
-
5. GCC
- 5.1. South Africa
- 5.2. Rest of Middle East
-
6. South America
- 6.1. Brazil
- 6.2. Argentina
- 6.3. Rest of South America
Sports Medicine Industry REPORT HIGHLIGHTS
| Aspects | Details |
|---|---|
| Study Period | 2019-2033 |
| Base Year | 2024 |
| Estimated Year | 2025 |
| Forecast Period | 2025-2033 |
| Historical Period | 2019-2024 |
| Growth Rate | CAGR of 2.71% from 2019-2033 |
| Segmentation |
|
Table of Contents
- 1. Introduction
- 1.1. Research Scope
- 1.2. Market Segmentation
- 1.3. Research Methodology
- 1.4. Definitions and Assumptions
- 2. Executive Summary
- 2.1. Introduction
- 3. Market Dynamics
- 3.1. Introduction
- 3.2. Market Drivers
- 3.2.1. Rising Burden of Sports Injuries; Consistent Innovation of New Products and Treatment Modalities; Rising Demand for Minimally Invasive Surgeries
- 3.3. Market Restrains
- 3.3.1. High Cost of Implants and Devices; Dearth of a Proper Sports Ecosystem
- 3.4. Market Trends
- 3.4.1. Braces are Expected to Observe Good Growth over the Forecast Period
- 4. Market Factor Analysis
- 4.1. Porters Five Forces
- 4.2. Supply/Value Chain
- 4.3. PESTEL analysis
- 4.4. Market Entropy
- 4.5. Patent/Trademark Analysis
- 5. Global Sports Medicine Industry Analysis, Insights and Forecast, 2019-2031
- 5.1. Market Analysis, Insights and Forecast - by Product
- 5.1.1. Implants
- 5.1.2. Arthroscopy Devices
- 5.1.3. Prosthetics
- 5.1.4. Orthobiologics
- 5.1.5. Braces
- 5.1.6. Bandages and Tapes
- 5.1.7. Other Products
- 5.2. Market Analysis, Insights and Forecast - by Application
- 5.2.1. Knee Injuries
- 5.2.2. Shoulder Injuries
- 5.2.3. Ankle and Foot Injuries
- 5.2.4. Back and Spine Injuries
- 5.2.5. Elbow and Wrist Injuries
- 5.2.6. Other Applications
- 5.3. Market Analysis, Insights and Forecast - by Region
- 5.3.1. North America
- 5.3.2. Europe
- 5.3.3. Asia Pacific
- 5.3.4. Middle East
- 5.3.5. GCC
- 5.3.6. South America
- 5.1. Market Analysis, Insights and Forecast - by Product
- 6. North America Sports Medicine Industry Analysis, Insights and Forecast, 2019-2031
- 6.1. Market Analysis, Insights and Forecast - by Product
- 6.1.1. Implants
- 6.1.2. Arthroscopy Devices
- 6.1.3. Prosthetics
- 6.1.4. Orthobiologics
- 6.1.5. Braces
- 6.1.6. Bandages and Tapes
- 6.1.7. Other Products
- 6.2. Market Analysis, Insights and Forecast - by Application
- 6.2.1. Knee Injuries
- 6.2.2. Shoulder Injuries
- 6.2.3. Ankle and Foot Injuries
- 6.2.4. Back and Spine Injuries
- 6.2.5. Elbow and Wrist Injuries
- 6.2.6. Other Applications
- 6.1. Market Analysis, Insights and Forecast - by Product
- 7. Europe Sports Medicine Industry Analysis, Insights and Forecast, 2019-2031
- 7.1. Market Analysis, Insights and Forecast - by Product
- 7.1.1. Implants
- 7.1.2. Arthroscopy Devices
- 7.1.3. Prosthetics
- 7.1.4. Orthobiologics
- 7.1.5. Braces
- 7.1.6. Bandages and Tapes
- 7.1.7. Other Products
- 7.2. Market Analysis, Insights and Forecast - by Application
- 7.2.1. Knee Injuries
- 7.2.2. Shoulder Injuries
- 7.2.3. Ankle and Foot Injuries
- 7.2.4. Back and Spine Injuries
- 7.2.5. Elbow and Wrist Injuries
- 7.2.6. Other Applications
- 7.1. Market Analysis, Insights and Forecast - by Product
- 8. Asia Pacific Sports Medicine Industry Analysis, Insights and Forecast, 2019-2031
- 8.1. Market Analysis, Insights and Forecast - by Product
- 8.1.1. Implants
- 8.1.2. Arthroscopy Devices
- 8.1.3. Prosthetics
- 8.1.4. Orthobiologics
- 8.1.5. Braces
- 8.1.6. Bandages and Tapes
- 8.1.7. Other Products
- 8.2. Market Analysis, Insights and Forecast - by Application
- 8.2.1. Knee Injuries
- 8.2.2. Shoulder Injuries
- 8.2.3. Ankle and Foot Injuries
- 8.2.4. Back and Spine Injuries
- 8.2.5. Elbow and Wrist Injuries
- 8.2.6. Other Applications
- 8.1. Market Analysis, Insights and Forecast - by Product
- 9. Middle East Sports Medicine Industry Analysis, Insights and Forecast, 2019-2031
- 9.1. Market Analysis, Insights and Forecast - by Product
- 9.1.1. Implants
- 9.1.2. Arthroscopy Devices
- 9.1.3. Prosthetics
- 9.1.4. Orthobiologics
- 9.1.5. Braces
- 9.1.6. Bandages and Tapes
- 9.1.7. Other Products
- 9.2. Market Analysis, Insights and Forecast - by Application
- 9.2.1. Knee Injuries
- 9.2.2. Shoulder Injuries
- 9.2.3. Ankle and Foot Injuries
- 9.2.4. Back and Spine Injuries
- 9.2.5. Elbow and Wrist Injuries
- 9.2.6. Other Applications
- 9.1. Market Analysis, Insights and Forecast - by Product
- 10. GCC Sports Medicine Industry Analysis, Insights and Forecast, 2019-2031
- 10.1. Market Analysis, Insights and Forecast - by Product
- 10.1.1. Implants
- 10.1.2. Arthroscopy Devices
- 10.1.3. Prosthetics
- 10.1.4. Orthobiologics
- 10.1.5. Braces
- 10.1.6. Bandages and Tapes
- 10.1.7. Other Products
- 10.2. Market Analysis, Insights and Forecast - by Application
- 10.2.1. Knee Injuries
- 10.2.2. Shoulder Injuries
- 10.2.3. Ankle and Foot Injuries
- 10.2.4. Back and Spine Injuries
- 10.2.5. Elbow and Wrist Injuries
- 10.2.6. Other Applications
- 10.1. Market Analysis, Insights and Forecast - by Product
- 11. South America Sports Medicine Industry Analysis, Insights and Forecast, 2019-2031
- 11.1. Market Analysis, Insights and Forecast - by Product
- 11.1.1. Implants
- 11.1.2. Arthroscopy Devices
- 11.1.3. Prosthetics
- 11.1.4. Orthobiologics
- 11.1.5. Braces
- 11.1.6. Bandages and Tapes
- 11.1.7. Other Products
- 11.2. Market Analysis, Insights and Forecast - by Application
- 11.2.1. Knee Injuries
- 11.2.2. Shoulder Injuries
- 11.2.3. Ankle and Foot Injuries
- 11.2.4. Back and Spine Injuries
- 11.2.5. Elbow and Wrist Injuries
- 11.2.6. Other Applications
- 11.1. Market Analysis, Insights and Forecast - by Product
- 12. North America Sports Medicine Industry Analysis, Insights and Forecast, 2019-2031
- 12.1. Market Analysis, Insights and Forecast - By Country/Sub-region
- 12.1.1. undefined
- 13. Europe Sports Medicine Industry Analysis, Insights and Forecast, 2019-2031
- 13.1. Market Analysis, Insights and Forecast - By Country/Sub-region
- 13.1.1. undefined
- 14. Asia Pacific Sports Medicine Industry Analysis, Insights and Forecast, 2019-2031
- 14.1. Market Analysis, Insights and Forecast - By Country/Sub-region
- 14.1.1. undefined
- 15. GCC Sports Medicine Industry Analysis, Insights and Forecast, 2019-2031
- 15.1. Market Analysis, Insights and Forecast - By Country/Sub-region
- 15.1.1. undefined
- 16. South America Sports Medicine Industry Analysis, Insights and Forecast, 2019-2031
- 16.1. Market Analysis, Insights and Forecast - By Country/Sub-region
- 16.1.1. undefined
- 17. Competitive Analysis
- 17.1. Global Market Share Analysis 2024
- 17.2. Company Profiles
- 17.2.1 CONMED Corporation
- 17.2.1.1. Overview
- 17.2.1.2. Products
- 17.2.1.3. SWOT Analysis
- 17.2.1.4. Recent Developments
- 17.2.1.5. Financials (Based on Availability)
- 17.2.2 Smith & Nephew
- 17.2.2.1. Overview
- 17.2.2.2. Products
- 17.2.2.3. SWOT Analysis
- 17.2.2.4. Recent Developments
- 17.2.2.5. Financials (Based on Availability)
- 17.2.3 Arthrex Inc
- 17.2.3.1. Overview
- 17.2.3.2. Products
- 17.2.3.3. SWOT Analysis
- 17.2.3.4. Recent Developments
- 17.2.3.5. Financials (Based on Availability)
- 17.2.4 Breg Inc
- 17.2.4.1. Overview
- 17.2.4.2. Products
- 17.2.4.3. SWOT Analysis
- 17.2.4.4. Recent Developments
- 17.2.4.5. Financials (Based on Availability)
- 17.2.5 Wright Medical Group
- 17.2.5.1. Overview
- 17.2.5.2. Products
- 17.2.5.3. SWOT Analysis
- 17.2.5.4. Recent Developments
- 17.2.5.5. Financials (Based on Availability)
- 17.2.6 DJO Global Inc
- 17.2.6.1. Overview
- 17.2.6.2. Products
- 17.2.6.3. SWOT Analysis
- 17.2.6.4. Recent Developments
- 17.2.6.5. Financials (Based on Availability)
- 17.2.7 Performance Health
- 17.2.7.1. Overview
- 17.2.7.2. Products
- 17.2.7.3. SWOT Analysis
- 17.2.7.4. Recent Developments
- 17.2.7.5. Financials (Based on Availability)
- 17.2.8 Medtronic PLC
- 17.2.8.1. Overview
- 17.2.8.2. Products
- 17.2.8.3. SWOT Analysis
- 17.2.8.4. Recent Developments
- 17.2.8.5. Financials (Based on Availability)
- 17.2.9 Johnson & Johnson
- 17.2.9.1. Overview
- 17.2.9.2. Products
- 17.2.9.3. SWOT Analysis
- 17.2.9.4. Recent Developments
- 17.2.9.5. Financials (Based on Availability)
- 17.2.10 Mueller Sports Medicine Inc
- 17.2.10.1. Overview
- 17.2.10.2. Products
- 17.2.10.3. SWOT Analysis
- 17.2.10.4. Recent Developments
- 17.2.10.5. Financials (Based on Availability)
- 17.2.11 Stryker Corporation
- 17.2.11.1. Overview
- 17.2.11.2. Products
- 17.2.11.3. SWOT Analysis
- 17.2.11.4. Recent Developments
- 17.2.11.5. Financials (Based on Availability)
- 17.2.12 Zimmer Biomet Holdings Inc
- 17.2.12.1. Overview
- 17.2.12.2. Products
- 17.2.12.3. SWOT Analysis
- 17.2.12.4. Recent Developments
- 17.2.12.5. Financials (Based on Availability)
- 17.2.1 CONMED Corporation
List of Figures
- Figure 1: Global Sports Medicine Industry Revenue Breakdown (Million, %) by Region 2024 & 2032
- Figure 2: Global Sports Medicine Industry Volume Breakdown (K Unit, %) by Region 2024 & 2032
- Figure 3: North America Sports Medicine Industry Revenue (Million), by Country 2024 & 2032
- Figure 4: North America Sports Medicine Industry Volume (K Unit), by Country 2024 & 2032
- Figure 5: North America Sports Medicine Industry Revenue Share (%), by Country 2024 & 2032
- Figure 6: North America Sports Medicine Industry Volume Share (%), by Country 2024 & 2032
- Figure 7: Europe Sports Medicine Industry Revenue (Million), by Country 2024 & 2032
- Figure 8: Europe Sports Medicine Industry Volume (K Unit), by Country 2024 & 2032
- Figure 9: Europe Sports Medicine Industry Revenue Share (%), by Country 2024 & 2032
- Figure 10: Europe Sports Medicine Industry Volume Share (%), by Country 2024 & 2032
- Figure 11: Asia Pacific Sports Medicine Industry Revenue (Million), by Country 2024 & 2032
- Figure 12: Asia Pacific Sports Medicine Industry Volume (K Unit), by Country 2024 & 2032
- Figure 13: Asia Pacific Sports Medicine Industry Revenue Share (%), by Country 2024 & 2032
- Figure 14: Asia Pacific Sports Medicine Industry Volume Share (%), by Country 2024 & 2032
- Figure 15: GCC Sports Medicine Industry Revenue (Million), by Country 2024 & 2032
- Figure 16: GCC Sports Medicine Industry Volume (K Unit), by Country 2024 & 2032
- Figure 17: GCC Sports Medicine Industry Revenue Share (%), by Country 2024 & 2032
- Figure 18: GCC Sports Medicine Industry Volume Share (%), by Country 2024 & 2032
- Figure 19: South America Sports Medicine Industry Revenue (Million), by Country 2024 & 2032
- Figure 20: South America Sports Medicine Industry Volume (K Unit), by Country 2024 & 2032
- Figure 21: South America Sports Medicine Industry Revenue Share (%), by Country 2024 & 2032
- Figure 22: South America Sports Medicine Industry Volume Share (%), by Country 2024 & 2032
- Figure 23: North America Sports Medicine Industry Revenue (Million), by Product 2024 & 2032
- Figure 24: North America Sports Medicine Industry Volume (K Unit), by Product 2024 & 2032
- Figure 25: North America Sports Medicine Industry Revenue Share (%), by Product 2024 & 2032
- Figure 26: North America Sports Medicine Industry Volume Share (%), by Product 2024 & 2032
- Figure 27: North America Sports Medicine Industry Revenue (Million), by Application 2024 & 2032
- Figure 28: North America Sports Medicine Industry Volume (K Unit), by Application 2024 & 2032
- Figure 29: North America Sports Medicine Industry Revenue Share (%), by Application 2024 & 2032
- Figure 30: North America Sports Medicine Industry Volume Share (%), by Application 2024 & 2032
- Figure 31: North America Sports Medicine Industry Revenue (Million), by Country 2024 & 2032
- Figure 32: North America Sports Medicine Industry Volume (K Unit), by Country 2024 & 2032
- Figure 33: North America Sports Medicine Industry Revenue Share (%), by Country 2024 & 2032
- Figure 34: North America Sports Medicine Industry Volume Share (%), by Country 2024 & 2032
- Figure 35: Europe Sports Medicine Industry Revenue (Million), by Product 2024 & 2032
- Figure 36: Europe Sports Medicine Industry Volume (K Unit), by Product 2024 & 2032
- Figure 37: Europe Sports Medicine Industry Revenue Share (%), by Product 2024 & 2032
- Figure 38: Europe Sports Medicine Industry Volume Share (%), by Product 2024 & 2032
- Figure 39: Europe Sports Medicine Industry Revenue (Million), by Application 2024 & 2032
- Figure 40: Europe Sports Medicine Industry Volume (K Unit), by Application 2024 & 2032
- Figure 41: Europe Sports Medicine Industry Revenue Share (%), by Application 2024 & 2032
- Figure 42: Europe Sports Medicine Industry Volume Share (%), by Application 2024 & 2032
- Figure 43: Europe Sports Medicine Industry Revenue (Million), by Country 2024 & 2032
- Figure 44: Europe Sports Medicine Industry Volume (K Unit), by Country 2024 & 2032
- Figure 45: Europe Sports Medicine Industry Revenue Share (%), by Country 2024 & 2032
- Figure 46: Europe Sports Medicine Industry Volume Share (%), by Country 2024 & 2032
- Figure 47: Asia Pacific Sports Medicine Industry Revenue (Million), by Product 2024 & 2032
- Figure 48: Asia Pacific Sports Medicine Industry Volume (K Unit), by Product 2024 & 2032
- Figure 49: Asia Pacific Sports Medicine Industry Revenue Share (%), by Product 2024 & 2032
- Figure 50: Asia Pacific Sports Medicine Industry Volume Share (%), by Product 2024 & 2032
- Figure 51: Asia Pacific Sports Medicine Industry Revenue (Million), by Application 2024 & 2032
- Figure 52: Asia Pacific Sports Medicine Industry Volume (K Unit), by Application 2024 & 2032
- Figure 53: Asia Pacific Sports Medicine Industry Revenue Share (%), by Application 2024 & 2032
- Figure 54: Asia Pacific Sports Medicine Industry Volume Share (%), by Application 2024 & 2032
- Figure 55: Asia Pacific Sports Medicine Industry Revenue (Million), by Country 2024 & 2032
- Figure 56: Asia Pacific Sports Medicine Industry Volume (K Unit), by Country 2024 & 2032
- Figure 57: Asia Pacific Sports Medicine Industry Revenue Share (%), by Country 2024 & 2032
- Figure 58: Asia Pacific Sports Medicine Industry Volume Share (%), by Country 2024 & 2032
- Figure 59: Middle East Sports Medicine Industry Revenue (Million), by Product 2024 & 2032
- Figure 60: Middle East Sports Medicine Industry Volume (K Unit), by Product 2024 & 2032
- Figure 61: Middle East Sports Medicine Industry Revenue Share (%), by Product 2024 & 2032
- Figure 62: Middle East Sports Medicine Industry Volume Share (%), by Product 2024 & 2032
- Figure 63: Middle East Sports Medicine Industry Revenue (Million), by Application 2024 & 2032
- Figure 64: Middle East Sports Medicine Industry Volume (K Unit), by Application 2024 & 2032
- Figure 65: Middle East Sports Medicine Industry Revenue Share (%), by Application 2024 & 2032
- Figure 66: Middle East Sports Medicine Industry Volume Share (%), by Application 2024 & 2032
- Figure 67: Middle East Sports Medicine Industry Revenue (Million), by Country 2024 & 2032
- Figure 68: Middle East Sports Medicine Industry Volume (K Unit), by Country 2024 & 2032
- Figure 69: Middle East Sports Medicine Industry Revenue Share (%), by Country 2024 & 2032
- Figure 70: Middle East Sports Medicine Industry Volume Share (%), by Country 2024 & 2032
- Figure 71: GCC Sports Medicine Industry Revenue (Million), by Product 2024 & 2032
- Figure 72: GCC Sports Medicine Industry Volume (K Unit), by Product 2024 & 2032
- Figure 73: GCC Sports Medicine Industry Revenue Share (%), by Product 2024 & 2032
- Figure 74: GCC Sports Medicine Industry Volume Share (%), by Product 2024 & 2032
- Figure 75: GCC Sports Medicine Industry Revenue (Million), by Application 2024 & 2032
- Figure 76: GCC Sports Medicine Industry Volume (K Unit), by Application 2024 & 2032
- Figure 77: GCC Sports Medicine Industry Revenue Share (%), by Application 2024 & 2032
- Figure 78: GCC Sports Medicine Industry Volume Share (%), by Application 2024 & 2032
- Figure 79: GCC Sports Medicine Industry Revenue (Million), by Country 2024 & 2032
- Figure 80: GCC Sports Medicine Industry Volume (K Unit), by Country 2024 & 2032
- Figure 81: GCC Sports Medicine Industry Revenue Share (%), by Country 2024 & 2032
- Figure 82: GCC Sports Medicine Industry Volume Share (%), by Country 2024 & 2032
- Figure 83: South America Sports Medicine Industry Revenue (Million), by Product 2024 & 2032
- Figure 84: South America Sports Medicine Industry Volume (K Unit), by Product 2024 & 2032
- Figure 85: South America Sports Medicine Industry Revenue Share (%), by Product 2024 & 2032
- Figure 86: South America Sports Medicine Industry Volume Share (%), by Product 2024 & 2032
- Figure 87: South America Sports Medicine Industry Revenue (Million), by Application 2024 & 2032
- Figure 88: South America Sports Medicine Industry Volume (K Unit), by Application 2024 & 2032
- Figure 89: South America Sports Medicine Industry Revenue Share (%), by Application 2024 & 2032
- Figure 90: South America Sports Medicine Industry Volume Share (%), by Application 2024 & 2032
- Figure 91: South America Sports Medicine Industry Revenue (Million), by Country 2024 & 2032
- Figure 92: South America Sports Medicine Industry Volume (K Unit), by Country 2024 & 2032
- Figure 93: South America Sports Medicine Industry Revenue Share (%), by Country 2024 & 2032
- Figure 94: South America Sports Medicine Industry Volume Share (%), by Country 2024 & 2032
List of Tables
- Table 1: Global Sports Medicine Industry Revenue Million Forecast, by Region 2019 & 2032
- Table 2: Global Sports Medicine Industry Volume K Unit Forecast, by Region 2019 & 2032
- Table 3: Global Sports Medicine Industry Revenue Million Forecast, by Product 2019 & 2032
- Table 4: Global Sports Medicine Industry Volume K Unit Forecast, by Product 2019 & 2032
- Table 5: Global Sports Medicine Industry Revenue Million Forecast, by Application 2019 & 2032
- Table 6: Global Sports Medicine Industry Volume K Unit Forecast, by Application 2019 & 2032
- Table 7: Global Sports Medicine Industry Revenue Million Forecast, by Region 2019 & 2032
- Table 8: Global Sports Medicine Industry Volume K Unit Forecast, by Region 2019 & 2032
- Table 9: Global Sports Medicine Industry Revenue Million Forecast, by Country 2019 & 2032
- Table 10: Global Sports Medicine Industry Volume K Unit Forecast, by Country 2019 & 2032
- Table 11: Global Sports Medicine Industry Revenue Million Forecast, by Country 2019 & 2032
- Table 12: Global Sports Medicine Industry Volume K Unit Forecast, by Country 2019 & 2032
- Table 13: Global Sports Medicine Industry Revenue Million Forecast, by Country 2019 & 2032
- Table 14: Global Sports Medicine Industry Volume K Unit Forecast, by Country 2019 & 2032
- Table 15: Global Sports Medicine Industry Revenue Million Forecast, by Country 2019 & 2032
- Table 16: Global Sports Medicine Industry Volume K Unit Forecast, by Country 2019 & 2032
- Table 17: Global Sports Medicine Industry Revenue Million Forecast, by Country 2019 & 2032
- Table 18: Global Sports Medicine Industry Volume K Unit Forecast, by Country 2019 & 2032
- Table 19: Global Sports Medicine Industry Revenue Million Forecast, by Product 2019 & 2032
- Table 20: Global Sports Medicine Industry Volume K Unit Forecast, by Product 2019 & 2032
- Table 21: Global Sports Medicine Industry Revenue Million Forecast, by Application 2019 & 2032
- Table 22: Global Sports Medicine Industry Volume K Unit Forecast, by Application 2019 & 2032
- Table 23: Global Sports Medicine Industry Revenue Million Forecast, by Country 2019 & 2032
- Table 24: Global Sports Medicine Industry Volume K Unit Forecast, by Country 2019 & 2032
- Table 25: United States Sports Medicine Industry Revenue (Million) Forecast, by Application 2019 & 2032
- Table 26: United States Sports Medicine Industry Volume (K Unit) Forecast, by Application 2019 & 2032
- Table 27: Canada Sports Medicine Industry Revenue (Million) Forecast, by Application 2019 & 2032
- Table 28: Canada Sports Medicine Industry Volume (K Unit) Forecast, by Application 2019 & 2032
- Table 29: Mexico Sports Medicine Industry Revenue (Million) Forecast, by Application 2019 & 2032
- Table 30: Mexico Sports Medicine Industry Volume (K Unit) Forecast, by Application 2019 & 2032
- Table 31: Global Sports Medicine Industry Revenue Million Forecast, by Product 2019 & 2032
- Table 32: Global Sports Medicine Industry Volume K Unit Forecast, by Product 2019 & 2032
- Table 33: Global Sports Medicine Industry Revenue Million Forecast, by Application 2019 & 2032
- Table 34: Global Sports Medicine Industry Volume K Unit Forecast, by Application 2019 & 2032
- Table 35: Global Sports Medicine Industry Revenue Million Forecast, by Country 2019 & 2032
- Table 36: Global Sports Medicine Industry Volume K Unit Forecast, by Country 2019 & 2032
- Table 37: Germany Sports Medicine Industry Revenue (Million) Forecast, by Application 2019 & 2032
- Table 38: Germany Sports Medicine Industry Volume (K Unit) Forecast, by Application 2019 & 2032
- Table 39: United Kingdom Sports Medicine Industry Revenue (Million) Forecast, by Application 2019 & 2032
- Table 40: United Kingdom Sports Medicine Industry Volume (K Unit) Forecast, by Application 2019 & 2032
- Table 41: France Sports Medicine Industry Revenue (Million) Forecast, by Application 2019 & 2032
- Table 42: France Sports Medicine Industry Volume (K Unit) Forecast, by Application 2019 & 2032
- Table 43: Italy Sports Medicine Industry Revenue (Million) Forecast, by Application 2019 & 2032
- Table 44: Italy Sports Medicine Industry Volume (K Unit) Forecast, by Application 2019 & 2032
- Table 45: Spain Sports Medicine Industry Revenue (Million) Forecast, by Application 2019 & 2032
- Table 46: Spain Sports Medicine Industry Volume (K Unit) Forecast, by Application 2019 & 2032
- Table 47: Rest of Europe Sports Medicine Industry Revenue (Million) Forecast, by Application 2019 & 2032
- Table 48: Rest of Europe Sports Medicine Industry Volume (K Unit) Forecast, by Application 2019 & 2032
- Table 49: Global Sports Medicine Industry Revenue Million Forecast, by Product 2019 & 2032
- Table 50: Global Sports Medicine Industry Volume K Unit Forecast, by Product 2019 & 2032
- Table 51: Global Sports Medicine Industry Revenue Million Forecast, by Application 2019 & 2032
- Table 52: Global Sports Medicine Industry Volume K Unit Forecast, by Application 2019 & 2032
- Table 53: Global Sports Medicine Industry Revenue Million Forecast, by Country 2019 & 2032
- Table 54: Global Sports Medicine Industry Volume K Unit Forecast, by Country 2019 & 2032
- Table 55: China Sports Medicine Industry Revenue (Million) Forecast, by Application 2019 & 2032
- Table 56: China Sports Medicine Industry Volume (K Unit) Forecast, by Application 2019 & 2032
- Table 57: Japan Sports Medicine Industry Revenue (Million) Forecast, by Application 2019 & 2032
- Table 58: Japan Sports Medicine Industry Volume (K Unit) Forecast, by Application 2019 & 2032
- Table 59: India Sports Medicine Industry Revenue (Million) Forecast, by Application 2019 & 2032
- Table 60: India Sports Medicine Industry Volume (K Unit) Forecast, by Application 2019 & 2032
- Table 61: Australia Sports Medicine Industry Revenue (Million) Forecast, by Application 2019 & 2032
- Table 62: Australia Sports Medicine Industry Volume (K Unit) Forecast, by Application 2019 & 2032
- Table 63: South Korea Sports Medicine Industry Revenue (Million) Forecast, by Application 2019 & 2032
- Table 64: South Korea Sports Medicine Industry Volume (K Unit) Forecast, by Application 2019 & 2032
- Table 65: Rest of Asia Pacific Sports Medicine Industry Revenue (Million) Forecast, by Application 2019 & 2032
- Table 66: Rest of Asia Pacific Sports Medicine Industry Volume (K Unit) Forecast, by Application 2019 & 2032
- Table 67: Global Sports Medicine Industry Revenue Million Forecast, by Product 2019 & 2032
- Table 68: Global Sports Medicine Industry Volume K Unit Forecast, by Product 2019 & 2032
- Table 69: Global Sports Medicine Industry Revenue Million Forecast, by Application 2019 & 2032
- Table 70: Global Sports Medicine Industry Volume K Unit Forecast, by Application 2019 & 2032
- Table 71: Global Sports Medicine Industry Revenue Million Forecast, by Country 2019 & 2032
- Table 72: Global Sports Medicine Industry Volume K Unit Forecast, by Country 2019 & 2032
- Table 73: Global Sports Medicine Industry Revenue Million Forecast, by Product 2019 & 2032
- Table 74: Global Sports Medicine Industry Volume K Unit Forecast, by Product 2019 & 2032
- Table 75: Global Sports Medicine Industry Revenue Million Forecast, by Application 2019 & 2032
- Table 76: Global Sports Medicine Industry Volume K Unit Forecast, by Application 2019 & 2032
- Table 77: Global Sports Medicine Industry Revenue Million Forecast, by Country 2019 & 2032
- Table 78: Global Sports Medicine Industry Volume K Unit Forecast, by Country 2019 & 2032
- Table 79: South Africa Sports Medicine Industry Revenue (Million) Forecast, by Application 2019 & 2032
- Table 80: South Africa Sports Medicine Industry Volume (K Unit) Forecast, by Application 2019 & 2032
- Table 81: Rest of Middle East Sports Medicine Industry Revenue (Million) Forecast, by Application 2019 & 2032
- Table 82: Rest of Middle East Sports Medicine Industry Volume (K Unit) Forecast, by Application 2019 & 2032
- Table 83: Global Sports Medicine Industry Revenue Million Forecast, by Product 2019 & 2032
- Table 84: Global Sports Medicine Industry Volume K Unit Forecast, by Product 2019 & 2032
- Table 85: Global Sports Medicine Industry Revenue Million Forecast, by Application 2019 & 2032
- Table 86: Global Sports Medicine Industry Volume K Unit Forecast, by Application 2019 & 2032
- Table 87: Global Sports Medicine Industry Revenue Million Forecast, by Country 2019 & 2032
- Table 88: Global Sports Medicine Industry Volume K Unit Forecast, by Country 2019 & 2032
- Table 89: Brazil Sports Medicine Industry Revenue (Million) Forecast, by Application 2019 & 2032
- Table 90: Brazil Sports Medicine Industry Volume (K Unit) Forecast, by Application 2019 & 2032
- Table 91: Argentina Sports Medicine Industry Revenue (Million) Forecast, by Application 2019 & 2032
- Table 92: Argentina Sports Medicine Industry Volume (K Unit) Forecast, by Application 2019 & 2032
- Table 93: Rest of South America Sports Medicine Industry Revenue (Million) Forecast, by Application 2019 & 2032
- Table 94: Rest of South America Sports Medicine Industry Volume (K Unit) Forecast, by Application 2019 & 2032
Frequently Asked Questions
1. What is the projected Compound Annual Growth Rate (CAGR) of the Sports Medicine Industry?
The projected CAGR is approximately 2.71%.
2. Which companies are prominent players in the Sports Medicine Industry?
Key companies in the market include CONMED Corporation, Smith & Nephew, Arthrex Inc, Breg Inc, Wright Medical Group, DJO Global Inc , Performance Health, Medtronic PLC, Johnson & Johnson, Mueller Sports Medicine Inc, Stryker Corporation, Zimmer Biomet Holdings Inc.
3. What are the main segments of the Sports Medicine Industry?
The market segments include Product, Application.
4. Can you provide details about the market size?
The market size is estimated to be USD 7.97 Million as of 2022.
5. What are some drivers contributing to market growth?
Rising Burden of Sports Injuries; Consistent Innovation of New Products and Treatment Modalities; Rising Demand for Minimally Invasive Surgeries.
6. What are the notable trends driving market growth?
Braces are Expected to Observe Good Growth over the Forecast Period.
7. Are there any restraints impacting market growth?
High Cost of Implants and Devices; Dearth of a Proper Sports Ecosystem.
8. Can you provide examples of recent developments in the market?
In July 2020, Anika Therapeutics Inc. received the US Food and Drug Administration (USFDA) clearance for six innovative products that address the needs of orthopedic and sports medicine surgeons. The products are planned to be commercialized in the future.
9. What pricing options are available for accessing the report?
Pricing options include single-user, multi-user, and enterprise licenses priced at USD 4750, USD 5250, and USD 8750 respectively.
10. Is the market size provided in terms of value or volume?
The market size is provided in terms of value, measured in Million and volume, measured in K Unit.
11. Are there any specific market keywords associated with the report?
Yes, the market keyword associated with the report is "Sports Medicine Industry," which aids in identifying and referencing the specific market segment covered.
12. How do I determine which pricing option suits my needs best?
The pricing options vary based on user requirements and access needs. Individual users may opt for single-user licenses, while businesses requiring broader access may choose multi-user or enterprise licenses for cost-effective access to the report.
13. Are there any additional resources or data provided in the Sports Medicine Industry report?
While the report offers comprehensive insights, it's advisable to review the specific contents or supplementary materials provided to ascertain if additional resources or data are available.
14. How can I stay updated on further developments or reports in the Sports Medicine Industry?
To stay informed about further developments, trends, and reports in the Sports Medicine Industry, consider subscribing to industry newsletters, following relevant companies and organizations, or regularly checking reputable industry news sources and publications.
Methodology
Step 1 - Identification of Relevant Samples Size from Population Database


Step 2 - Approaches for Defining Global Market Size (Value, Volume* & Price*)

Note*: In applicable scenarios
Step 3 - Data Sources
Primary Research
- Web Analytics
- Survey Reports
- Research Institute
- Latest Research Reports
- Opinion Leaders
Secondary Research
- Annual Reports
- White Paper
- Latest Press Release
- Industry Association
- Paid Database
- Investor Presentations

Step 4 - Data Triangulation
Involves using different sources of information in order to increase the validity of a study
These sources are likely to be stakeholders in a program - participants, other researchers, program staff, other community members, and so on.
Then we put all data in single framework & apply various statistical tools to find out the dynamic on the market.
During the analysis stage, feedback from the stakeholder groups would be compared to determine areas of agreement as well as areas of divergence


