
Key Insights
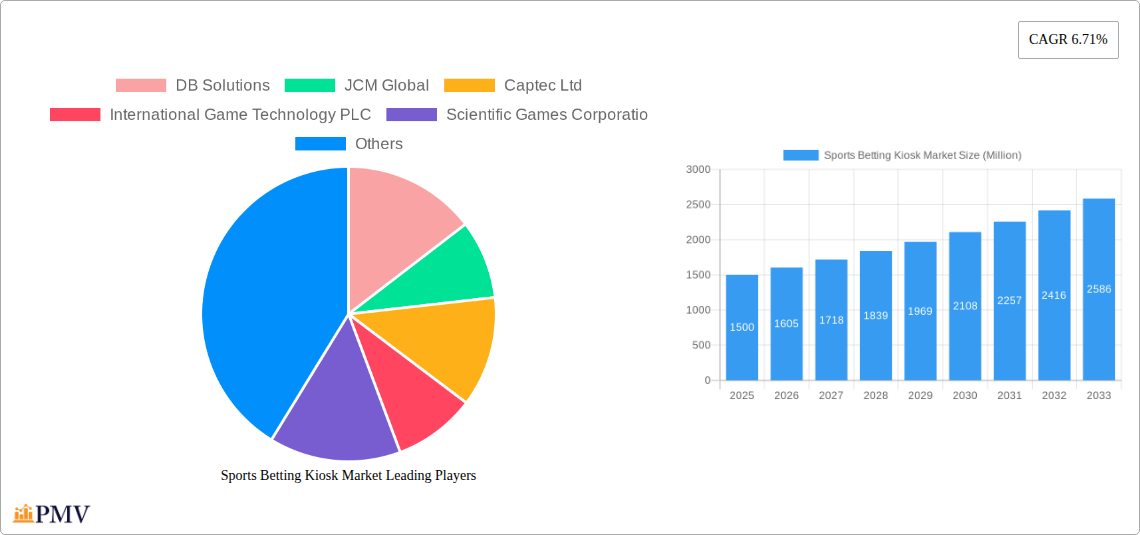
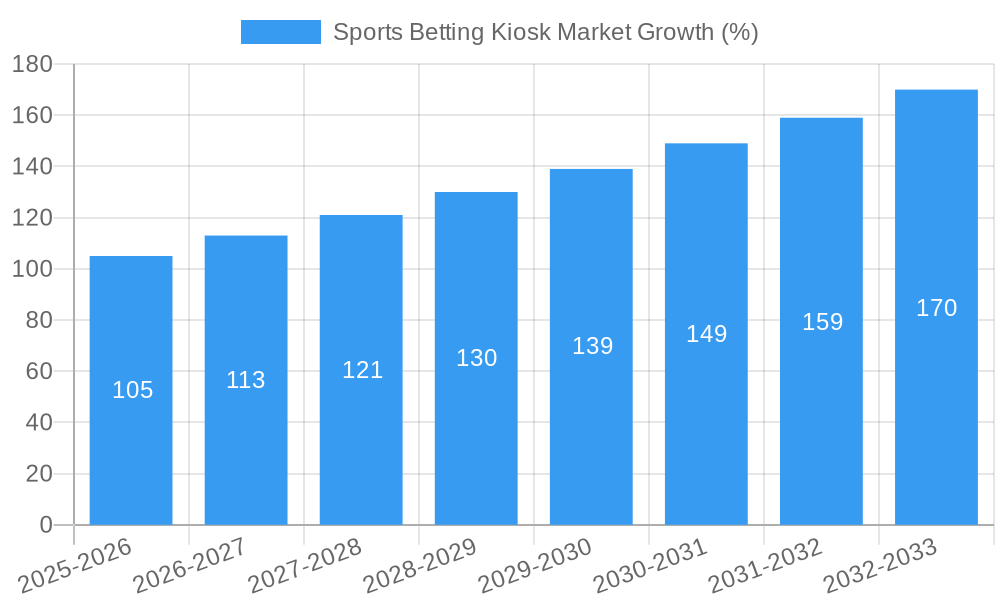
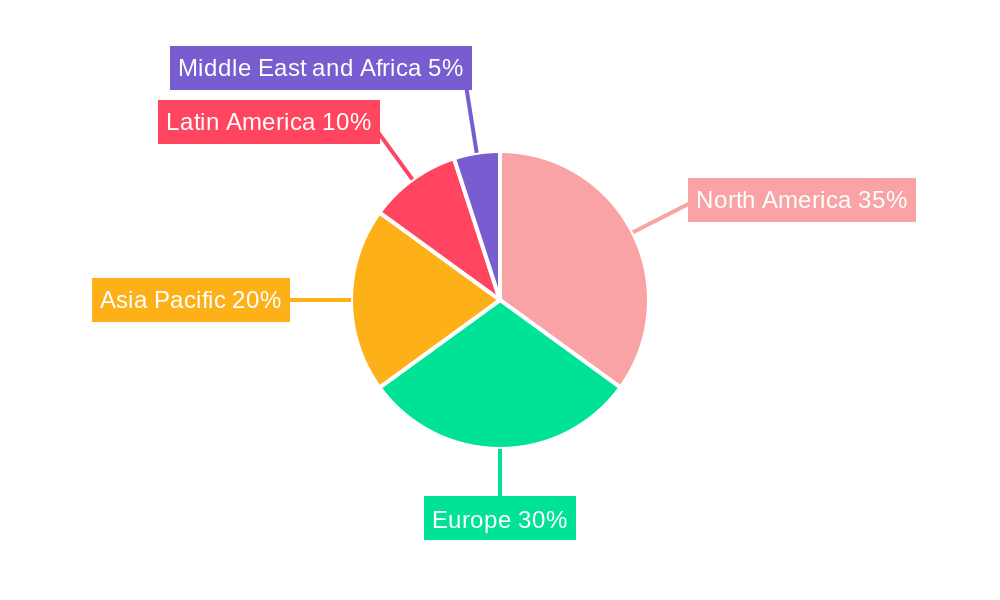
The global sports betting kiosk market is experiencing robust growth, driven by the increasing popularity of sports betting, technological advancements in kiosk technology, and the expansion of regulated sports betting markets worldwide. The market's compound annual growth rate (CAGR) of 6.71% from 2019 to 2024 suggests a significant upward trajectory, projected to continue into the forecast period (2025-2033). Key market segments include indoor and outdoor kiosks, catering to diverse applications in hotels, restaurants, retail spaces, casinos, sports venues, and cruise ships. The eSports segment is also emerging as a significant contributor, fueled by the growing popularity of competitive gaming and associated betting activities. Leading companies like DB Solutions, JCM Global, and Scientific Games are driving innovation, introducing user-friendly interfaces, enhanced security features, and seamless integration with existing betting platforms. The increasing adoption of self-service technologies in the gaming and hospitality sectors further fuels market expansion. Geographic growth is anticipated to be geographically diverse, with North America and Europe leading initially due to established regulatory frameworks and high sports betting engagement, followed by a surge in Asia-Pacific and Latin America as regulations evolve and consumer adoption increases. However, restraining factors such as regulatory hurdles in certain regions, concerns regarding responsible gaming, and the potential for technical malfunctions could temper growth. Nevertheless, the overall outlook remains positive, with the market poised for substantial expansion over the next decade.
The projected market size for 2025 serves as a strong foundation for future forecasting. Assuming a consistent CAGR of 6.71%, a reasonable estimation for future years can be developed. The ongoing integration of mobile betting and kiosk systems, coupled with the expansion of sports betting into new markets and demographics, will likely accelerate growth beyond the current projection. This suggests that strategic investments in kiosk technology, enhanced security measures, and strategic partnerships across the sports betting ecosystem will be crucial for companies seeking a strong market position. The segment breakdown (indoor/outdoor, various end-users) indicates opportunities for specialized kiosk development, further driving market segmentation and specialized service offerings. The presence of established players and new entrants suggests a competitive landscape where innovation and adaptability will be key for market success.
Sports Betting Kiosk Market: A Comprehensive Market Report (2019-2033)
This in-depth report provides a comprehensive analysis of the Sports Betting Kiosk Market, offering valuable insights for stakeholders across the industry. Covering the period from 2019 to 2033, with a focus on the forecast period (2025-2033) and a base year of 2025, this report meticulously examines market dynamics, competitive landscapes, and future growth potential. The study delves into various segments, including by application (indoor kiosks, outdoor kiosks, eSports) and by end-user (hotels, restaurants, retail shopping, casinos, sports clubs/sports stadiums, cruise ships), providing granular data and actionable strategic recommendations. The market is projected to reach xx Million by 2033.
Sports Betting Kiosk Market Structure & Competitive Dynamics
The Sports Betting Kiosk market exhibits a moderately concentrated structure, with several key players holding significant market share. The competitive landscape is characterized by intense innovation, driving the development of advanced features and functionalities in sports betting kiosks. Regulatory frameworks vary significantly across jurisdictions, influencing market entry and operational strategies. Product substitutes, such as mobile betting apps, pose a challenge, forcing kiosk providers to constantly innovate to maintain competitiveness. End-user trends, particularly the increasing preference for seamless and personalized betting experiences, are shaping product development. Mergers and acquisitions (M&A) activity within the sector is moderate, with deal values varying depending on the size and strategic importance of the acquired companies.
- Market Concentration: Moderate, with top 5 players holding approximately xx% market share in 2025.
- Innovation Ecosystems: Robust, driven by technological advancements in software, hardware, and security features.
- Regulatory Frameworks: Vary significantly across regions, creating both opportunities and challenges.
- Product Substitutes: Mobile betting apps pose a significant competitive threat.
- End-User Trends: Demand for enhanced user experience and personalized betting options is increasing.
- M&A Activities: Moderate activity observed in recent years, with deal values ranging from xx Million to xx Million. The average deal size in the last 5 years is xx Million.
Sports Betting Kiosk Market Industry Trends & Insights
The Sports Betting Kiosk market is experiencing robust growth, driven by several key factors. The increasing legalization and regulation of sports betting in various jurisdictions are significantly boosting market expansion. Technological advancements, such as improved user interfaces, enhanced security features, and integration with mobile platforms, are enhancing user experience and driving adoption. Consumer preferences are shifting towards convenient and accessible betting options, favoring the deployment of kiosks in high-traffic locations. The rise of eSports is also contributing to the growth, as dedicated kiosks cater to this burgeoning market segment. The market is expected to register a CAGR of xx% during the forecast period. Market penetration in key regions is expected to increase from xx% in 2025 to xx% by 2033. The competitive landscape is characterized by intense competition, with key players focusing on innovation, strategic partnerships, and expansion into new markets.
Dominant Markets & Segments in Sports Betting Kiosk Market
The North American market currently dominates the global sports betting kiosk market, driven primarily by the United States, where the legalization of sports betting has fueled significant growth. Within the application segment, indoor kiosks currently hold the largest market share due to their prevalence in casinos and other indoor venues. However, outdoor kiosks are projected to experience substantial growth driven by their strategic placement in high-traffic areas.
- Key Drivers for North American Dominance:
- Legalization and regulation of sports betting in multiple states.
- High density of casinos and sports venues.
- Strong consumer interest in sports betting.
- Indoor Kiosks: High market share due to existing infrastructure in casinos and other indoor locations.
- Outdoor Kiosks: Projected high growth due to accessibility and convenient placement in high traffic areas.
- eSports: Growing segment driven by the increasing popularity of competitive gaming.
Sports Betting Kiosk Market Product Innovations
Recent product innovations in the sports betting kiosk market focus on enhancing user experience, improving security, and expanding functionalities. This includes the integration of advanced technologies such as touch screen interfaces, biometric authentication, and seamless mobile integration. These advancements are enabling a more intuitive and secure betting experience, attracting a wider range of users and boosting market adoption. Kiosks are becoming more versatile, offering features beyond basic betting, such as loyalty program enrollment and promotional offers.
Report Segmentation & Scope
This report segments the Sports Betting Kiosk market in two ways:
By Application:
Indoor Kiosks: This segment is expected to maintain a significant market share throughout the forecast period, driven by the high concentration of potential customers in casinos and other indoor venues. Growth is projected at xx% CAGR. Competitive dynamics are intense due to the established presence of major players.
Outdoor Kiosks: This segment is anticipated to experience the fastest growth, due to increasing placement in high-traffic locations like sports stadiums, shopping malls, and airports. The market size is projected to reach xx Million by 2033. Competition is increasing, with new players entering the market.
eSports: This emerging segment is showing promising growth potential due to the rising popularity of eSports. The segment's market size is expected to reach xx Million by 2033, driven by the young and tech-savvy demographic. Competitive dynamics are shaping up with specialized kiosk solutions.
By End-User:
- Casinos: This segment maintains a significant market share due to the established presence of sports betting within casinos.
- Hotels & Restaurants: Growth driven by increasing integration into hospitality settings.
- Retail Shopping: Potential for significant expansion, with opportunities for placement in high-traffic retail locations.
- Sports Clubs/Stadiums: This segment is witnessing robust growth due to the direct access to sports enthusiasts.
- Cruise Ships: A niche market with potential for growth in line with the cruise industry's expansion.
Key Drivers of Sports Betting Kiosk Market Growth
The growth of the sports betting kiosk market is propelled by several factors: the increasing legalization and regulation of sports betting globally, the rising adoption of technology leading to enhanced user interfaces and security, and the consumers' preference for convenient and accessible betting options. Furthermore, the integration of these kiosks into diverse locations, such as retail establishments and hospitality venues, provides wider access and contributes to market expansion.
Challenges in the Sports Betting Kiosk Market Sector
The sports betting kiosk market faces several challenges including stringent regulatory hurdles in various jurisdictions, potential supply chain disruptions impacting manufacturing and deployment, and intense competition from mobile betting platforms. These factors can create uncertainties in market growth and profitability for stakeholders. Security concerns and the risk of fraud also represent significant challenges.
Leading Players in the Sports Betting Kiosk Market
- DB Solutions
- JCM Global
- Captec Ltd
- International Game Technology PLC
- Scientific Games Corporation
- KIOSK Information Systems
- Olea Kiosks Inc
- Kambi Group PLC
- SBTech Malta Limited
- NOVOMATIC Sports Betting Solutions
Key Developments in Sports Betting Kiosk Market Sector
- July 2023: Table Trac, Inc. announced a joint venture with Centennial Gaming Systems to offer unattended loyalty card services, enhancing kiosk functionalities.
- February 2023: Playtech partnered with Gold Rush Gaming to distribute its sports betting kiosk software and management systems in Ohio, expanding its market reach.
- Ongoing: The American Gaming Association (AGA) projects significant growth in US sports betting revenue, to USD 16 Billion, indicating a positive outlook for the market.
Strategic Sports Betting Kiosk Market Outlook
The future of the sports betting kiosk market looks promising, with continued growth driven by technological advancements, regulatory changes, and increasing consumer demand. Strategic opportunities exist in expanding into new geographic markets, developing innovative kiosk functionalities, and forging strategic partnerships to enhance market penetration. Focusing on enhancing user experience and security will be crucial for success in this competitive landscape.
Sports Betting Kiosk Market Segmentation
-
1. Application
- 1.1. Indoor kiosks
- 1.2. outdoor kiosks
- 1.3. eSports
-
2. End-User
- 2.1. Hotels
- 2.2. Restaurants
- 2.3. Retail Shopping
- 2.4. Casinos
- 2.5. Sports Clubs/Sports Stadiums
- 2.6. Cruise Ships
Sports Betting Kiosk Market Segmentation By Geography
- 1. North America
- 2. Europe
- 3. Asia
- 4. Australia and New Zealand
- 5. Latin America
- 6. Middle East and Africa
Sports Betting Kiosk Market REPORT HIGHLIGHTS
| Aspects | Details |
|---|---|
| Study Period | 2019-2033 |
| Base Year | 2024 |
| Estimated Year | 2025 |
| Forecast Period | 2025-2033 |
| Historical Period | 2019-2024 |
| Growth Rate | CAGR of 6.71% from 2019-2033 |
| Segmentation |
|
Table of Contents
- 1. Introduction
- 1.1. Research Scope
- 1.2. Market Segmentation
- 1.3. Research Methodology
- 1.4. Definitions and Assumptions
- 2. Executive Summary
- 2.1. Introduction
- 3. Market Dynamics
- 3.1. Introduction
- 3.2. Market Drivers
- 3.2.1. sports betting with minimal space and Increase in customer transactions; Growing demand for automated selfoservice kiosks solution
- 3.3. Market Restrains
- 3.3.1. Cyber Security concerns may hinder the growth of the sports betting kiosk market
- 3.4. Market Trends
- 3.4.1. Retail and Casino will dominate the Market
- 4. Market Factor Analysis
- 4.1. Porters Five Forces
- 4.2. Supply/Value Chain
- 4.3. PESTEL analysis
- 4.4. Market Entropy
- 4.5. Patent/Trademark Analysis
- 5. Global Sports Betting Kiosk Market Analysis, Insights and Forecast, 2019-2031
- 5.1. Market Analysis, Insights and Forecast - by Application
- 5.1.1. Indoor kiosks
- 5.1.2. outdoor kiosks
- 5.1.3. eSports
- 5.2. Market Analysis, Insights and Forecast - by End-User
- 5.2.1. Hotels
- 5.2.2. Restaurants
- 5.2.3. Retail Shopping
- 5.2.4. Casinos
- 5.2.5. Sports Clubs/Sports Stadiums
- 5.2.6. Cruise Ships
- 5.3. Market Analysis, Insights and Forecast - by Region
- 5.3.1. North America
- 5.3.2. Europe
- 5.3.3. Asia
- 5.3.4. Australia and New Zealand
- 5.3.5. Latin America
- 5.3.6. Middle East and Africa
- 5.1. Market Analysis, Insights and Forecast - by Application
- 6. North America Sports Betting Kiosk Market Analysis, Insights and Forecast, 2019-2031
- 6.1. Market Analysis, Insights and Forecast - by Application
- 6.1.1. Indoor kiosks
- 6.1.2. outdoor kiosks
- 6.1.3. eSports
- 6.2. Market Analysis, Insights and Forecast - by End-User
- 6.2.1. Hotels
- 6.2.2. Restaurants
- 6.2.3. Retail Shopping
- 6.2.4. Casinos
- 6.2.5. Sports Clubs/Sports Stadiums
- 6.2.6. Cruise Ships
- 6.1. Market Analysis, Insights and Forecast - by Application
- 7. Europe Sports Betting Kiosk Market Analysis, Insights and Forecast, 2019-2031
- 7.1. Market Analysis, Insights and Forecast - by Application
- 7.1.1. Indoor kiosks
- 7.1.2. outdoor kiosks
- 7.1.3. eSports
- 7.2. Market Analysis, Insights and Forecast - by End-User
- 7.2.1. Hotels
- 7.2.2. Restaurants
- 7.2.3. Retail Shopping
- 7.2.4. Casinos
- 7.2.5. Sports Clubs/Sports Stadiums
- 7.2.6. Cruise Ships
- 7.1. Market Analysis, Insights and Forecast - by Application
- 8. Asia Sports Betting Kiosk Market Analysis, Insights and Forecast, 2019-2031
- 8.1. Market Analysis, Insights and Forecast - by Application
- 8.1.1. Indoor kiosks
- 8.1.2. outdoor kiosks
- 8.1.3. eSports
- 8.2. Market Analysis, Insights and Forecast - by End-User
- 8.2.1. Hotels
- 8.2.2. Restaurants
- 8.2.3. Retail Shopping
- 8.2.4. Casinos
- 8.2.5. Sports Clubs/Sports Stadiums
- 8.2.6. Cruise Ships
- 8.1. Market Analysis, Insights and Forecast - by Application
- 9. Australia and New Zealand Sports Betting Kiosk Market Analysis, Insights and Forecast, 2019-2031
- 9.1. Market Analysis, Insights and Forecast - by Application
- 9.1.1. Indoor kiosks
- 9.1.2. outdoor kiosks
- 9.1.3. eSports
- 9.2. Market Analysis, Insights and Forecast - by End-User
- 9.2.1. Hotels
- 9.2.2. Restaurants
- 9.2.3. Retail Shopping
- 9.2.4. Casinos
- 9.2.5. Sports Clubs/Sports Stadiums
- 9.2.6. Cruise Ships
- 9.1. Market Analysis, Insights and Forecast - by Application
- 10. Latin America Sports Betting Kiosk Market Analysis, Insights and Forecast, 2019-2031
- 10.1. Market Analysis, Insights and Forecast - by Application
- 10.1.1. Indoor kiosks
- 10.1.2. outdoor kiosks
- 10.1.3. eSports
- 10.2. Market Analysis, Insights and Forecast - by End-User
- 10.2.1. Hotels
- 10.2.2. Restaurants
- 10.2.3. Retail Shopping
- 10.2.4. Casinos
- 10.2.5. Sports Clubs/Sports Stadiums
- 10.2.6. Cruise Ships
- 10.1. Market Analysis, Insights and Forecast - by Application
- 11. Middle East and Africa Sports Betting Kiosk Market Analysis, Insights and Forecast, 2019-2031
- 11.1. Market Analysis, Insights and Forecast - by Application
- 11.1.1. Indoor kiosks
- 11.1.2. outdoor kiosks
- 11.1.3. eSports
- 11.2. Market Analysis, Insights and Forecast - by End-User
- 11.2.1. Hotels
- 11.2.2. Restaurants
- 11.2.3. Retail Shopping
- 11.2.4. Casinos
- 11.2.5. Sports Clubs/Sports Stadiums
- 11.2.6. Cruise Ships
- 11.1. Market Analysis, Insights and Forecast - by Application
- 12. North America Sports Betting Kiosk Market Analysis, Insights and Forecast, 2019-2031
- 12.1. Market Analysis, Insights and Forecast - By Country/Sub-region
- 12.1.1.
- 13. Europe Sports Betting Kiosk Market Analysis, Insights and Forecast, 2019-2031
- 13.1. Market Analysis, Insights and Forecast - By Country/Sub-region
- 13.1.1.
- 14. Asia Pacific Sports Betting Kiosk Market Analysis, Insights and Forecast, 2019-2031
- 14.1. Market Analysis, Insights and Forecast - By Country/Sub-region
- 14.1.1.
- 15. Latin America Sports Betting Kiosk Market Analysis, Insights and Forecast, 2019-2031
- 15.1. Market Analysis, Insights and Forecast - By Country/Sub-region
- 15.1.1.
- 16. Middle East and Africa Sports Betting Kiosk Market Analysis, Insights and Forecast, 2019-2031
- 16.1. Market Analysis, Insights and Forecast - By Country/Sub-region
- 16.1.1.
- 17. Competitive Analysis
- 17.1. Global Market Share Analysis 2024
- 17.2. Company Profiles
- 17.2.1 DB Solutions
- 17.2.1.1. Overview
- 17.2.1.2. Products
- 17.2.1.3. SWOT Analysis
- 17.2.1.4. Recent Developments
- 17.2.1.5. Financials (Based on Availability)
- 17.2.2 JCM Global
- 17.2.2.1. Overview
- 17.2.2.2. Products
- 17.2.2.3. SWOT Analysis
- 17.2.2.4. Recent Developments
- 17.2.2.5. Financials (Based on Availability)
- 17.2.3 Captec Ltd
- 17.2.3.1. Overview
- 17.2.3.2. Products
- 17.2.3.3. SWOT Analysis
- 17.2.3.4. Recent Developments
- 17.2.3.5. Financials (Based on Availability)
- 17.2.4 International Game Technology PLC
- 17.2.4.1. Overview
- 17.2.4.2. Products
- 17.2.4.3. SWOT Analysis
- 17.2.4.4. Recent Developments
- 17.2.4.5. Financials (Based on Availability)
- 17.2.5 Scientific Games Corporatio
- 17.2.5.1. Overview
- 17.2.5.2. Products
- 17.2.5.3. SWOT Analysis
- 17.2.5.4. Recent Developments
- 17.2.5.5. Financials (Based on Availability)
- 17.2.6 KIOSK Information Systems
- 17.2.6.1. Overview
- 17.2.6.2. Products
- 17.2.6.3. SWOT Analysis
- 17.2.6.4. Recent Developments
- 17.2.6.5. Financials (Based on Availability)
- 17.2.7 Olea Kiosks Inc
- 17.2.7.1. Overview
- 17.2.7.2. Products
- 17.2.7.3. SWOT Analysis
- 17.2.7.4. Recent Developments
- 17.2.7.5. Financials (Based on Availability)
- 17.2.8 Kambi Group PLC
- 17.2.8.1. Overview
- 17.2.8.2. Products
- 17.2.8.3. SWOT Analysis
- 17.2.8.4. Recent Developments
- 17.2.8.5. Financials (Based on Availability)
- 17.2.9 SBTech Malta Limited
- 17.2.9.1. Overview
- 17.2.9.2. Products
- 17.2.9.3. SWOT Analysis
- 17.2.9.4. Recent Developments
- 17.2.9.5. Financials (Based on Availability)
- 17.2.10 NOVOMATIC Sports Betting Solutions
- 17.2.10.1. Overview
- 17.2.10.2. Products
- 17.2.10.3. SWOT Analysis
- 17.2.10.4. Recent Developments
- 17.2.10.5. Financials (Based on Availability)
- 17.2.1 DB Solutions
List of Figures
- Figure 1: Global Sports Betting Kiosk Market Revenue Breakdown (Million, %) by Region 2024 & 2032
- Figure 2: North America Sports Betting Kiosk Market Revenue (Million), by Country 2024 & 2032
- Figure 3: North America Sports Betting Kiosk Market Revenue Share (%), by Country 2024 & 2032
- Figure 4: Europe Sports Betting Kiosk Market Revenue (Million), by Country 2024 & 2032
- Figure 5: Europe Sports Betting Kiosk Market Revenue Share (%), by Country 2024 & 2032
- Figure 6: Asia Pacific Sports Betting Kiosk Market Revenue (Million), by Country 2024 & 2032
- Figure 7: Asia Pacific Sports Betting Kiosk Market Revenue Share (%), by Country 2024 & 2032
- Figure 8: Latin America Sports Betting Kiosk Market Revenue (Million), by Country 2024 & 2032
- Figure 9: Latin America Sports Betting Kiosk Market Revenue Share (%), by Country 2024 & 2032
- Figure 10: Middle East and Africa Sports Betting Kiosk Market Revenue (Million), by Country 2024 & 2032
- Figure 11: Middle East and Africa Sports Betting Kiosk Market Revenue Share (%), by Country 2024 & 2032
- Figure 12: North America Sports Betting Kiosk Market Revenue (Million), by Application 2024 & 2032
- Figure 13: North America Sports Betting Kiosk Market Revenue Share (%), by Application 2024 & 2032
- Figure 14: North America Sports Betting Kiosk Market Revenue (Million), by End-User 2024 & 2032
- Figure 15: North America Sports Betting Kiosk Market Revenue Share (%), by End-User 2024 & 2032
- Figure 16: North America Sports Betting Kiosk Market Revenue (Million), by Country 2024 & 2032
- Figure 17: North America Sports Betting Kiosk Market Revenue Share (%), by Country 2024 & 2032
- Figure 18: Europe Sports Betting Kiosk Market Revenue (Million), by Application 2024 & 2032
- Figure 19: Europe Sports Betting Kiosk Market Revenue Share (%), by Application 2024 & 2032
- Figure 20: Europe Sports Betting Kiosk Market Revenue (Million), by End-User 2024 & 2032
- Figure 21: Europe Sports Betting Kiosk Market Revenue Share (%), by End-User 2024 & 2032
- Figure 22: Europe Sports Betting Kiosk Market Revenue (Million), by Country 2024 & 2032
- Figure 23: Europe Sports Betting Kiosk Market Revenue Share (%), by Country 2024 & 2032
- Figure 24: Asia Sports Betting Kiosk Market Revenue (Million), by Application 2024 & 2032
- Figure 25: Asia Sports Betting Kiosk Market Revenue Share (%), by Application 2024 & 2032
- Figure 26: Asia Sports Betting Kiosk Market Revenue (Million), by End-User 2024 & 2032
- Figure 27: Asia Sports Betting Kiosk Market Revenue Share (%), by End-User 2024 & 2032
- Figure 28: Asia Sports Betting Kiosk Market Revenue (Million), by Country 2024 & 2032
- Figure 29: Asia Sports Betting Kiosk Market Revenue Share (%), by Country 2024 & 2032
- Figure 30: Australia and New Zealand Sports Betting Kiosk Market Revenue (Million), by Application 2024 & 2032
- Figure 31: Australia and New Zealand Sports Betting Kiosk Market Revenue Share (%), by Application 2024 & 2032
- Figure 32: Australia and New Zealand Sports Betting Kiosk Market Revenue (Million), by End-User 2024 & 2032
- Figure 33: Australia and New Zealand Sports Betting Kiosk Market Revenue Share (%), by End-User 2024 & 2032
- Figure 34: Australia and New Zealand Sports Betting Kiosk Market Revenue (Million), by Country 2024 & 2032
- Figure 35: Australia and New Zealand Sports Betting Kiosk Market Revenue Share (%), by Country 2024 & 2032
- Figure 36: Latin America Sports Betting Kiosk Market Revenue (Million), by Application 2024 & 2032
- Figure 37: Latin America Sports Betting Kiosk Market Revenue Share (%), by Application 2024 & 2032
- Figure 38: Latin America Sports Betting Kiosk Market Revenue (Million), by End-User 2024 & 2032
- Figure 39: Latin America Sports Betting Kiosk Market Revenue Share (%), by End-User 2024 & 2032
- Figure 40: Latin America Sports Betting Kiosk Market Revenue (Million), by Country 2024 & 2032
- Figure 41: Latin America Sports Betting Kiosk Market Revenue Share (%), by Country 2024 & 2032
- Figure 42: Middle East and Africa Sports Betting Kiosk Market Revenue (Million), by Application 2024 & 2032
- Figure 43: Middle East and Africa Sports Betting Kiosk Market Revenue Share (%), by Application 2024 & 2032
- Figure 44: Middle East and Africa Sports Betting Kiosk Market Revenue (Million), by End-User 2024 & 2032
- Figure 45: Middle East and Africa Sports Betting Kiosk Market Revenue Share (%), by End-User 2024 & 2032
- Figure 46: Middle East and Africa Sports Betting Kiosk Market Revenue (Million), by Country 2024 & 2032
- Figure 47: Middle East and Africa Sports Betting Kiosk Market Revenue Share (%), by Country 2024 & 2032
List of Tables
- Table 1: Global Sports Betting Kiosk Market Revenue Million Forecast, by Region 2019 & 2032
- Table 2: Global Sports Betting Kiosk Market Revenue Million Forecast, by Application 2019 & 2032
- Table 3: Global Sports Betting Kiosk Market Revenue Million Forecast, by End-User 2019 & 2032
- Table 4: Global Sports Betting Kiosk Market Revenue Million Forecast, by Region 2019 & 2032
- Table 5: Global Sports Betting Kiosk Market Revenue Million Forecast, by Country 2019 & 2032
- Table 6: Sports Betting Kiosk Market Revenue (Million) Forecast, by Application 2019 & 2032
- Table 7: Global Sports Betting Kiosk Market Revenue Million Forecast, by Country 2019 & 2032
- Table 8: Sports Betting Kiosk Market Revenue (Million) Forecast, by Application 2019 & 2032
- Table 9: Global Sports Betting Kiosk Market Revenue Million Forecast, by Country 2019 & 2032
- Table 10: Sports Betting Kiosk Market Revenue (Million) Forecast, by Application 2019 & 2032
- Table 11: Global Sports Betting Kiosk Market Revenue Million Forecast, by Country 2019 & 2032
- Table 12: Sports Betting Kiosk Market Revenue (Million) Forecast, by Application 2019 & 2032
- Table 13: Global Sports Betting Kiosk Market Revenue Million Forecast, by Country 2019 & 2032
- Table 14: Sports Betting Kiosk Market Revenue (Million) Forecast, by Application 2019 & 2032
- Table 15: Global Sports Betting Kiosk Market Revenue Million Forecast, by Application 2019 & 2032
- Table 16: Global Sports Betting Kiosk Market Revenue Million Forecast, by End-User 2019 & 2032
- Table 17: Global Sports Betting Kiosk Market Revenue Million Forecast, by Country 2019 & 2032
- Table 18: Global Sports Betting Kiosk Market Revenue Million Forecast, by Application 2019 & 2032
- Table 19: Global Sports Betting Kiosk Market Revenue Million Forecast, by End-User 2019 & 2032
- Table 20: Global Sports Betting Kiosk Market Revenue Million Forecast, by Country 2019 & 2032
- Table 21: Global Sports Betting Kiosk Market Revenue Million Forecast, by Application 2019 & 2032
- Table 22: Global Sports Betting Kiosk Market Revenue Million Forecast, by End-User 2019 & 2032
- Table 23: Global Sports Betting Kiosk Market Revenue Million Forecast, by Country 2019 & 2032
- Table 24: Global Sports Betting Kiosk Market Revenue Million Forecast, by Application 2019 & 2032
- Table 25: Global Sports Betting Kiosk Market Revenue Million Forecast, by End-User 2019 & 2032
- Table 26: Global Sports Betting Kiosk Market Revenue Million Forecast, by Country 2019 & 2032
- Table 27: Global Sports Betting Kiosk Market Revenue Million Forecast, by Application 2019 & 2032
- Table 28: Global Sports Betting Kiosk Market Revenue Million Forecast, by End-User 2019 & 2032
- Table 29: Global Sports Betting Kiosk Market Revenue Million Forecast, by Country 2019 & 2032
- Table 30: Global Sports Betting Kiosk Market Revenue Million Forecast, by Application 2019 & 2032
- Table 31: Global Sports Betting Kiosk Market Revenue Million Forecast, by End-User 2019 & 2032
- Table 32: Global Sports Betting Kiosk Market Revenue Million Forecast, by Country 2019 & 2032
Frequently Asked Questions
1. What is the projected Compound Annual Growth Rate (CAGR) of the Sports Betting Kiosk Market?
The projected CAGR is approximately 6.71%.
2. Which companies are prominent players in the Sports Betting Kiosk Market?
Key companies in the market include DB Solutions, JCM Global, Captec Ltd, International Game Technology PLC, Scientific Games Corporatio, KIOSK Information Systems, Olea Kiosks Inc, Kambi Group PLC, SBTech Malta Limited, NOVOMATIC Sports Betting Solutions.
3. What are the main segments of the Sports Betting Kiosk Market?
The market segments include Application, End-User.
4. Can you provide details about the market size?
The market size is estimated to be USD XX Million as of 2022.
5. What are some drivers contributing to market growth?
sports betting with minimal space and Increase in customer transactions; Growing demand for automated selfoservice kiosks solution.
6. What are the notable trends driving market growth?
Retail and Casino will dominate the Market.
7. Are there any restraints impacting market growth?
Cyber Security concerns may hinder the growth of the sports betting kiosk market.
8. Can you provide examples of recent developments in the market?
July 2023 - Table Trac, Inc., the provider of CasinoTrac, a comprehensive casino information and management system that automates and monitors casino operations, announced a Joint Venture with Centennial Gaming Systems aimed at offering unattended loyalty card re-printing and enrollment services.
9. What pricing options are available for accessing the report?
Pricing options include single-user, multi-user, and enterprise licenses priced at USD 4750, USD 5250, and USD 8750 respectively.
10. Is the market size provided in terms of value or volume?
The market size is provided in terms of value, measured in Million.
11. Are there any specific market keywords associated with the report?
Yes, the market keyword associated with the report is "Sports Betting Kiosk Market," which aids in identifying and referencing the specific market segment covered.
12. How do I determine which pricing option suits my needs best?
The pricing options vary based on user requirements and access needs. Individual users may opt for single-user licenses, while businesses requiring broader access may choose multi-user or enterprise licenses for cost-effective access to the report.
13. Are there any additional resources or data provided in the Sports Betting Kiosk Market report?
While the report offers comprehensive insights, it's advisable to review the specific contents or supplementary materials provided to ascertain if additional resources or data are available.
14. How can I stay updated on further developments or reports in the Sports Betting Kiosk Market?
To stay informed about further developments, trends, and reports in the Sports Betting Kiosk Market, consider subscribing to industry newsletters, following relevant companies and organizations, or regularly checking reputable industry news sources and publications.
Methodology
Step 1 - Identification of Relevant Samples Size from Population Database


Step 2 - Approaches for Defining Global Market Size (Value, Volume* & Price*)

Note*: In applicable scenarios
Step 3 - Data Sources
Primary Research
- Web Analytics
- Survey Reports
- Research Institute
- Latest Research Reports
- Opinion Leaders
Secondary Research
- Annual Reports
- White Paper
- Latest Press Release
- Industry Association
- Paid Database
- Investor Presentations

Step 4 - Data Triangulation
Involves using different sources of information in order to increase the validity of a study
These sources are likely to be stakeholders in a program - participants, other researchers, program staff, other community members, and so on.
Then we put all data in single framework & apply various statistical tools to find out the dynamic on the market.
During the analysis stage, feedback from the stakeholder groups would be compared to determine areas of agreement as well as areas of divergence


