
Key Insights
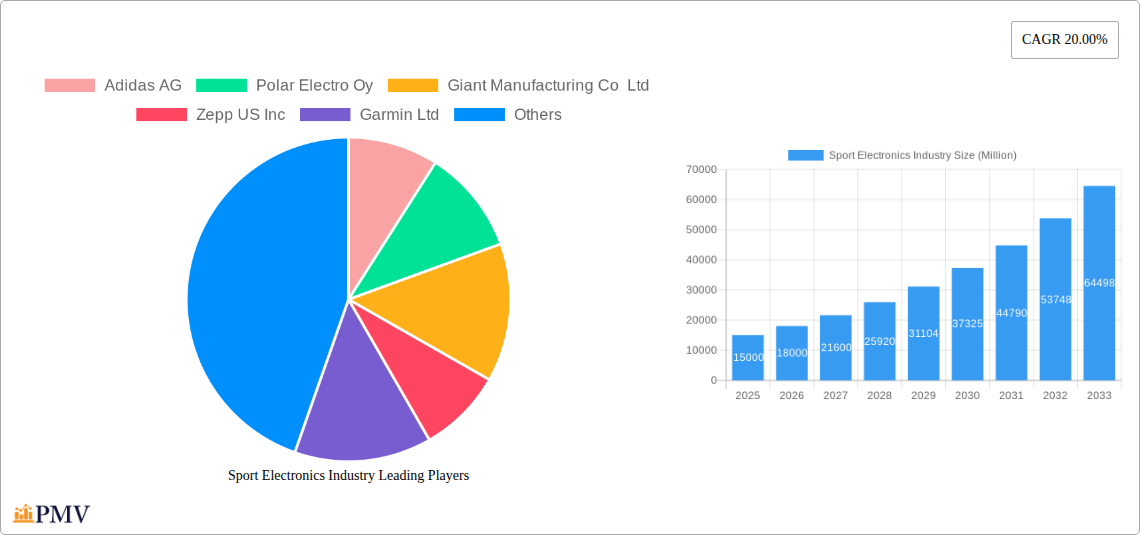
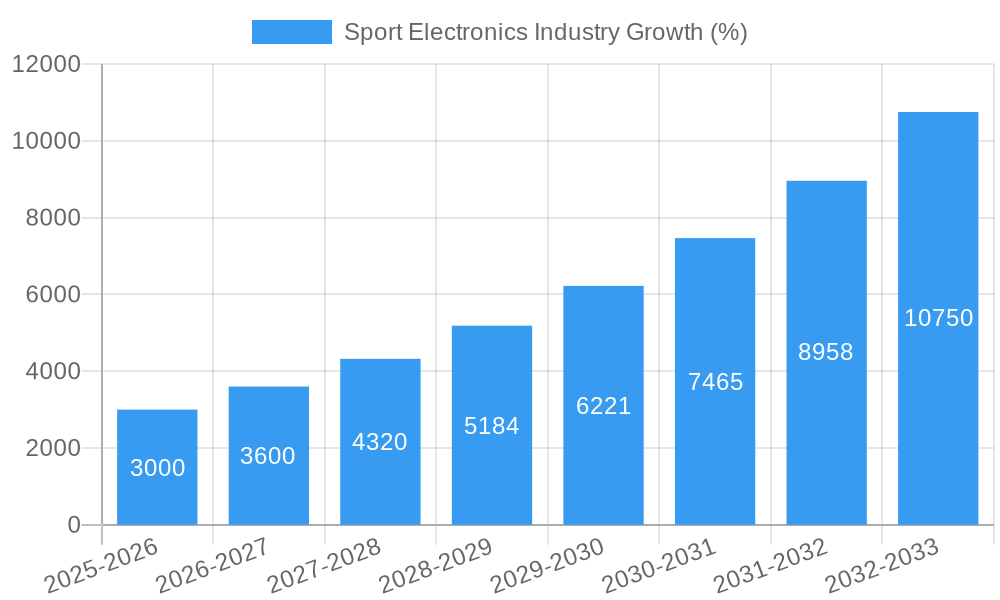
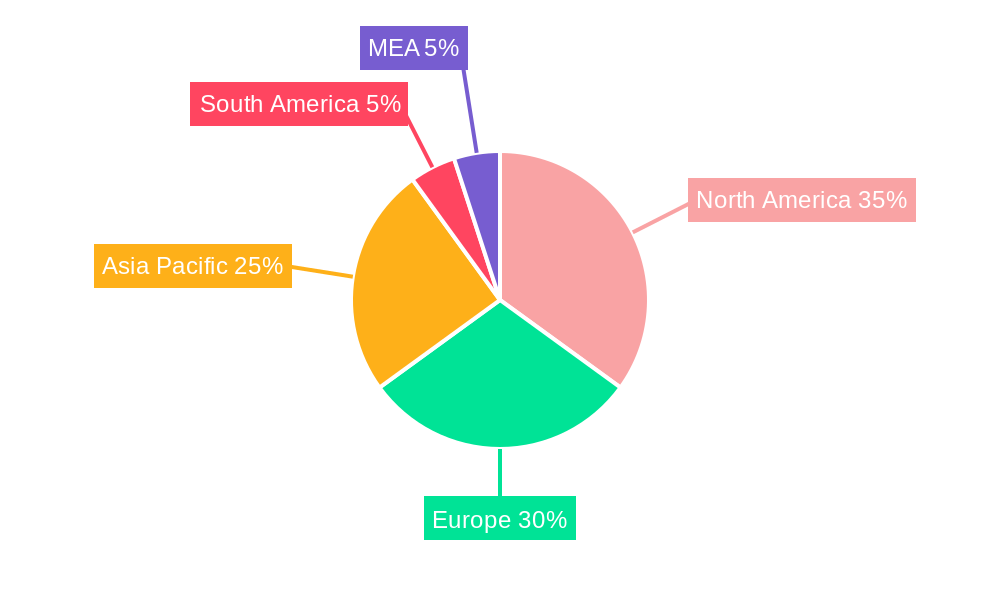
The global sport electronics market is experiencing robust growth, fueled by increasing health consciousness, technological advancements, and the rising popularity of fitness activities. With a Compound Annual Growth Rate (CAGR) of 20% from 2019 to 2024, the market demonstrates significant potential. The market's expansion is driven by factors such as the proliferation of wearable devices offering advanced fitness tracking capabilities (heart rate monitoring, GPS, sleep analysis), the integration of smart technology into sporting equipment, and the growing demand for data-driven performance enhancement tools among professional and amateur athletes. Key players like Adidas, Garmin, Apple, and Fitbit are continuously innovating to cater to this demand, launching new products with enhanced features and improved user experiences. The market segmentation reveals a strong preference for wearable devices, which dominate the product type category. The geographic distribution shows a high concentration of market share in North America and Europe, although the Asia-Pacific region is expected to witness significant growth in the coming years due to its burgeoning middle class and rising disposable incomes.
The forecast period (2025-2033) anticipates continued strong growth, albeit potentially at a slightly moderated pace as the market matures. Factors such as increasing competition, price sensitivity in certain markets, and potential technological disruptions could influence the growth trajectory. However, the long-term outlook remains positive, driven by ongoing technological advancements, integration with health and wellness apps, and the expanding use of sport electronics in professional training and coaching. The market's segmentation by region will likely remain similar, with developed markets continuing to hold a larger share, but with emerging economies playing an increasingly vital role in market expansion. Further innovation in areas like biometrics, personalized fitness programs, and augmented reality applications will be critical for sustained market growth in the coming decade.
Sport Electronics Industry Market Report: 2019-2033
This comprehensive report provides an in-depth analysis of the global Sport Electronics Industry, offering valuable insights for businesses, investors, and stakeholders. The report covers the period from 2019 to 2033, with a focus on the 2025-2033 forecast period. The market size in 2025 is estimated at $XX Million, and the report projects significant growth driven by technological advancements and shifting consumer preferences. This detailed analysis includes market segmentation by product type (Wearable Devices and Other Wearable Devices: Standalone Devices), competitive landscape analysis, key market drivers and challenges, and strategic market outlook.
Sport Electronics Industry Market Structure & Competitive Dynamics
The global sport electronics market exhibits a moderately concentrated structure, with key players like Adidas AG, Polar Electro Oy, Garmin Ltd, Apple Inc, and Nike Inc holding significant market share. The industry is characterized by intense competition, fueled by rapid technological advancements and evolving consumer demands. Innovation ecosystems play a crucial role, with collaborations and partnerships driving product development. Regulatory frameworks related to data privacy and product safety are increasingly impacting market dynamics. The market sees a constant influx of substitutes, especially in the wearable device segment. End-user trends favor smart, integrated devices offering personalized data and training insights. The historical period (2019-2024) witnessed numerous M&A activities, with total deal values exceeding $XX Million, further consolidating the market landscape. Adidas AG’s share of the market is estimated at xx%, while Nike holds approximately xx%, showcasing a dynamic competitive landscape.
Sport Electronics Industry Industry Trends & Insights
The sport electronics industry is experiencing robust growth, driven by several key factors. The Compound Annual Growth Rate (CAGR) for the forecast period (2025-2033) is projected to be XX%. Increased health consciousness among consumers, coupled with the rising popularity of fitness activities, is a significant driver. Technological disruptions, such as advancements in sensor technology, miniaturization, and improved battery life, are enhancing the capabilities of wearable devices. Consumer preferences are shifting towards personalized fitness tracking and integrated data analytics. The market penetration of wearable devices continues to increase, particularly in developed regions. Competitive dynamics are marked by innovation, strategic partnerships, and aggressive marketing strategies, leading to product diversification and expansion into new market segments.
Dominant Markets & Segments in Sport Electronics Industry
The North American market currently dominates the global sport electronics industry, followed by Europe and Asia-Pacific. This dominance is attributed to several factors:
- High disposable income: A significant portion of the population possesses the financial capacity to purchase high-value sports electronics.
- Technological infrastructure: Advanced technological infrastructure supports the development and adoption of smart devices.
- Favorable regulatory environment: Supportive government policies promote innovation and market growth.
Within the product segments, wearable devices constitute the largest market share, primarily due to their convenience, versatility, and growing range of features. Standalone devices, while holding a smaller market share, cater to specialized needs in professional sports and high-performance training, thus maintaining a niche but significant market.
Sport Electronics Industry Product Innovations
Recent innovations in sport electronics include the integration of advanced sensors, improved data analytics capabilities, and more comfortable and durable designs. The focus is on creating seamless integration with smartphones and other smart devices, creating personalized fitness experiences. These developments cater to the growing demand for personalized fitness tracking, performance optimization, and enhanced user experience, creating a competitive advantage for manufacturers.
Report Segmentation & Scope
This report segments the sport electronics market by product type:
Wearable Devices: This segment encompasses smartwatches, fitness trackers, heart rate monitors, and other wearable devices designed for fitness tracking and performance monitoring. The market size for this segment in 2025 is estimated at $XX Million, with a projected CAGR of XX% during the forecast period. Competition is fierce, with established players and emerging startups vying for market share.
Other Wearable Devices: Standalone Devices: This segment includes standalone GPS devices, sports cameras, and other specialized equipment. The market size for this segment in 2025 is estimated at $XX Million, with a projected CAGR of XX%. This niche market witnesses specialized competition and innovation.
Key Drivers of Sport Electronics Industry Growth
Several key factors contribute to the growth of the sport electronics industry. Advancements in sensor technology, miniaturization, and improved battery life are critical. The increasing health consciousness among consumers and the rising popularity of fitness activities are also key drivers. Government initiatives promoting health and wellness, along with favorable regulatory environments in various regions, stimulate market growth.
Challenges in the Sport Electronics Industry Sector
The industry faces challenges such as intense competition, pricing pressures, and supply chain disruptions. Regulatory hurdles related to data privacy and product safety add complexities. The cost of developing advanced technologies and the need for continuous innovation pose significant challenges.
Leading Players in the Sport Electronics Industry Market
- Adidas AG
- Polar Electro Oy
- Giant Manufacturing Co Ltd
- Zepp US Inc
- Garmin Ltd
- StretchSense Ltd
- SZ DJI Technology Co Ltd
- Fitbit Inc
- Catapult Sports Pty Ltd
- Apple Inc
- Nike Inc
- Under Armour
Key Developments in Sport Electronics Industry Sector
- Jan 2023: Adidas AG launched a new line of smartwatches with advanced health tracking features.
- June 2022: Garmin Ltd announced a strategic partnership with a leading fitness app developer.
- Oct 2021: Apple Inc released a new version of its Apple Watch with enhanced fitness capabilities.
Strategic Sport Electronics Industry Market Outlook
The sport electronics industry holds immense future potential driven by continuous technological advancements, increasing health consciousness, and expanding consumer base. Strategic opportunities lie in developing innovative products with improved performance and personalized features. Further market growth is anticipated with enhanced partnerships and expansion into emerging markets.
Sport Electronics Industry Segmentation
-
1. Product Type
-
1.1. Wearable Devices
- 1.1.1. Pedometers
- 1.1.2. Activity Monitors
- 1.1.3. Smart Fabrics
- 1.1.4. Fitness and Heart Rate Monitors
- 1.1.5. Other Wearable Devices
-
1.2. Standalone Devices
- 1.2.1. Electronics Scales
- 1.2.2. Cameras
- 1.2.3. Cycling Computers
- 1.2.4. Other Standalone Devices
-
1.1. Wearable Devices
Sport Electronics Industry Segmentation By Geography
- 1. North America
- 2. Europe
- 3. Asia Pacific
- 4. Latin America
- 5. Middle East
Sport Electronics Industry REPORT HIGHLIGHTS
| Aspects | Details |
|---|---|
| Study Period | 2019-2033 |
| Base Year | 2024 |
| Estimated Year | 2025 |
| Forecast Period | 2025-2033 |
| Historical Period | 2019-2024 |
| Growth Rate | CAGR of 20.00% from 2019-2033 |
| Segmentation |
|
Table of Contents
- 1. Introduction
- 1.1. Research Scope
- 1.2. Market Segmentation
- 1.3. Research Methodology
- 1.4. Definitions and Assumptions
- 2. Executive Summary
- 2.1. Introduction
- 3. Market Dynamics
- 3.1. Introduction
- 3.2. Market Drivers
- 3.2.1. ; Technological Advancements in Wearable Sports Devices; Rising Demand for Round-The-Clock Monitoring
- 3.3. Market Restrains
- 3.3.1. ; High Cost of Wearable Devices
- 3.4. Market Trends
- 3.4.1. Smartwatch is Expected to Register a Significant Growth
- 4. Market Factor Analysis
- 4.1. Porters Five Forces
- 4.2. Supply/Value Chain
- 4.3. PESTEL analysis
- 4.4. Market Entropy
- 4.5. Patent/Trademark Analysis
- 5. Global Sport Electronics Industry Analysis, Insights and Forecast, 2019-2031
- 5.1. Market Analysis, Insights and Forecast - by Product Type
- 5.1.1. Wearable Devices
- 5.1.1.1. Pedometers
- 5.1.1.2. Activity Monitors
- 5.1.1.3. Smart Fabrics
- 5.1.1.4. Fitness and Heart Rate Monitors
- 5.1.1.5. Other Wearable Devices
- 5.1.2. Standalone Devices
- 5.1.2.1. Electronics Scales
- 5.1.2.2. Cameras
- 5.1.2.3. Cycling Computers
- 5.1.2.4. Other Standalone Devices
- 5.1.1. Wearable Devices
- 5.2. Market Analysis, Insights and Forecast - by Region
- 5.2.1. North America
- 5.2.2. Europe
- 5.2.3. Asia Pacific
- 5.2.4. Latin America
- 5.2.5. Middle East
- 5.1. Market Analysis, Insights and Forecast - by Product Type
- 6. North America Sport Electronics Industry Analysis, Insights and Forecast, 2019-2031
- 6.1. Market Analysis, Insights and Forecast - by Product Type
- 6.1.1. Wearable Devices
- 6.1.1.1. Pedometers
- 6.1.1.2. Activity Monitors
- 6.1.1.3. Smart Fabrics
- 6.1.1.4. Fitness and Heart Rate Monitors
- 6.1.1.5. Other Wearable Devices
- 6.1.2. Standalone Devices
- 6.1.2.1. Electronics Scales
- 6.1.2.2. Cameras
- 6.1.2.3. Cycling Computers
- 6.1.2.4. Other Standalone Devices
- 6.1.1. Wearable Devices
- 6.1. Market Analysis, Insights and Forecast - by Product Type
- 7. Europe Sport Electronics Industry Analysis, Insights and Forecast, 2019-2031
- 7.1. Market Analysis, Insights and Forecast - by Product Type
- 7.1.1. Wearable Devices
- 7.1.1.1. Pedometers
- 7.1.1.2. Activity Monitors
- 7.1.1.3. Smart Fabrics
- 7.1.1.4. Fitness and Heart Rate Monitors
- 7.1.1.5. Other Wearable Devices
- 7.1.2. Standalone Devices
- 7.1.2.1. Electronics Scales
- 7.1.2.2. Cameras
- 7.1.2.3. Cycling Computers
- 7.1.2.4. Other Standalone Devices
- 7.1.1. Wearable Devices
- 7.1. Market Analysis, Insights and Forecast - by Product Type
- 8. Asia Pacific Sport Electronics Industry Analysis, Insights and Forecast, 2019-2031
- 8.1. Market Analysis, Insights and Forecast - by Product Type
- 8.1.1. Wearable Devices
- 8.1.1.1. Pedometers
- 8.1.1.2. Activity Monitors
- 8.1.1.3. Smart Fabrics
- 8.1.1.4. Fitness and Heart Rate Monitors
- 8.1.1.5. Other Wearable Devices
- 8.1.2. Standalone Devices
- 8.1.2.1. Electronics Scales
- 8.1.2.2. Cameras
- 8.1.2.3. Cycling Computers
- 8.1.2.4. Other Standalone Devices
- 8.1.1. Wearable Devices
- 8.1. Market Analysis, Insights and Forecast - by Product Type
- 9. Latin America Sport Electronics Industry Analysis, Insights and Forecast, 2019-2031
- 9.1. Market Analysis, Insights and Forecast - by Product Type
- 9.1.1. Wearable Devices
- 9.1.1.1. Pedometers
- 9.1.1.2. Activity Monitors
- 9.1.1.3. Smart Fabrics
- 9.1.1.4. Fitness and Heart Rate Monitors
- 9.1.1.5. Other Wearable Devices
- 9.1.2. Standalone Devices
- 9.1.2.1. Electronics Scales
- 9.1.2.2. Cameras
- 9.1.2.3. Cycling Computers
- 9.1.2.4. Other Standalone Devices
- 9.1.1. Wearable Devices
- 9.1. Market Analysis, Insights and Forecast - by Product Type
- 10. Middle East Sport Electronics Industry Analysis, Insights and Forecast, 2019-2031
- 10.1. Market Analysis, Insights and Forecast - by Product Type
- 10.1.1. Wearable Devices
- 10.1.1.1. Pedometers
- 10.1.1.2. Activity Monitors
- 10.1.1.3. Smart Fabrics
- 10.1.1.4. Fitness and Heart Rate Monitors
- 10.1.1.5. Other Wearable Devices
- 10.1.2. Standalone Devices
- 10.1.2.1. Electronics Scales
- 10.1.2.2. Cameras
- 10.1.2.3. Cycling Computers
- 10.1.2.4. Other Standalone Devices
- 10.1.1. Wearable Devices
- 10.1. Market Analysis, Insights and Forecast - by Product Type
- 11. North America Sport Electronics Industry Analysis, Insights and Forecast, 2019-2031
- 11.1. Market Analysis, Insights and Forecast - By Country/Sub-region
- 11.1.1 United States
- 11.1.2 Canada
- 11.1.3 Mexico
- 12. Europe Sport Electronics Industry Analysis, Insights and Forecast, 2019-2031
- 12.1. Market Analysis, Insights and Forecast - By Country/Sub-region
- 12.1.1 Germany
- 12.1.2 United Kingdom
- 12.1.3 France
- 12.1.4 Spain
- 12.1.5 Italy
- 12.1.6 Spain
- 12.1.7 Belgium
- 12.1.8 Netherland
- 12.1.9 Nordics
- 12.1.10 Rest of Europe
- 13. Asia Pacific Sport Electronics Industry Analysis, Insights and Forecast, 2019-2031
- 13.1. Market Analysis, Insights and Forecast - By Country/Sub-region
- 13.1.1 China
- 13.1.2 Japan
- 13.1.3 India
- 13.1.4 South Korea
- 13.1.5 Southeast Asia
- 13.1.6 Australia
- 13.1.7 Indonesia
- 13.1.8 Phillipes
- 13.1.9 Singapore
- 13.1.10 Thailandc
- 13.1.11 Rest of Asia Pacific
- 14. South America Sport Electronics Industry Analysis, Insights and Forecast, 2019-2031
- 14.1. Market Analysis, Insights and Forecast - By Country/Sub-region
- 14.1.1 Brazil
- 14.1.2 Argentina
- 14.1.3 Peru
- 14.1.4 Chile
- 14.1.5 Colombia
- 14.1.6 Ecuador
- 14.1.7 Venezuela
- 14.1.8 Rest of South America
- 15. North America Sport Electronics Industry Analysis, Insights and Forecast, 2019-2031
- 15.1. Market Analysis, Insights and Forecast - By Country/Sub-region
- 15.1.1 United States
- 15.1.2 Canada
- 15.1.3 Mexico
- 16. MEA Sport Electronics Industry Analysis, Insights and Forecast, 2019-2031
- 16.1. Market Analysis, Insights and Forecast - By Country/Sub-region
- 16.1.1 United Arab Emirates
- 16.1.2 Saudi Arabia
- 16.1.3 South Africa
- 16.1.4 Rest of Middle East and Africa
- 17. Competitive Analysis
- 17.1. Global Market Share Analysis 2024
- 17.2. Company Profiles
- 17.2.1 Adidas AG
- 17.2.1.1. Overview
- 17.2.1.2. Products
- 17.2.1.3. SWOT Analysis
- 17.2.1.4. Recent Developments
- 17.2.1.5. Financials (Based on Availability)
- 17.2.2 Polar Electro Oy
- 17.2.2.1. Overview
- 17.2.2.2. Products
- 17.2.2.3. SWOT Analysis
- 17.2.2.4. Recent Developments
- 17.2.2.5. Financials (Based on Availability)
- 17.2.3 Giant Manufacturing Co Ltd
- 17.2.3.1. Overview
- 17.2.3.2. Products
- 17.2.3.3. SWOT Analysis
- 17.2.3.4. Recent Developments
- 17.2.3.5. Financials (Based on Availability)
- 17.2.4 Zepp US Inc
- 17.2.4.1. Overview
- 17.2.4.2. Products
- 17.2.4.3. SWOT Analysis
- 17.2.4.4. Recent Developments
- 17.2.4.5. Financials (Based on Availability)
- 17.2.5 Garmin Ltd
- 17.2.5.1. Overview
- 17.2.5.2. Products
- 17.2.5.3. SWOT Analysis
- 17.2.5.4. Recent Developments
- 17.2.5.5. Financials (Based on Availability)
- 17.2.6 StretchSense Ltd
- 17.2.6.1. Overview
- 17.2.6.2. Products
- 17.2.6.3. SWOT Analysis
- 17.2.6.4. Recent Developments
- 17.2.6.5. Financials (Based on Availability)
- 17.2.7 SZ DJI Technology Co Ltd
- 17.2.7.1. Overview
- 17.2.7.2. Products
- 17.2.7.3. SWOT Analysis
- 17.2.7.4. Recent Developments
- 17.2.7.5. Financials (Based on Availability)
- 17.2.8 Fitbit Inc
- 17.2.8.1. Overview
- 17.2.8.2. Products
- 17.2.8.3. SWOT Analysis
- 17.2.8.4. Recent Developments
- 17.2.8.5. Financials (Based on Availability)
- 17.2.9 Catapult Sports Pty Ltd
- 17.2.9.1. Overview
- 17.2.9.2. Products
- 17.2.9.3. SWOT Analysis
- 17.2.9.4. Recent Developments
- 17.2.9.5. Financials (Based on Availability)
- 17.2.10 Apple Inc
- 17.2.10.1. Overview
- 17.2.10.2. Products
- 17.2.10.3. SWOT Analysis
- 17.2.10.4. Recent Developments
- 17.2.10.5. Financials (Based on Availability)
- 17.2.11 Nike Inc
- 17.2.11.1. Overview
- 17.2.11.2. Products
- 17.2.11.3. SWOT Analysis
- 17.2.11.4. Recent Developments
- 17.2.11.5. Financials (Based on Availability)
- 17.2.12 Under Armour
- 17.2.12.1. Overview
- 17.2.12.2. Products
- 17.2.12.3. SWOT Analysis
- 17.2.12.4. Recent Developments
- 17.2.12.5. Financials (Based on Availability)
- 17.2.1 Adidas AG
List of Figures
- Figure 1: Global Sport Electronics Industry Revenue Breakdown (Million, %) by Region 2024 & 2032
- Figure 2: North America Sport Electronics Industry Revenue (Million), by Country 2024 & 2032
- Figure 3: North America Sport Electronics Industry Revenue Share (%), by Country 2024 & 2032
- Figure 4: Europe Sport Electronics Industry Revenue (Million), by Country 2024 & 2032
- Figure 5: Europe Sport Electronics Industry Revenue Share (%), by Country 2024 & 2032
- Figure 6: Asia Pacific Sport Electronics Industry Revenue (Million), by Country 2024 & 2032
- Figure 7: Asia Pacific Sport Electronics Industry Revenue Share (%), by Country 2024 & 2032
- Figure 8: South America Sport Electronics Industry Revenue (Million), by Country 2024 & 2032
- Figure 9: South America Sport Electronics Industry Revenue Share (%), by Country 2024 & 2032
- Figure 10: North America Sport Electronics Industry Revenue (Million), by Country 2024 & 2032
- Figure 11: North America Sport Electronics Industry Revenue Share (%), by Country 2024 & 2032
- Figure 12: MEA Sport Electronics Industry Revenue (Million), by Country 2024 & 2032
- Figure 13: MEA Sport Electronics Industry Revenue Share (%), by Country 2024 & 2032
- Figure 14: North America Sport Electronics Industry Revenue (Million), by Product Type 2024 & 2032
- Figure 15: North America Sport Electronics Industry Revenue Share (%), by Product Type 2024 & 2032
- Figure 16: North America Sport Electronics Industry Revenue (Million), by Country 2024 & 2032
- Figure 17: North America Sport Electronics Industry Revenue Share (%), by Country 2024 & 2032
- Figure 18: Europe Sport Electronics Industry Revenue (Million), by Product Type 2024 & 2032
- Figure 19: Europe Sport Electronics Industry Revenue Share (%), by Product Type 2024 & 2032
- Figure 20: Europe Sport Electronics Industry Revenue (Million), by Country 2024 & 2032
- Figure 21: Europe Sport Electronics Industry Revenue Share (%), by Country 2024 & 2032
- Figure 22: Asia Pacific Sport Electronics Industry Revenue (Million), by Product Type 2024 & 2032
- Figure 23: Asia Pacific Sport Electronics Industry Revenue Share (%), by Product Type 2024 & 2032
- Figure 24: Asia Pacific Sport Electronics Industry Revenue (Million), by Country 2024 & 2032
- Figure 25: Asia Pacific Sport Electronics Industry Revenue Share (%), by Country 2024 & 2032
- Figure 26: Latin America Sport Electronics Industry Revenue (Million), by Product Type 2024 & 2032
- Figure 27: Latin America Sport Electronics Industry Revenue Share (%), by Product Type 2024 & 2032
- Figure 28: Latin America Sport Electronics Industry Revenue (Million), by Country 2024 & 2032
- Figure 29: Latin America Sport Electronics Industry Revenue Share (%), by Country 2024 & 2032
- Figure 30: Middle East Sport Electronics Industry Revenue (Million), by Product Type 2024 & 2032
- Figure 31: Middle East Sport Electronics Industry Revenue Share (%), by Product Type 2024 & 2032
- Figure 32: Middle East Sport Electronics Industry Revenue (Million), by Country 2024 & 2032
- Figure 33: Middle East Sport Electronics Industry Revenue Share (%), by Country 2024 & 2032
List of Tables
- Table 1: Global Sport Electronics Industry Revenue Million Forecast, by Region 2019 & 2032
- Table 2: Global Sport Electronics Industry Revenue Million Forecast, by Product Type 2019 & 2032
- Table 3: Global Sport Electronics Industry Revenue Million Forecast, by Region 2019 & 2032
- Table 4: Global Sport Electronics Industry Revenue Million Forecast, by Country 2019 & 2032
- Table 5: United States Sport Electronics Industry Revenue (Million) Forecast, by Application 2019 & 2032
- Table 6: Canada Sport Electronics Industry Revenue (Million) Forecast, by Application 2019 & 2032
- Table 7: Mexico Sport Electronics Industry Revenue (Million) Forecast, by Application 2019 & 2032
- Table 8: Global Sport Electronics Industry Revenue Million Forecast, by Country 2019 & 2032
- Table 9: Germany Sport Electronics Industry Revenue (Million) Forecast, by Application 2019 & 2032
- Table 10: United Kingdom Sport Electronics Industry Revenue (Million) Forecast, by Application 2019 & 2032
- Table 11: France Sport Electronics Industry Revenue (Million) Forecast, by Application 2019 & 2032
- Table 12: Spain Sport Electronics Industry Revenue (Million) Forecast, by Application 2019 & 2032
- Table 13: Italy Sport Electronics Industry Revenue (Million) Forecast, by Application 2019 & 2032
- Table 14: Spain Sport Electronics Industry Revenue (Million) Forecast, by Application 2019 & 2032
- Table 15: Belgium Sport Electronics Industry Revenue (Million) Forecast, by Application 2019 & 2032
- Table 16: Netherland Sport Electronics Industry Revenue (Million) Forecast, by Application 2019 & 2032
- Table 17: Nordics Sport Electronics Industry Revenue (Million) Forecast, by Application 2019 & 2032
- Table 18: Rest of Europe Sport Electronics Industry Revenue (Million) Forecast, by Application 2019 & 2032
- Table 19: Global Sport Electronics Industry Revenue Million Forecast, by Country 2019 & 2032
- Table 20: China Sport Electronics Industry Revenue (Million) Forecast, by Application 2019 & 2032
- Table 21: Japan Sport Electronics Industry Revenue (Million) Forecast, by Application 2019 & 2032
- Table 22: India Sport Electronics Industry Revenue (Million) Forecast, by Application 2019 & 2032
- Table 23: South Korea Sport Electronics Industry Revenue (Million) Forecast, by Application 2019 & 2032
- Table 24: Southeast Asia Sport Electronics Industry Revenue (Million) Forecast, by Application 2019 & 2032
- Table 25: Australia Sport Electronics Industry Revenue (Million) Forecast, by Application 2019 & 2032
- Table 26: Indonesia Sport Electronics Industry Revenue (Million) Forecast, by Application 2019 & 2032
- Table 27: Phillipes Sport Electronics Industry Revenue (Million) Forecast, by Application 2019 & 2032
- Table 28: Singapore Sport Electronics Industry Revenue (Million) Forecast, by Application 2019 & 2032
- Table 29: Thailandc Sport Electronics Industry Revenue (Million) Forecast, by Application 2019 & 2032
- Table 30: Rest of Asia Pacific Sport Electronics Industry Revenue (Million) Forecast, by Application 2019 & 2032
- Table 31: Global Sport Electronics Industry Revenue Million Forecast, by Country 2019 & 2032
- Table 32: Brazil Sport Electronics Industry Revenue (Million) Forecast, by Application 2019 & 2032
- Table 33: Argentina Sport Electronics Industry Revenue (Million) Forecast, by Application 2019 & 2032
- Table 34: Peru Sport Electronics Industry Revenue (Million) Forecast, by Application 2019 & 2032
- Table 35: Chile Sport Electronics Industry Revenue (Million) Forecast, by Application 2019 & 2032
- Table 36: Colombia Sport Electronics Industry Revenue (Million) Forecast, by Application 2019 & 2032
- Table 37: Ecuador Sport Electronics Industry Revenue (Million) Forecast, by Application 2019 & 2032
- Table 38: Venezuela Sport Electronics Industry Revenue (Million) Forecast, by Application 2019 & 2032
- Table 39: Rest of South America Sport Electronics Industry Revenue (Million) Forecast, by Application 2019 & 2032
- Table 40: Global Sport Electronics Industry Revenue Million Forecast, by Country 2019 & 2032
- Table 41: United States Sport Electronics Industry Revenue (Million) Forecast, by Application 2019 & 2032
- Table 42: Canada Sport Electronics Industry Revenue (Million) Forecast, by Application 2019 & 2032
- Table 43: Mexico Sport Electronics Industry Revenue (Million) Forecast, by Application 2019 & 2032
- Table 44: Global Sport Electronics Industry Revenue Million Forecast, by Country 2019 & 2032
- Table 45: United Arab Emirates Sport Electronics Industry Revenue (Million) Forecast, by Application 2019 & 2032
- Table 46: Saudi Arabia Sport Electronics Industry Revenue (Million) Forecast, by Application 2019 & 2032
- Table 47: South Africa Sport Electronics Industry Revenue (Million) Forecast, by Application 2019 & 2032
- Table 48: Rest of Middle East and Africa Sport Electronics Industry Revenue (Million) Forecast, by Application 2019 & 2032
- Table 49: Global Sport Electronics Industry Revenue Million Forecast, by Product Type 2019 & 2032
- Table 50: Global Sport Electronics Industry Revenue Million Forecast, by Country 2019 & 2032
- Table 51: Global Sport Electronics Industry Revenue Million Forecast, by Product Type 2019 & 2032
- Table 52: Global Sport Electronics Industry Revenue Million Forecast, by Country 2019 & 2032
- Table 53: Global Sport Electronics Industry Revenue Million Forecast, by Product Type 2019 & 2032
- Table 54: Global Sport Electronics Industry Revenue Million Forecast, by Country 2019 & 2032
- Table 55: Global Sport Electronics Industry Revenue Million Forecast, by Product Type 2019 & 2032
- Table 56: Global Sport Electronics Industry Revenue Million Forecast, by Country 2019 & 2032
- Table 57: Global Sport Electronics Industry Revenue Million Forecast, by Product Type 2019 & 2032
- Table 58: Global Sport Electronics Industry Revenue Million Forecast, by Country 2019 & 2032
Frequently Asked Questions
1. What is the projected Compound Annual Growth Rate (CAGR) of the Sport Electronics Industry?
The projected CAGR is approximately 20.00%.
2. Which companies are prominent players in the Sport Electronics Industry?
Key companies in the market include Adidas AG, Polar Electro Oy, Giant Manufacturing Co Ltd , Zepp US Inc, Garmin Ltd, StretchSense Ltd, SZ DJI Technology Co Ltd, Fitbit Inc, Catapult Sports Pty Ltd, Apple Inc, Nike Inc, Under Armour.
3. What are the main segments of the Sport Electronics Industry?
The market segments include Product Type.
4. Can you provide details about the market size?
The market size is estimated to be USD XX Million as of 2022.
5. What are some drivers contributing to market growth?
; Technological Advancements in Wearable Sports Devices; Rising Demand for Round-The-Clock Monitoring.
6. What are the notable trends driving market growth?
Smartwatch is Expected to Register a Significant Growth.
7. Are there any restraints impacting market growth?
; High Cost of Wearable Devices.
8. Can you provide examples of recent developments in the market?
N/A
9. What pricing options are available for accessing the report?
Pricing options include single-user, multi-user, and enterprise licenses priced at USD 4750, USD 5250, and USD 8750 respectively.
10. Is the market size provided in terms of value or volume?
The market size is provided in terms of value, measured in Million.
11. Are there any specific market keywords associated with the report?
Yes, the market keyword associated with the report is "Sport Electronics Industry," which aids in identifying and referencing the specific market segment covered.
12. How do I determine which pricing option suits my needs best?
The pricing options vary based on user requirements and access needs. Individual users may opt for single-user licenses, while businesses requiring broader access may choose multi-user or enterprise licenses for cost-effective access to the report.
13. Are there any additional resources or data provided in the Sport Electronics Industry report?
While the report offers comprehensive insights, it's advisable to review the specific contents or supplementary materials provided to ascertain if additional resources or data are available.
14. How can I stay updated on further developments or reports in the Sport Electronics Industry?
To stay informed about further developments, trends, and reports in the Sport Electronics Industry, consider subscribing to industry newsletters, following relevant companies and organizations, or regularly checking reputable industry news sources and publications.
Methodology
Step 1 - Identification of Relevant Samples Size from Population Database


Step 2 - Approaches for Defining Global Market Size (Value, Volume* & Price*)

Note*: In applicable scenarios
Step 3 - Data Sources
Primary Research
- Web Analytics
- Survey Reports
- Research Institute
- Latest Research Reports
- Opinion Leaders
Secondary Research
- Annual Reports
- White Paper
- Latest Press Release
- Industry Association
- Paid Database
- Investor Presentations

Step 4 - Data Triangulation
Involves using different sources of information in order to increase the validity of a study
These sources are likely to be stakeholders in a program - participants, other researchers, program staff, other community members, and so on.
Then we put all data in single framework & apply various statistical tools to find out the dynamic on the market.
During the analysis stage, feedback from the stakeholder groups would be compared to determine areas of agreement as well as areas of divergence


