
Key Insights
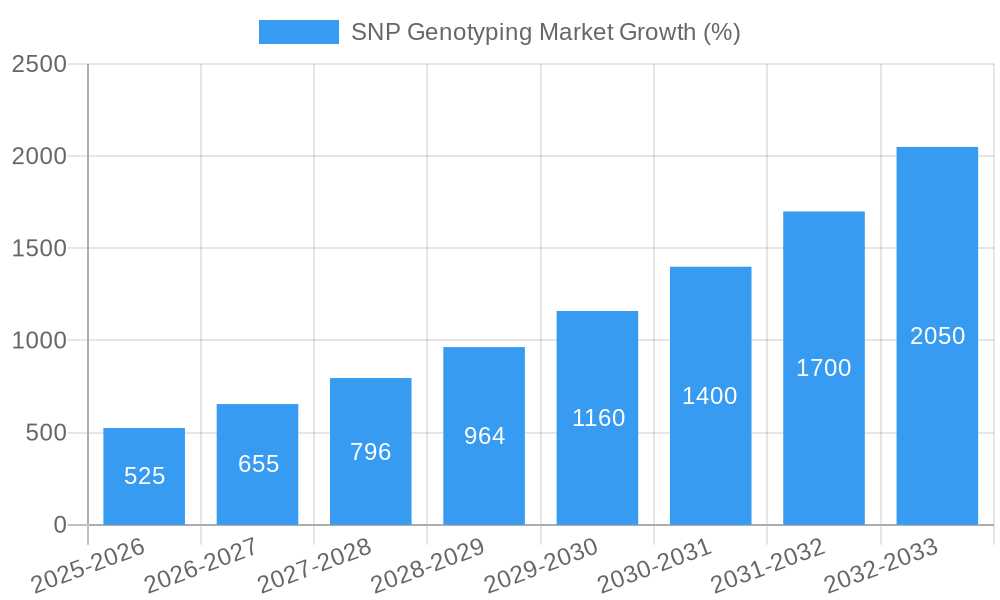
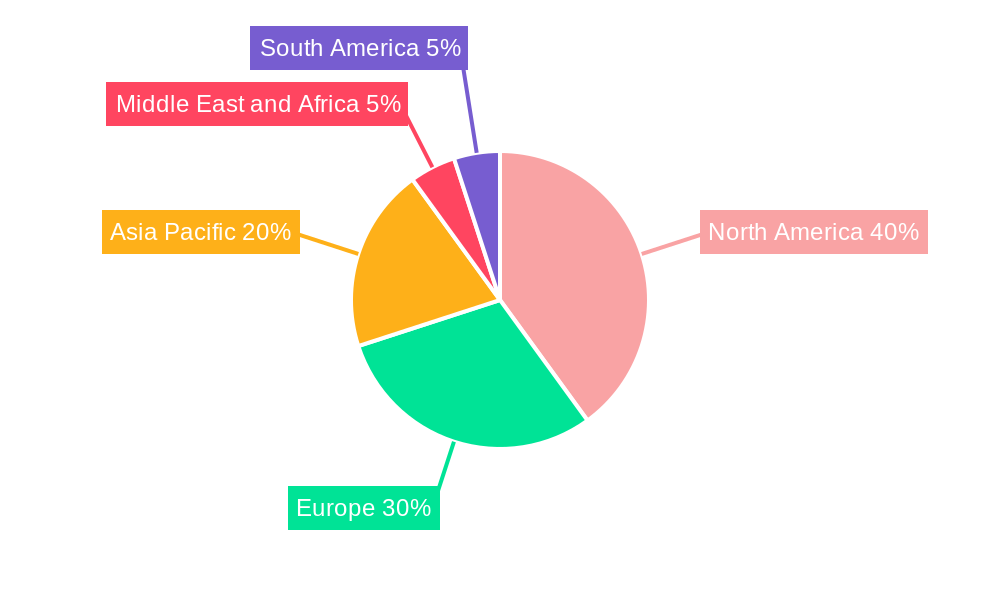
The SNP Genotyping market is experiencing robust growth, driven by the increasing adoption of personalized medicine, advancements in genomic technologies, and the rising prevalence of genetic disorders. The market's Compound Annual Growth Rate (CAGR) of 21% from 2019-2024 indicates significant expansion, projected to continue into the forecast period (2025-2033). Key technological segments include TaqMan SNP Genotyping, MassARRAY SNP Genotyping, and SNP GeneChip arrays, each contributing to the market's diversity and growth. Pharmacogenomics, a major end-user segment, fuels demand by leveraging SNP genotyping for drug development and personalized treatment strategies. The diagnostic field also contributes significantly, utilizing the technology for early disease detection and risk assessment. Geographic growth is expected across regions, with North America and Europe currently holding the largest market shares due to established healthcare infrastructure and research capabilities. However, the Asia-Pacific region is projected to witness substantial growth due to increasing healthcare spending and rising awareness of genetic testing. While the market faces restraints like high testing costs and ethical concerns surrounding genetic data privacy, the overall positive trajectory is anticipated to continue, driven by ongoing technological advancements and increasing governmental support for genomics research.
The competitive landscape is highly fragmented, with numerous established players like Thermo Fisher Scientific, Illumina, and Agilent Technologies alongside smaller specialized companies. Strategic collaborations, acquisitions, and technological innovations are shaping the competitive dynamics. Companies are focusing on developing more accurate, efficient, and cost-effective SNP genotyping platforms, which will further accelerate market growth. The future of the SNP genotyping market hinges on the continued integration of advanced technologies such as next-generation sequencing (NGS) and improved data analytics capabilities. These advancements will improve the accuracy and speed of SNP genotyping, making it a more accessible and valuable tool in healthcare and research. The increasing adoption of point-of-care diagnostics also presents a significant opportunity for market expansion.
Comprehensive SNP Genotyping Market Report: 2019-2033
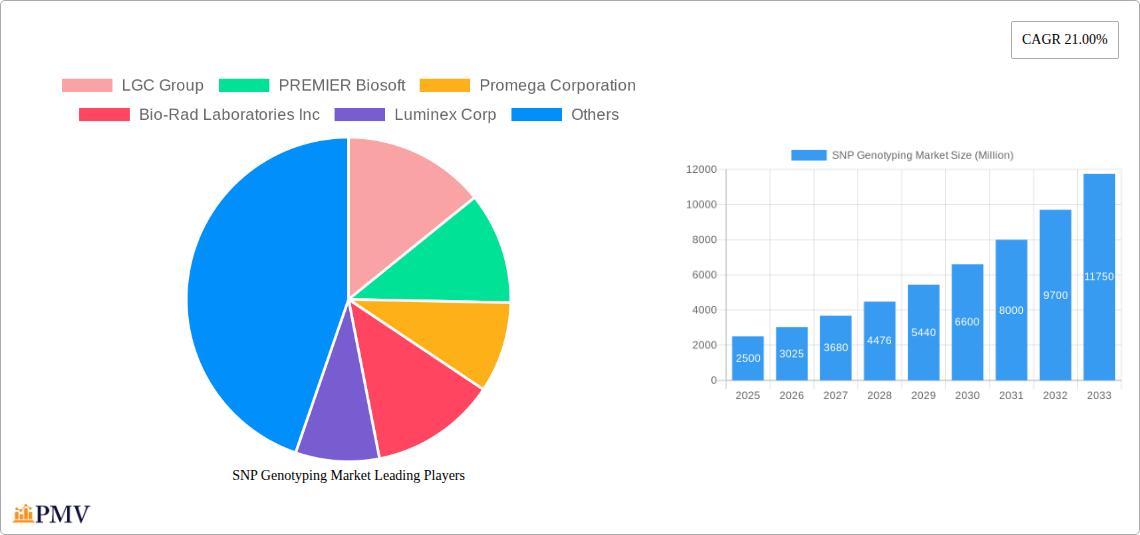
This in-depth report provides a comprehensive analysis of the SNP Genotyping market, offering valuable insights for stakeholders across the industry. Covering the period from 2019 to 2033, with a focus on 2025 as the base and estimated year, this report delivers a detailed forecast for 2025-2033, utilizing historical data from 2019-2024. The report segments the market by technology (TaqMan SNP Genotyping, Massarray SNP Genotyping, SNP GeneChip Arrays, Other Technologies) and end-user (Pharmacogenomics, Diagnostic Field), providing a granular understanding of market dynamics and future growth potential. Key players like LGC Group, PREMIER Biosoft, Promega Corporation, Bio-Rad Laboratories Inc, Luminex Corp, Douglas Scientific LLC, Danaher Corporation, Agilent Technologies Inc, Thermo Fischer Scientific Inc, Life Technologies Corp, Illumina Inc, Sequenom, and Fluidigm Corporation are profiled, providing a competitive landscape overview. The report's analysis incorporates recent key developments, enabling informed decision-making for businesses and investors in this rapidly evolving market. Expected Market Value in 2025 is XX Million.
SNP Genotyping Market Market Structure & Competitive Dynamics
The SNP genotyping market exhibits a moderately consolidated structure, with several large players holding significant market share. The competitive landscape is characterized by intense rivalry, driven by technological advancements, strategic partnerships, and mergers and acquisitions (M&A) activities. Market share data for 2024 suggests Illumina Inc. holds approximately xx% of the market, followed by Thermo Fisher Scientific Inc. with xx%, and others making up the remaining xx%. This competition is further fueled by ongoing innovation in SNP genotyping technologies, pushing companies to develop and commercialize new products. Regulatory frameworks vary across regions, influencing market access and product approvals. The market also experiences pressure from the emergence of next-generation sequencing (NGS) technologies, offering alternative approaches to SNP genotyping. However, SNP genotyping remains advantageous due to its cost-effectiveness and established infrastructure for some applications.
- Market Concentration: Moderately Consolidated
- Innovation Ecosystems: Highly Active, with continuous development of new assays and platforms.
- Regulatory Frameworks: Vary across geographies, impacting product approvals and market entry.
- Product Substitutes: Next-Generation Sequencing (NGS) technologies present a partial substitute.
- M&A Activity: Significant M&A activity was observed between 2019-2024, with deal values totaling approximately XX Million, driven by companies' desire to expand market share and product portfolios. Examples include [insert specific examples of M&A activity, if available, otherwise replace with "xx"].
SNP Genotyping Market Industry Trends & Insights
The SNP genotyping market is experiencing robust growth, driven by several key factors. The increasing adoption of personalized medicine and pharmacogenomics is a major impetus, as SNP genotyping plays a crucial role in identifying genetic variations influencing drug response. Furthermore, advancements in technology, such as the development of high-throughput and cost-effective platforms, have broadened the accessibility and affordability of SNP genotyping. The growing prevalence of genetic disorders and infectious diseases also fuels market expansion, with the need for accurate and rapid diagnostic tools becoming increasingly significant. The market is projected to experience a Compound Annual Growth Rate (CAGR) of xx% during the forecast period (2025-2033), with market penetration reaching xx% by 2033 in major regions. Competitive dynamics further shape the industry landscape, pushing continuous innovation and driving down costs.
Dominant Markets & Segments in SNP Genotyping Market
The North American region currently dominates the SNP genotyping market, driven by high healthcare expenditure, advanced research infrastructure, and a strong presence of major players. Europe follows closely, with substantial growth anticipated in the Asia-Pacific region due to increasing healthcare investments and rising prevalence of genetic diseases.
Leading Segments:
- Technology: TaqMan SNP Genotyping currently holds the largest market share owing to its established reliability, ease of use, and wide acceptance among researchers and clinicians.
- End User: The pharmacogenomics segment is leading due to its direct impact on personalized medicine and the growing demand for tailored treatment strategies.
Key Drivers of Regional Dominance:
- North America: Strong regulatory support, robust research and development activities, high healthcare expenditure, and early adoption of advanced technologies.
- Europe: High prevalence of genetic disorders, increasing awareness of personalized medicine, and strong government initiatives supporting genomic research.
- Asia-Pacific: Rapid economic growth, expanding healthcare infrastructure, rising prevalence of genetic diseases, and increasing government investments in healthcare.
SNP Genotyping Market Product Innovations
Recent innovations in SNP genotyping focus on improving throughput, accuracy, and cost-effectiveness. This includes advancements in microarray technology, real-time PCR-based methods, and next-generation sequencing approaches. New products emphasize miniaturization, automation, and integration with advanced analytical software, streamlining workflows and reducing turnaround times. These innovations cater to the growing demand for high-throughput screening and point-of-care diagnostics, enhancing market appeal and expanding application areas.
Report Segmentation & Scope
This report comprehensively segments the SNP Genotyping market based on technology and end-user.
By Technology:
TaqMan SNP Genotyping: This segment accounts for a significant market share, driven by its reliability and established protocols. Market growth is projected at a CAGR of xx% during the forecast period. Competitive dynamics are intense, with major players constantly striving for innovation and cost optimization.
Massarray SNP Genotyping: This segment offers high throughput and accuracy, driving its steady growth. The CAGR is expected to be xx% over the forecast period. The market is witnessing the entry of new players focusing on cost-effectiveness and improved ease-of-use.
SNP GeneChip Arrays: This segment benefits from its established track record and extensive application base. It is projected to grow at a CAGR of xx%. The competitive landscape includes both established players and innovative startups.
Other Technologies: This segment encompasses emerging technologies, such as next-generation sequencing (NGS)-based methods, presenting high growth potential. The CAGR is projected at xx%. Competition is driven by technological advancements and the push for higher throughput and sensitivity.
By End-User:
Pharmacogenomics: This segment is a major driver of market growth, as it is directly linked to personalized medicine and tailored treatment approaches. The CAGR is expected to be xx%. Market dynamics are fueled by increasing research funding and the growing realization of pharmacogenomics’ role in improving treatment outcomes.
Diagnostic Field: This segment benefits from the increasing demand for rapid and accurate diagnostics. The projected CAGR is xx%. The market is influenced by advancements in diagnostic technology and increasing disease prevalence.
Key Drivers of SNP Genotyping Market Growth
The SNP genotyping market is propelled by the growing demand for personalized medicine, increased adoption of pharmacogenomics, technological advancements leading to higher throughput and reduced costs, rising prevalence of genetic disorders, and supportive government initiatives promoting genomic research. The increasing focus on infectious disease diagnostics, particularly in the wake of recent pandemics, has also significantly boosted demand.
Challenges in the SNP Genotyping Market Sector
Challenges include the high cost of advanced SNP genotyping technologies, the complexity of data analysis, and the need for skilled professionals to interpret results. Regulatory hurdles and stringent quality control requirements also pose challenges. Furthermore, the emergence of alternative technologies such as NGS presents competitive pressure. The impact of these challenges can vary across segments, with emerging technologies facing higher barriers to entry while established methods grapple with maintaining competitiveness. The total estimated impact of these challenges on market growth is approximately xx%.
Leading Players in the SNP Genotyping Market Market
- LGC Group
- PREMIER Biosoft
- Promega Corporation
- Bio-Rad Laboratories Inc
- Luminex Corp
- Douglas Scientific LLC
- Danaher Corporation
- Agilent Technologies Inc
- Thermo Fischer Scientific Inc
- Life Technologies Corp
- Illumina Inc
- Sequenom
- Fluidigm Corporation
Key Developments in SNP Genotyping Market Sector
Feb 2021: Novacyt launched its SNPsig portfolio of PCR genotyping assays, aiding the diagnosis of new SARS-CoV-2 variants. This development significantly contributed to the increased demand for rapid diagnostic tools during the pandemic.
Aug 2021: Thermo Fisher Scientific expanded its production capacity and updated its Applied Biosystems TaqMan SARS-CoV-2 mutation panel for diagnosing Delta and Lambda strains. This highlights the market's responsiveness to evolving infectious disease challenges and the role of established players in addressing these needs.
Strategic SNP Genotyping Market Market Outlook
The SNP genotyping market presents significant future potential, driven by ongoing advancements in personalized medicine, the growing need for rapid and accurate diagnostics, and the increasing adoption of high-throughput technologies. Strategic opportunities lie in developing cost-effective and user-friendly platforms, expanding into emerging markets, and forging strategic collaborations to enhance market reach and technological capabilities. Focus on innovative applications in areas like oncology and infectious disease diagnostics will further drive market growth and create lucrative investment opportunities.
SNP Genotyping Market Segmentation
-
1. Technology
- 1.1. TaqMan SNP Genotyping
- 1.2. Massarray SNP Genotyping
- 1.3. SNP GeneChip Arrays
- 1.4. Other Technologies
-
2. End User
- 2.1. Pharmacogenomics
- 2.2. Diagnostic Field
SNP Genotyping Market Segmentation By Geography
-
1. North America
- 1.1. United States
- 1.2. Canada
- 1.3. Mexico
-
2. Europe
- 2.1. Germany
- 2.2. United Kingdom
- 2.3. France
- 2.4. Italy
- 2.5. Spain
- 2.6. Rest of Europe
-
3. Asia Pacific
- 3.1. China
- 3.2. Japan
- 3.3. India
- 3.4. Australia
- 3.5. South Korea
- 3.6. Rest of Asia Pacific
-
4. Middle East and Africa
- 4.1. GCC
- 4.2. South Africa
- 4.3. Rest of Middle East and Africa
-
5. South America
- 5.1. Brazil
- 5.2. Argentina
- 5.3. Rest of South America
SNP Genotyping Market REPORT HIGHLIGHTS
| Aspects | Details |
|---|---|
| Study Period | 2019-2033 |
| Base Year | 2024 |
| Estimated Year | 2025 |
| Forecast Period | 2025-2033 |
| Historical Period | 2019-2024 |
| Growth Rate | CAGR of 21.00% from 2019-2033 |
| Segmentation |
|
Table of Contents
- 1. Introduction
- 1.1. Research Scope
- 1.2. Market Segmentation
- 1.3. Research Methodology
- 1.4. Definitions and Assumptions
- 2. Executive Summary
- 2.1. Introduction
- 3. Market Dynamics
- 3.1. Introduction
- 3.2. Market Drivers
- 3.2.1. Miniaturisation of Equipment and Instruments; Increased Multiplexing Capacity Leading to Increased Application
- 3.3. Market Restrains
- 3.3.1. Lack of Standardisation in SNP Processes; Privacy Concerns Pose a Threat to Broad Technology Adoption
- 3.4. Market Trends
- 3.4.1. Pharmacogenomics Segment Expected to Witness High Growth Over the Forecast Period
- 4. Market Factor Analysis
- 4.1. Porters Five Forces
- 4.2. Supply/Value Chain
- 4.3. PESTEL analysis
- 4.4. Market Entropy
- 4.5. Patent/Trademark Analysis
- 5. Global SNP Genotyping Market Analysis, Insights and Forecast, 2019-2031
- 5.1. Market Analysis, Insights and Forecast - by Technology
- 5.1.1. TaqMan SNP Genotyping
- 5.1.2. Massarray SNP Genotyping
- 5.1.3. SNP GeneChip Arrays
- 5.1.4. Other Technologies
- 5.2. Market Analysis, Insights and Forecast - by End User
- 5.2.1. Pharmacogenomics
- 5.2.2. Diagnostic Field
- 5.3. Market Analysis, Insights and Forecast - by Region
- 5.3.1. North America
- 5.3.2. Europe
- 5.3.3. Asia Pacific
- 5.3.4. Middle East and Africa
- 5.3.5. South America
- 5.1. Market Analysis, Insights and Forecast - by Technology
- 6. North America SNP Genotyping Market Analysis, Insights and Forecast, 2019-2031
- 6.1. Market Analysis, Insights and Forecast - by Technology
- 6.1.1. TaqMan SNP Genotyping
- 6.1.2. Massarray SNP Genotyping
- 6.1.3. SNP GeneChip Arrays
- 6.1.4. Other Technologies
- 6.2. Market Analysis, Insights and Forecast - by End User
- 6.2.1. Pharmacogenomics
- 6.2.2. Diagnostic Field
- 6.1. Market Analysis, Insights and Forecast - by Technology
- 7. Europe SNP Genotyping Market Analysis, Insights and Forecast, 2019-2031
- 7.1. Market Analysis, Insights and Forecast - by Technology
- 7.1.1. TaqMan SNP Genotyping
- 7.1.2. Massarray SNP Genotyping
- 7.1.3. SNP GeneChip Arrays
- 7.1.4. Other Technologies
- 7.2. Market Analysis, Insights and Forecast - by End User
- 7.2.1. Pharmacogenomics
- 7.2.2. Diagnostic Field
- 7.1. Market Analysis, Insights and Forecast - by Technology
- 8. Asia Pacific SNP Genotyping Market Analysis, Insights and Forecast, 2019-2031
- 8.1. Market Analysis, Insights and Forecast - by Technology
- 8.1.1. TaqMan SNP Genotyping
- 8.1.2. Massarray SNP Genotyping
- 8.1.3. SNP GeneChip Arrays
- 8.1.4. Other Technologies
- 8.2. Market Analysis, Insights and Forecast - by End User
- 8.2.1. Pharmacogenomics
- 8.2.2. Diagnostic Field
- 8.1. Market Analysis, Insights and Forecast - by Technology
- 9. Middle East and Africa SNP Genotyping Market Analysis, Insights and Forecast, 2019-2031
- 9.1. Market Analysis, Insights and Forecast - by Technology
- 9.1.1. TaqMan SNP Genotyping
- 9.1.2. Massarray SNP Genotyping
- 9.1.3. SNP GeneChip Arrays
- 9.1.4. Other Technologies
- 9.2. Market Analysis, Insights and Forecast - by End User
- 9.2.1. Pharmacogenomics
- 9.2.2. Diagnostic Field
- 9.1. Market Analysis, Insights and Forecast - by Technology
- 10. South America SNP Genotyping Market Analysis, Insights and Forecast, 2019-2031
- 10.1. Market Analysis, Insights and Forecast - by Technology
- 10.1.1. TaqMan SNP Genotyping
- 10.1.2. Massarray SNP Genotyping
- 10.1.3. SNP GeneChip Arrays
- 10.1.4. Other Technologies
- 10.2. Market Analysis, Insights and Forecast - by End User
- 10.2.1. Pharmacogenomics
- 10.2.2. Diagnostic Field
- 10.1. Market Analysis, Insights and Forecast - by Technology
- 11. North America SNP Genotyping Market Analysis, Insights and Forecast, 2019-2031
- 11.1. Market Analysis, Insights and Forecast - By Country/Sub-region
- 11.1.1 United States
- 11.1.2 Canada
- 11.1.3 Mexico
- 12. Europe SNP Genotyping Market Analysis, Insights and Forecast, 2019-2031
- 12.1. Market Analysis, Insights and Forecast - By Country/Sub-region
- 12.1.1 Germany
- 12.1.2 United Kingdom
- 12.1.3 France
- 12.1.4 Italy
- 12.1.5 Spain
- 12.1.6 Rest of Europe
- 13. Asia Pacific SNP Genotyping Market Analysis, Insights and Forecast, 2019-2031
- 13.1. Market Analysis, Insights and Forecast - By Country/Sub-region
- 13.1.1 China
- 13.1.2 Japan
- 13.1.3 India
- 13.1.4 Australia
- 13.1.5 South Korea
- 13.1.6 Rest of Asia Pacific
- 14. Middle East and Africa SNP Genotyping Market Analysis, Insights and Forecast, 2019-2031
- 14.1. Market Analysis, Insights and Forecast - By Country/Sub-region
- 14.1.1 GCC
- 14.1.2 South Africa
- 14.1.3 Rest of Middle East and Africa
- 15. South America SNP Genotyping Market Analysis, Insights and Forecast, 2019-2031
- 15.1. Market Analysis, Insights and Forecast - By Country/Sub-region
- 15.1.1 Brazil
- 15.1.2 Argentina
- 15.1.3 Rest of South America
- 16. Competitive Analysis
- 16.1. Global Market Share Analysis 2024
- 16.2. Company Profiles
- 16.2.1 LGC Group
- 16.2.1.1. Overview
- 16.2.1.2. Products
- 16.2.1.3. SWOT Analysis
- 16.2.1.4. Recent Developments
- 16.2.1.5. Financials (Based on Availability)
- 16.2.2 PREMIER Biosoft
- 16.2.2.1. Overview
- 16.2.2.2. Products
- 16.2.2.3. SWOT Analysis
- 16.2.2.4. Recent Developments
- 16.2.2.5. Financials (Based on Availability)
- 16.2.3 Promega Corporation
- 16.2.3.1. Overview
- 16.2.3.2. Products
- 16.2.3.3. SWOT Analysis
- 16.2.3.4. Recent Developments
- 16.2.3.5. Financials (Based on Availability)
- 16.2.4 Bio-Rad Laboratories Inc
- 16.2.4.1. Overview
- 16.2.4.2. Products
- 16.2.4.3. SWOT Analysis
- 16.2.4.4. Recent Developments
- 16.2.4.5. Financials (Based on Availability)
- 16.2.5 Luminex Corp
- 16.2.5.1. Overview
- 16.2.5.2. Products
- 16.2.5.3. SWOT Analysis
- 16.2.5.4. Recent Developments
- 16.2.5.5. Financials (Based on Availability)
- 16.2.6 Douglas Scientific LLC
- 16.2.6.1. Overview
- 16.2.6.2. Products
- 16.2.6.3. SWOT Analysis
- 16.2.6.4. Recent Developments
- 16.2.6.5. Financials (Based on Availability)
- 16.2.7 Danaher Corporation
- 16.2.7.1. Overview
- 16.2.7.2. Products
- 16.2.7.3. SWOT Analysis
- 16.2.7.4. Recent Developments
- 16.2.7.5. Financials (Based on Availability)
- 16.2.8 Agilent Technologies Inc
- 16.2.8.1. Overview
- 16.2.8.2. Products
- 16.2.8.3. SWOT Analysis
- 16.2.8.4. Recent Developments
- 16.2.8.5. Financials (Based on Availability)
- 16.2.9 Thermo Fischer Scientific Inc
- 16.2.9.1. Overview
- 16.2.9.2. Products
- 16.2.9.3. SWOT Analysis
- 16.2.9.4. Recent Developments
- 16.2.9.5. Financials (Based on Availability)
- 16.2.10 Life Technologies Corp
- 16.2.10.1. Overview
- 16.2.10.2. Products
- 16.2.10.3. SWOT Analysis
- 16.2.10.4. Recent Developments
- 16.2.10.5. Financials (Based on Availability)
- 16.2.11 Illumina Inc
- 16.2.11.1. Overview
- 16.2.11.2. Products
- 16.2.11.3. SWOT Analysis
- 16.2.11.4. Recent Developments
- 16.2.11.5. Financials (Based on Availability)
- 16.2.12 Sequenom
- 16.2.12.1. Overview
- 16.2.12.2. Products
- 16.2.12.3. SWOT Analysis
- 16.2.12.4. Recent Developments
- 16.2.12.5. Financials (Based on Availability)
- 16.2.13 Fluidigm Corporation
- 16.2.13.1. Overview
- 16.2.13.2. Products
- 16.2.13.3. SWOT Analysis
- 16.2.13.4. Recent Developments
- 16.2.13.5. Financials (Based on Availability)
- 16.2.1 LGC Group
List of Figures
- Figure 1: Global SNP Genotyping Market Revenue Breakdown (Million, %) by Region 2024 & 2032
- Figure 2: Global SNP Genotyping Market Volume Breakdown (K Unit, %) by Region 2024 & 2032
- Figure 3: North America SNP Genotyping Market Revenue (Million), by Country 2024 & 2032
- Figure 4: North America SNP Genotyping Market Volume (K Unit), by Country 2024 & 2032
- Figure 5: North America SNP Genotyping Market Revenue Share (%), by Country 2024 & 2032
- Figure 6: North America SNP Genotyping Market Volume Share (%), by Country 2024 & 2032
- Figure 7: Europe SNP Genotyping Market Revenue (Million), by Country 2024 & 2032
- Figure 8: Europe SNP Genotyping Market Volume (K Unit), by Country 2024 & 2032
- Figure 9: Europe SNP Genotyping Market Revenue Share (%), by Country 2024 & 2032
- Figure 10: Europe SNP Genotyping Market Volume Share (%), by Country 2024 & 2032
- Figure 11: Asia Pacific SNP Genotyping Market Revenue (Million), by Country 2024 & 2032
- Figure 12: Asia Pacific SNP Genotyping Market Volume (K Unit), by Country 2024 & 2032
- Figure 13: Asia Pacific SNP Genotyping Market Revenue Share (%), by Country 2024 & 2032
- Figure 14: Asia Pacific SNP Genotyping Market Volume Share (%), by Country 2024 & 2032
- Figure 15: Middle East and Africa SNP Genotyping Market Revenue (Million), by Country 2024 & 2032
- Figure 16: Middle East and Africa SNP Genotyping Market Volume (K Unit), by Country 2024 & 2032
- Figure 17: Middle East and Africa SNP Genotyping Market Revenue Share (%), by Country 2024 & 2032
- Figure 18: Middle East and Africa SNP Genotyping Market Volume Share (%), by Country 2024 & 2032
- Figure 19: South America SNP Genotyping Market Revenue (Million), by Country 2024 & 2032
- Figure 20: South America SNP Genotyping Market Volume (K Unit), by Country 2024 & 2032
- Figure 21: South America SNP Genotyping Market Revenue Share (%), by Country 2024 & 2032
- Figure 22: South America SNP Genotyping Market Volume Share (%), by Country 2024 & 2032
- Figure 23: North America SNP Genotyping Market Revenue (Million), by Technology 2024 & 2032
- Figure 24: North America SNP Genotyping Market Volume (K Unit), by Technology 2024 & 2032
- Figure 25: North America SNP Genotyping Market Revenue Share (%), by Technology 2024 & 2032
- Figure 26: North America SNP Genotyping Market Volume Share (%), by Technology 2024 & 2032
- Figure 27: North America SNP Genotyping Market Revenue (Million), by End User 2024 & 2032
- Figure 28: North America SNP Genotyping Market Volume (K Unit), by End User 2024 & 2032
- Figure 29: North America SNP Genotyping Market Revenue Share (%), by End User 2024 & 2032
- Figure 30: North America SNP Genotyping Market Volume Share (%), by End User 2024 & 2032
- Figure 31: North America SNP Genotyping Market Revenue (Million), by Country 2024 & 2032
- Figure 32: North America SNP Genotyping Market Volume (K Unit), by Country 2024 & 2032
- Figure 33: North America SNP Genotyping Market Revenue Share (%), by Country 2024 & 2032
- Figure 34: North America SNP Genotyping Market Volume Share (%), by Country 2024 & 2032
- Figure 35: Europe SNP Genotyping Market Revenue (Million), by Technology 2024 & 2032
- Figure 36: Europe SNP Genotyping Market Volume (K Unit), by Technology 2024 & 2032
- Figure 37: Europe SNP Genotyping Market Revenue Share (%), by Technology 2024 & 2032
- Figure 38: Europe SNP Genotyping Market Volume Share (%), by Technology 2024 & 2032
- Figure 39: Europe SNP Genotyping Market Revenue (Million), by End User 2024 & 2032
- Figure 40: Europe SNP Genotyping Market Volume (K Unit), by End User 2024 & 2032
- Figure 41: Europe SNP Genotyping Market Revenue Share (%), by End User 2024 & 2032
- Figure 42: Europe SNP Genotyping Market Volume Share (%), by End User 2024 & 2032
- Figure 43: Europe SNP Genotyping Market Revenue (Million), by Country 2024 & 2032
- Figure 44: Europe SNP Genotyping Market Volume (K Unit), by Country 2024 & 2032
- Figure 45: Europe SNP Genotyping Market Revenue Share (%), by Country 2024 & 2032
- Figure 46: Europe SNP Genotyping Market Volume Share (%), by Country 2024 & 2032
- Figure 47: Asia Pacific SNP Genotyping Market Revenue (Million), by Technology 2024 & 2032
- Figure 48: Asia Pacific SNP Genotyping Market Volume (K Unit), by Technology 2024 & 2032
- Figure 49: Asia Pacific SNP Genotyping Market Revenue Share (%), by Technology 2024 & 2032
- Figure 50: Asia Pacific SNP Genotyping Market Volume Share (%), by Technology 2024 & 2032
- Figure 51: Asia Pacific SNP Genotyping Market Revenue (Million), by End User 2024 & 2032
- Figure 52: Asia Pacific SNP Genotyping Market Volume (K Unit), by End User 2024 & 2032
- Figure 53: Asia Pacific SNP Genotyping Market Revenue Share (%), by End User 2024 & 2032
- Figure 54: Asia Pacific SNP Genotyping Market Volume Share (%), by End User 2024 & 2032
- Figure 55: Asia Pacific SNP Genotyping Market Revenue (Million), by Country 2024 & 2032
- Figure 56: Asia Pacific SNP Genotyping Market Volume (K Unit), by Country 2024 & 2032
- Figure 57: Asia Pacific SNP Genotyping Market Revenue Share (%), by Country 2024 & 2032
- Figure 58: Asia Pacific SNP Genotyping Market Volume Share (%), by Country 2024 & 2032
- Figure 59: Middle East and Africa SNP Genotyping Market Revenue (Million), by Technology 2024 & 2032
- Figure 60: Middle East and Africa SNP Genotyping Market Volume (K Unit), by Technology 2024 & 2032
- Figure 61: Middle East and Africa SNP Genotyping Market Revenue Share (%), by Technology 2024 & 2032
- Figure 62: Middle East and Africa SNP Genotyping Market Volume Share (%), by Technology 2024 & 2032
- Figure 63: Middle East and Africa SNP Genotyping Market Revenue (Million), by End User 2024 & 2032
- Figure 64: Middle East and Africa SNP Genotyping Market Volume (K Unit), by End User 2024 & 2032
- Figure 65: Middle East and Africa SNP Genotyping Market Revenue Share (%), by End User 2024 & 2032
- Figure 66: Middle East and Africa SNP Genotyping Market Volume Share (%), by End User 2024 & 2032
- Figure 67: Middle East and Africa SNP Genotyping Market Revenue (Million), by Country 2024 & 2032
- Figure 68: Middle East and Africa SNP Genotyping Market Volume (K Unit), by Country 2024 & 2032
- Figure 69: Middle East and Africa SNP Genotyping Market Revenue Share (%), by Country 2024 & 2032
- Figure 70: Middle East and Africa SNP Genotyping Market Volume Share (%), by Country 2024 & 2032
- Figure 71: South America SNP Genotyping Market Revenue (Million), by Technology 2024 & 2032
- Figure 72: South America SNP Genotyping Market Volume (K Unit), by Technology 2024 & 2032
- Figure 73: South America SNP Genotyping Market Revenue Share (%), by Technology 2024 & 2032
- Figure 74: South America SNP Genotyping Market Volume Share (%), by Technology 2024 & 2032
- Figure 75: South America SNP Genotyping Market Revenue (Million), by End User 2024 & 2032
- Figure 76: South America SNP Genotyping Market Volume (K Unit), by End User 2024 & 2032
- Figure 77: South America SNP Genotyping Market Revenue Share (%), by End User 2024 & 2032
- Figure 78: South America SNP Genotyping Market Volume Share (%), by End User 2024 & 2032
- Figure 79: South America SNP Genotyping Market Revenue (Million), by Country 2024 & 2032
- Figure 80: South America SNP Genotyping Market Volume (K Unit), by Country 2024 & 2032
- Figure 81: South America SNP Genotyping Market Revenue Share (%), by Country 2024 & 2032
- Figure 82: South America SNP Genotyping Market Volume Share (%), by Country 2024 & 2032
List of Tables
- Table 1: Global SNP Genotyping Market Revenue Million Forecast, by Region 2019 & 2032
- Table 2: Global SNP Genotyping Market Volume K Unit Forecast, by Region 2019 & 2032
- Table 3: Global SNP Genotyping Market Revenue Million Forecast, by Technology 2019 & 2032
- Table 4: Global SNP Genotyping Market Volume K Unit Forecast, by Technology 2019 & 2032
- Table 5: Global SNP Genotyping Market Revenue Million Forecast, by End User 2019 & 2032
- Table 6: Global SNP Genotyping Market Volume K Unit Forecast, by End User 2019 & 2032
- Table 7: Global SNP Genotyping Market Revenue Million Forecast, by Region 2019 & 2032
- Table 8: Global SNP Genotyping Market Volume K Unit Forecast, by Region 2019 & 2032
- Table 9: Global SNP Genotyping Market Revenue Million Forecast, by Country 2019 & 2032
- Table 10: Global SNP Genotyping Market Volume K Unit Forecast, by Country 2019 & 2032
- Table 11: United States SNP Genotyping Market Revenue (Million) Forecast, by Application 2019 & 2032
- Table 12: United States SNP Genotyping Market Volume (K Unit) Forecast, by Application 2019 & 2032
- Table 13: Canada SNP Genotyping Market Revenue (Million) Forecast, by Application 2019 & 2032
- Table 14: Canada SNP Genotyping Market Volume (K Unit) Forecast, by Application 2019 & 2032
- Table 15: Mexico SNP Genotyping Market Revenue (Million) Forecast, by Application 2019 & 2032
- Table 16: Mexico SNP Genotyping Market Volume (K Unit) Forecast, by Application 2019 & 2032
- Table 17: Global SNP Genotyping Market Revenue Million Forecast, by Country 2019 & 2032
- Table 18: Global SNP Genotyping Market Volume K Unit Forecast, by Country 2019 & 2032
- Table 19: Germany SNP Genotyping Market Revenue (Million) Forecast, by Application 2019 & 2032
- Table 20: Germany SNP Genotyping Market Volume (K Unit) Forecast, by Application 2019 & 2032
- Table 21: United Kingdom SNP Genotyping Market Revenue (Million) Forecast, by Application 2019 & 2032
- Table 22: United Kingdom SNP Genotyping Market Volume (K Unit) Forecast, by Application 2019 & 2032
- Table 23: France SNP Genotyping Market Revenue (Million) Forecast, by Application 2019 & 2032
- Table 24: France SNP Genotyping Market Volume (K Unit) Forecast, by Application 2019 & 2032
- Table 25: Italy SNP Genotyping Market Revenue (Million) Forecast, by Application 2019 & 2032
- Table 26: Italy SNP Genotyping Market Volume (K Unit) Forecast, by Application 2019 & 2032
- Table 27: Spain SNP Genotyping Market Revenue (Million) Forecast, by Application 2019 & 2032
- Table 28: Spain SNP Genotyping Market Volume (K Unit) Forecast, by Application 2019 & 2032
- Table 29: Rest of Europe SNP Genotyping Market Revenue (Million) Forecast, by Application 2019 & 2032
- Table 30: Rest of Europe SNP Genotyping Market Volume (K Unit) Forecast, by Application 2019 & 2032
- Table 31: Global SNP Genotyping Market Revenue Million Forecast, by Country 2019 & 2032
- Table 32: Global SNP Genotyping Market Volume K Unit Forecast, by Country 2019 & 2032
- Table 33: China SNP Genotyping Market Revenue (Million) Forecast, by Application 2019 & 2032
- Table 34: China SNP Genotyping Market Volume (K Unit) Forecast, by Application 2019 & 2032
- Table 35: Japan SNP Genotyping Market Revenue (Million) Forecast, by Application 2019 & 2032
- Table 36: Japan SNP Genotyping Market Volume (K Unit) Forecast, by Application 2019 & 2032
- Table 37: India SNP Genotyping Market Revenue (Million) Forecast, by Application 2019 & 2032
- Table 38: India SNP Genotyping Market Volume (K Unit) Forecast, by Application 2019 & 2032
- Table 39: Australia SNP Genotyping Market Revenue (Million) Forecast, by Application 2019 & 2032
- Table 40: Australia SNP Genotyping Market Volume (K Unit) Forecast, by Application 2019 & 2032
- Table 41: South Korea SNP Genotyping Market Revenue (Million) Forecast, by Application 2019 & 2032
- Table 42: South Korea SNP Genotyping Market Volume (K Unit) Forecast, by Application 2019 & 2032
- Table 43: Rest of Asia Pacific SNP Genotyping Market Revenue (Million) Forecast, by Application 2019 & 2032
- Table 44: Rest of Asia Pacific SNP Genotyping Market Volume (K Unit) Forecast, by Application 2019 & 2032
- Table 45: Global SNP Genotyping Market Revenue Million Forecast, by Country 2019 & 2032
- Table 46: Global SNP Genotyping Market Volume K Unit Forecast, by Country 2019 & 2032
- Table 47: GCC SNP Genotyping Market Revenue (Million) Forecast, by Application 2019 & 2032
- Table 48: GCC SNP Genotyping Market Volume (K Unit) Forecast, by Application 2019 & 2032
- Table 49: South Africa SNP Genotyping Market Revenue (Million) Forecast, by Application 2019 & 2032
- Table 50: South Africa SNP Genotyping Market Volume (K Unit) Forecast, by Application 2019 & 2032
- Table 51: Rest of Middle East and Africa SNP Genotyping Market Revenue (Million) Forecast, by Application 2019 & 2032
- Table 52: Rest of Middle East and Africa SNP Genotyping Market Volume (K Unit) Forecast, by Application 2019 & 2032
- Table 53: Global SNP Genotyping Market Revenue Million Forecast, by Country 2019 & 2032
- Table 54: Global SNP Genotyping Market Volume K Unit Forecast, by Country 2019 & 2032
- Table 55: Brazil SNP Genotyping Market Revenue (Million) Forecast, by Application 2019 & 2032
- Table 56: Brazil SNP Genotyping Market Volume (K Unit) Forecast, by Application 2019 & 2032
- Table 57: Argentina SNP Genotyping Market Revenue (Million) Forecast, by Application 2019 & 2032
- Table 58: Argentina SNP Genotyping Market Volume (K Unit) Forecast, by Application 2019 & 2032
- Table 59: Rest of South America SNP Genotyping Market Revenue (Million) Forecast, by Application 2019 & 2032
- Table 60: Rest of South America SNP Genotyping Market Volume (K Unit) Forecast, by Application 2019 & 2032
- Table 61: Global SNP Genotyping Market Revenue Million Forecast, by Technology 2019 & 2032
- Table 62: Global SNP Genotyping Market Volume K Unit Forecast, by Technology 2019 & 2032
- Table 63: Global SNP Genotyping Market Revenue Million Forecast, by End User 2019 & 2032
- Table 64: Global SNP Genotyping Market Volume K Unit Forecast, by End User 2019 & 2032
- Table 65: Global SNP Genotyping Market Revenue Million Forecast, by Country 2019 & 2032
- Table 66: Global SNP Genotyping Market Volume K Unit Forecast, by Country 2019 & 2032
- Table 67: United States SNP Genotyping Market Revenue (Million) Forecast, by Application 2019 & 2032
- Table 68: United States SNP Genotyping Market Volume (K Unit) Forecast, by Application 2019 & 2032
- Table 69: Canada SNP Genotyping Market Revenue (Million) Forecast, by Application 2019 & 2032
- Table 70: Canada SNP Genotyping Market Volume (K Unit) Forecast, by Application 2019 & 2032
- Table 71: Mexico SNP Genotyping Market Revenue (Million) Forecast, by Application 2019 & 2032
- Table 72: Mexico SNP Genotyping Market Volume (K Unit) Forecast, by Application 2019 & 2032
- Table 73: Global SNP Genotyping Market Revenue Million Forecast, by Technology 2019 & 2032
- Table 74: Global SNP Genotyping Market Volume K Unit Forecast, by Technology 2019 & 2032
- Table 75: Global SNP Genotyping Market Revenue Million Forecast, by End User 2019 & 2032
- Table 76: Global SNP Genotyping Market Volume K Unit Forecast, by End User 2019 & 2032
- Table 77: Global SNP Genotyping Market Revenue Million Forecast, by Country 2019 & 2032
- Table 78: Global SNP Genotyping Market Volume K Unit Forecast, by Country 2019 & 2032
- Table 79: Germany SNP Genotyping Market Revenue (Million) Forecast, by Application 2019 & 2032
- Table 80: Germany SNP Genotyping Market Volume (K Unit) Forecast, by Application 2019 & 2032
- Table 81: United Kingdom SNP Genotyping Market Revenue (Million) Forecast, by Application 2019 & 2032
- Table 82: United Kingdom SNP Genotyping Market Volume (K Unit) Forecast, by Application 2019 & 2032
- Table 83: France SNP Genotyping Market Revenue (Million) Forecast, by Application 2019 & 2032
- Table 84: France SNP Genotyping Market Volume (K Unit) Forecast, by Application 2019 & 2032
- Table 85: Italy SNP Genotyping Market Revenue (Million) Forecast, by Application 2019 & 2032
- Table 86: Italy SNP Genotyping Market Volume (K Unit) Forecast, by Application 2019 & 2032
- Table 87: Spain SNP Genotyping Market Revenue (Million) Forecast, by Application 2019 & 2032
- Table 88: Spain SNP Genotyping Market Volume (K Unit) Forecast, by Application 2019 & 2032
- Table 89: Rest of Europe SNP Genotyping Market Revenue (Million) Forecast, by Application 2019 & 2032
- Table 90: Rest of Europe SNP Genotyping Market Volume (K Unit) Forecast, by Application 2019 & 2032
- Table 91: Global SNP Genotyping Market Revenue Million Forecast, by Technology 2019 & 2032
- Table 92: Global SNP Genotyping Market Volume K Unit Forecast, by Technology 2019 & 2032
- Table 93: Global SNP Genotyping Market Revenue Million Forecast, by End User 2019 & 2032
- Table 94: Global SNP Genotyping Market Volume K Unit Forecast, by End User 2019 & 2032
- Table 95: Global SNP Genotyping Market Revenue Million Forecast, by Country 2019 & 2032
- Table 96: Global SNP Genotyping Market Volume K Unit Forecast, by Country 2019 & 2032
- Table 97: China SNP Genotyping Market Revenue (Million) Forecast, by Application 2019 & 2032
- Table 98: China SNP Genotyping Market Volume (K Unit) Forecast, by Application 2019 & 2032
- Table 99: Japan SNP Genotyping Market Revenue (Million) Forecast, by Application 2019 & 2032
- Table 100: Japan SNP Genotyping Market Volume (K Unit) Forecast, by Application 2019 & 2032
- Table 101: India SNP Genotyping Market Revenue (Million) Forecast, by Application 2019 & 2032
- Table 102: India SNP Genotyping Market Volume (K Unit) Forecast, by Application 2019 & 2032
- Table 103: Australia SNP Genotyping Market Revenue (Million) Forecast, by Application 2019 & 2032
- Table 104: Australia SNP Genotyping Market Volume (K Unit) Forecast, by Application 2019 & 2032
- Table 105: South Korea SNP Genotyping Market Revenue (Million) Forecast, by Application 2019 & 2032
- Table 106: South Korea SNP Genotyping Market Volume (K Unit) Forecast, by Application 2019 & 2032
- Table 107: Rest of Asia Pacific SNP Genotyping Market Revenue (Million) Forecast, by Application 2019 & 2032
- Table 108: Rest of Asia Pacific SNP Genotyping Market Volume (K Unit) Forecast, by Application 2019 & 2032
- Table 109: Global SNP Genotyping Market Revenue Million Forecast, by Technology 2019 & 2032
- Table 110: Global SNP Genotyping Market Volume K Unit Forecast, by Technology 2019 & 2032
- Table 111: Global SNP Genotyping Market Revenue Million Forecast, by End User 2019 & 2032
- Table 112: Global SNP Genotyping Market Volume K Unit Forecast, by End User 2019 & 2032
- Table 113: Global SNP Genotyping Market Revenue Million Forecast, by Country 2019 & 2032
- Table 114: Global SNP Genotyping Market Volume K Unit Forecast, by Country 2019 & 2032
- Table 115: GCC SNP Genotyping Market Revenue (Million) Forecast, by Application 2019 & 2032
- Table 116: GCC SNP Genotyping Market Volume (K Unit) Forecast, by Application 2019 & 2032
- Table 117: South Africa SNP Genotyping Market Revenue (Million) Forecast, by Application 2019 & 2032
- Table 118: South Africa SNP Genotyping Market Volume (K Unit) Forecast, by Application 2019 & 2032
- Table 119: Rest of Middle East and Africa SNP Genotyping Market Revenue (Million) Forecast, by Application 2019 & 2032
- Table 120: Rest of Middle East and Africa SNP Genotyping Market Volume (K Unit) Forecast, by Application 2019 & 2032
- Table 121: Global SNP Genotyping Market Revenue Million Forecast, by Technology 2019 & 2032
- Table 122: Global SNP Genotyping Market Volume K Unit Forecast, by Technology 2019 & 2032
- Table 123: Global SNP Genotyping Market Revenue Million Forecast, by End User 2019 & 2032
- Table 124: Global SNP Genotyping Market Volume K Unit Forecast, by End User 2019 & 2032
- Table 125: Global SNP Genotyping Market Revenue Million Forecast, by Country 2019 & 2032
- Table 126: Global SNP Genotyping Market Volume K Unit Forecast, by Country 2019 & 2032
- Table 127: Brazil SNP Genotyping Market Revenue (Million) Forecast, by Application 2019 & 2032
- Table 128: Brazil SNP Genotyping Market Volume (K Unit) Forecast, by Application 2019 & 2032
- Table 129: Argentina SNP Genotyping Market Revenue (Million) Forecast, by Application 2019 & 2032
- Table 130: Argentina SNP Genotyping Market Volume (K Unit) Forecast, by Application 2019 & 2032
- Table 131: Rest of South America SNP Genotyping Market Revenue (Million) Forecast, by Application 2019 & 2032
- Table 132: Rest of South America SNP Genotyping Market Volume (K Unit) Forecast, by Application 2019 & 2032
Frequently Asked Questions
1. What is the projected Compound Annual Growth Rate (CAGR) of the SNP Genotyping Market?
The projected CAGR is approximately 21.00%.
2. Which companies are prominent players in the SNP Genotyping Market?
Key companies in the market include LGC Group, PREMIER Biosoft, Promega Corporation, Bio-Rad Laboratories Inc, Luminex Corp, Douglas Scientific LLC, Danaher Corporation, Agilent Technologies Inc, Thermo Fischer Scientific Inc, Life Technologies Corp, Illumina Inc, Sequenom, Fluidigm Corporation.
3. What are the main segments of the SNP Genotyping Market?
The market segments include Technology, End User.
4. Can you provide details about the market size?
The market size is estimated to be USD XX Million as of 2022.
5. What are some drivers contributing to market growth?
Miniaturisation of Equipment and Instruments; Increased Multiplexing Capacity Leading to Increased Application.
6. What are the notable trends driving market growth?
Pharmacogenomics Segment Expected to Witness High Growth Over the Forecast Period.
7. Are there any restraints impacting market growth?
Lack of Standardisation in SNP Processes; Privacy Concerns Pose a Threat to Broad Technology Adoption.
8. Can you provide examples of recent developments in the market?
Feb 2021: Novacyt launched its SNPsig portfolio of PCR genotyping assays that can be used to aid the diagnosis of new variants of SARS-CoV-2.
9. What pricing options are available for accessing the report?
Pricing options include single-user, multi-user, and enterprise licenses priced at USD 4750, USD 5250, and USD 8750 respectively.
10. Is the market size provided in terms of value or volume?
The market size is provided in terms of value, measured in Million and volume, measured in K Unit.
11. Are there any specific market keywords associated with the report?
Yes, the market keyword associated with the report is "SNP Genotyping Market," which aids in identifying and referencing the specific market segment covered.
12. How do I determine which pricing option suits my needs best?
The pricing options vary based on user requirements and access needs. Individual users may opt for single-user licenses, while businesses requiring broader access may choose multi-user or enterprise licenses for cost-effective access to the report.
13. Are there any additional resources or data provided in the SNP Genotyping Market report?
While the report offers comprehensive insights, it's advisable to review the specific contents or supplementary materials provided to ascertain if additional resources or data are available.
14. How can I stay updated on further developments or reports in the SNP Genotyping Market?
To stay informed about further developments, trends, and reports in the SNP Genotyping Market, consider subscribing to industry newsletters, following relevant companies and organizations, or regularly checking reputable industry news sources and publications.
Methodology
Step 1 - Identification of Relevant Samples Size from Population Database


Step 2 - Approaches for Defining Global Market Size (Value, Volume* & Price*)

Note*: In applicable scenarios
Step 3 - Data Sources
Primary Research
- Web Analytics
- Survey Reports
- Research Institute
- Latest Research Reports
- Opinion Leaders
Secondary Research
- Annual Reports
- White Paper
- Latest Press Release
- Industry Association
- Paid Database
- Investor Presentations

Step 4 - Data Triangulation
Involves using different sources of information in order to increase the validity of a study
These sources are likely to be stakeholders in a program - participants, other researchers, program staff, other community members, and so on.
Then we put all data in single framework & apply various statistical tools to find out the dynamic on the market.
During the analysis stage, feedback from the stakeholder groups would be compared to determine areas of agreement as well as areas of divergence


