
Key Insights
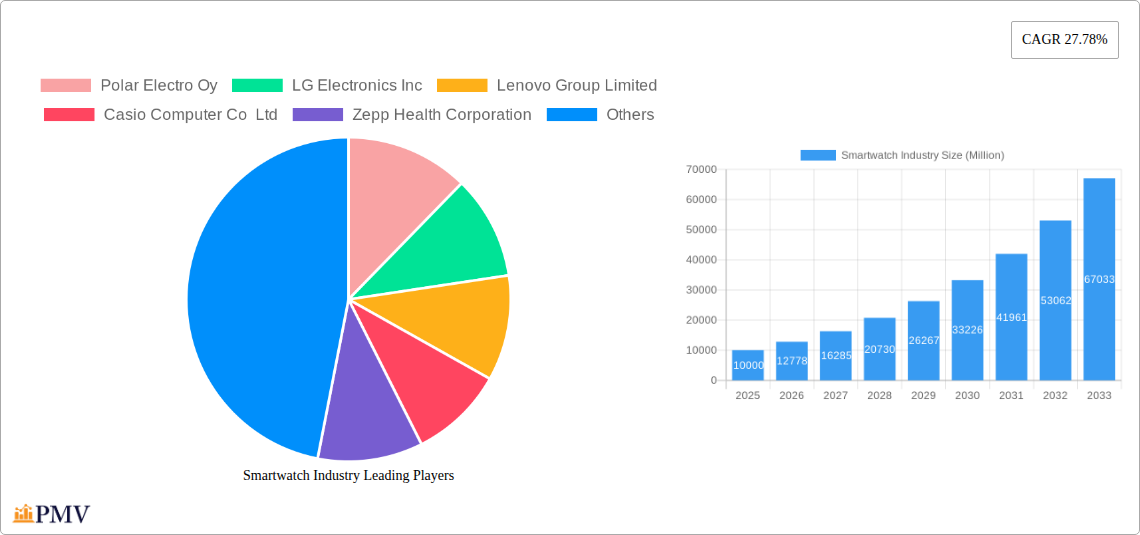
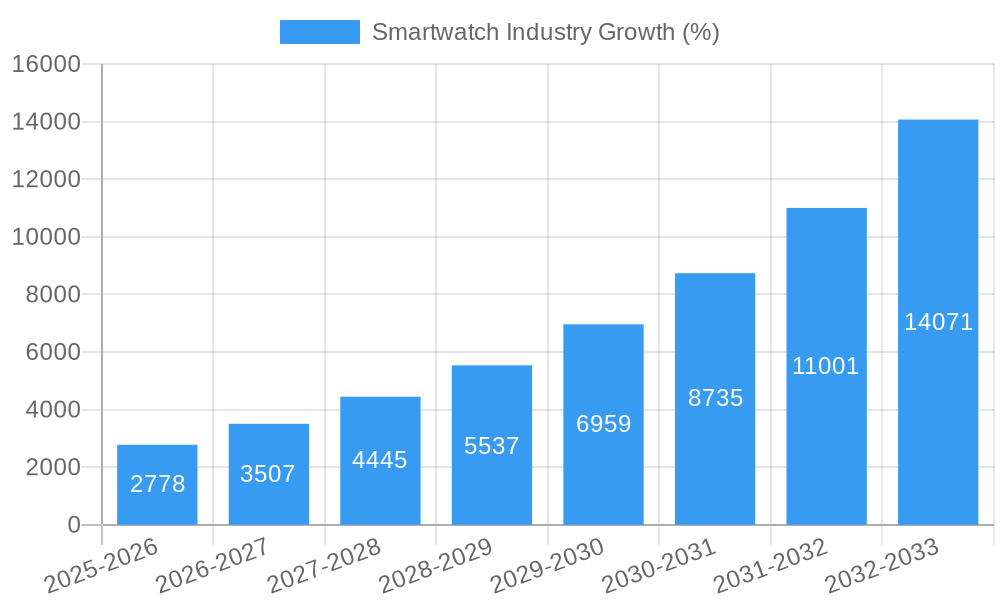
The global smartwatch market is experiencing robust growth, fueled by increasing demand for wearable technology and the integration of advanced health and fitness features. The market's Compound Annual Growth Rate (CAGR) of 27.78% from 2019 to 2024 indicates significant expansion, a trend expected to continue through 2033. Key drivers include the rising adoption of smartphones, increasing health consciousness among consumers leading to demand for fitness tracking capabilities, and continuous technological advancements enhancing smartwatch functionalities, such as improved battery life, better processing power, and more sophisticated sensor technologies. The diverse range of operating systems (WatchOS, Wear OS, etc.), display types (AMOLED, PMOLED, TFT LCD), and applications (personal assistance, medical monitoring, sports tracking) cater to a broad consumer base, further contributing to market expansion. While competition among major players like Apple, Samsung, Fitbit, and Garmin is intense, the market’s vast potential accommodates multiple players. The increasing affordability of smartwatches and the growing availability of stylish and feature-rich models are also contributing factors to market growth.
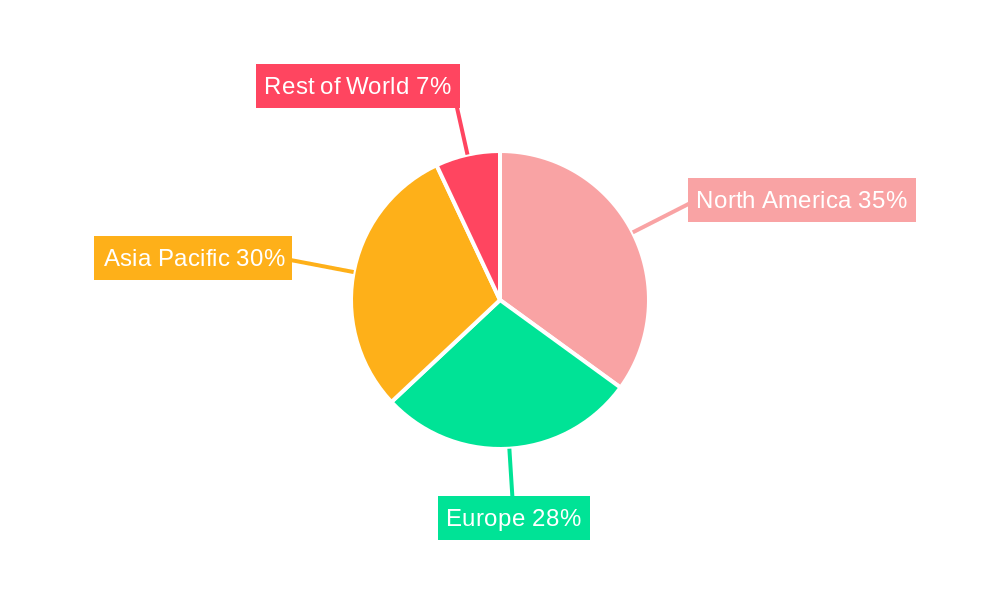
However, certain restraints exist. Pricing remains a barrier for some segments of the population, and concerns about battery life and data privacy continue to impact consumer decisions. Furthermore, the saturation of the mature markets like North America and Europe requires companies to focus on emerging markets in Asia Pacific and other regions to sustain the high growth trajectory. Nevertheless, innovation in areas like non-invasive health monitoring and integration with other IoT devices will likely overcome these challenges and propel future market growth. The shift towards integrated lifestyle management solutions rather than simple fitness trackers represents a significant trend, transforming the smartwatch from a simple accessory to a vital personal health and productivity tool.
Smartwatch Industry Market Report: 2019-2033
This comprehensive report provides a detailed analysis of the global smartwatch industry, encompassing market size, segmentation, competitive dynamics, and future growth projections from 2019 to 2033. The report leverages extensive research and data analysis to offer actionable insights for industry stakeholders, including manufacturers, investors, and technology enthusiasts. With a focus on key players like Apple, Samsung, and Garmin, this report is an indispensable resource for understanding the current landscape and navigating the future of this rapidly evolving market. The base year for this report is 2025, with estimations for 2025 and a forecast period spanning 2025-2033. The historical period covered is 2019-2024. The global smartwatch market is projected to reach xx Million by 2033.
Smartwatch Industry Market Structure & Competitive Dynamics
The global smartwatch market exhibits a moderately concentrated structure, with a few dominant players holding significant market share. Apple, Samsung, and Garmin are currently leading the market, while other key players like Fitbit, Huawei, and Fossil Group contribute substantially. The market is characterized by intense competition, driven by continuous innovation in features, design, and operating systems. The industry's innovation ecosystem is robust, with significant R&D investment from both established players and emerging startups. Regulatory frameworks, particularly concerning data privacy and health regulations, vary across different regions, influencing market dynamics. Product substitutes, including basic fitness trackers and traditional wristwatches, exert some competitive pressure, though the smartwatch market's advanced features and functionalities maintain its appeal. End-user trends point toward a growing preference for smartwatches with advanced health monitoring capabilities, personalized fitness tracking, and seamless smartphone integration. M&A activities have played a significant role in shaping the market landscape, with larger companies acquiring smaller players to expand their product portfolios and strengthen their market positions. Over the historical period, total M&A deal value exceeded xx Million, significantly shaping the competitive dynamics.
- Market Share: Apple holds approximately xx% market share, followed by Samsung at xx% and Garmin at xx%.
- M&A Deal Values (2019-2024): Total value exceeded xx Million, primarily driven by acquisitions aimed at technological advancements and geographic expansion.
- Innovation Ecosystem: Characterized by continuous development of features, improved health monitoring, and seamless integration with smartphones.
Smartwatch Industry Industry Trends & Insights
The smartwatch industry is experiencing robust growth, fueled by increasing consumer adoption and technological advancements. The Compound Annual Growth Rate (CAGR) during the forecast period (2025-2033) is estimated at xx%, reflecting the market's sustained expansion. Several factors contribute to this growth, including the rising popularity of wearable technology, increasing health consciousness among consumers, and the integration of sophisticated health and fitness tracking features. Technological disruptions, such as the advancement of sensor technologies and the development of more power-efficient processors, are enhancing the functionality and usability of smartwatches. Consumer preferences are shifting towards smartwatches with longer battery life, better water resistance, and more sophisticated health tracking capabilities. Competitive dynamics remain intense, with major players focusing on innovation, brand building, and strategic partnerships to maintain their market positions. Market penetration is increasing globally, particularly in developed economies, but significant growth potential exists in emerging markets. The increasing availability of affordable smartwatches is also driving market growth. Furthermore, the convergence of smartwatches with other wearable technology, such as smart earbuds and fitness trackers, is creating new opportunities for growth.
Dominant Markets & Segments in Smartwatch Industry
The North American market currently leads the global smartwatch industry, driven by strong consumer demand and high disposable incomes. However, the Asia-Pacific region is expected to exhibit the highest growth rate in the forecast period.
- By Operating System:
- Watch OS: Dominates the premium segment due to strong brand loyalty and seamless integration with Apple's ecosystem. Key driver: strong brand association with Apple products.
- Wear OS: Holds a significant share in the mid-range segment, with growing adoption due to its open-source nature and availability across multiple brands. Key driver: Platform's openness to various manufacturers and applications.
- Other Operating Systems: Includes proprietary OS from various brands; this segment offers a mix of features and price points, contributing to the overall market diversity. Key driver: niche features and brand-specific functionalities.
- By Display Type:
- AMOLED: Premium segment dominance due to superior image quality and power efficiency. Key driver: vibrant colours and enhanced viewing experience.
- PMOLED: Cost-effective option for budget-friendly smartwatches. Key driver: low cost and power-efficient performance.
- TFT LCD: Mainstream segment focus, providing a balance between cost and image quality. Key driver: balanced cost-performance compared to other displays.
- By Application:
- Personal Assistance: Largest segment, driven by features such as notifications, mobile payments, and app access. Key driver: convenience and improved user experience.
- Medical: Rapidly growing segment due to advancements in health monitoring capabilities and the rising focus on preventative healthcare. Key driver: increased user demand for health tracking and monitoring.
- Sports: Significant segment driven by features like GPS tracking, heart rate monitoring, and workout analysis. Key driver: increased fitness awareness and demand for advanced tracking.
- Other Applications: Includes niche applications like industrial use cases, providing specific functionalities for different professional requirements. Key driver: increasing demand for smartwatches in specific industries.
Smartwatch Industry Product Innovations
Recent years have witnessed significant product innovation in the smartwatch industry, with advancements focusing on enhanced health monitoring capabilities, longer battery life, improved design aesthetics, and the integration of new sensors. The introduction of advanced features like ECG monitoring, blood oxygen level tracking, and sleep analysis has broadened the appeal of smartwatches beyond basic fitness tracking. Companies are also focusing on seamless integration with other smart devices and creating innovative apps that expand the range of smartwatch functionalities. The development of more durable materials and water-resistant designs has increased the smartwatch's usability across a wider range of activities and environments. Improved processing power and display technology continue to drive product innovation, creating a better user experience.
Report Segmentation & Scope
This report segments the smartwatch market across various parameters, providing a granular view of the industry. The segmentation includes:
By Operating System: Watch OS, Wear OS, Other Operating Systems. Each segment’s growth is projected based on adoption rates and technological advancements. Competitive dynamics vary across segments, with different players dominating particular OS ecosystems.
By Display Type: AMOLED, PMOLED, TFT LCD. The segmentation assesses market size, growth trajectory, and competitive dynamics based on display technology preferences.
By Application: Personal Assistance, Medical, Sports, Other Applications. Market size and growth projections are analyzed for each application, highlighting the factors driving segment growth and competition.
Key Drivers of Smartwatch Industry Growth
Several factors propel the growth of the smartwatch industry. Technological advancements, such as improved battery life, better sensors, and more powerful processors, significantly enhance the user experience, driving adoption. Economic factors, including rising disposable incomes in emerging markets, increase the affordability of smartwatches, expanding the consumer base. Favorable regulatory frameworks in certain regions incentivize the development and deployment of smartwatches with advanced health monitoring capabilities.
Challenges in the Smartwatch Industry Sector
The smartwatch industry faces several challenges. Regulatory hurdles, particularly those related to data privacy and health data security, present significant hurdles for manufacturers. Supply chain disruptions can impact the production and availability of smartwatches, particularly concerning crucial components like sensors and processors. Intense competition from established players and the emergence of new entrants exert pressure on margins and market share, requiring continuous innovation and efficient cost management.
Leading Players in the Smartwatch Industry Market
- Polar Electro Oy
- LG Electronics Inc
- Lenovo Group Limited
- Casio Computer Co Ltd
- Zepp Health Corporation
- Samsung Electronics Co Ltd
- Garmin Ltd
- Fitbit Inc
- Huawei Technologies Co Ltd
- Fossil Group Inc
- Apple Inc
- Sony Corporation
Key Developments in Smartwatch Industry Sector
June 2022: Apple previewed watchOS 9, introducing new features and improved user experiences, enhancing personalization options and workout tracking. This significantly impacted market competition by setting a higher benchmark for software capabilities.
January 2022: Fossil and Razer partnered to launch a limited-edition smartwatch, showcasing successful collaborations that broaden product appeal and market reach.
Strategic Smartwatch Industry Market Outlook
The future of the smartwatch industry looks promising, with continued growth driven by technological innovation, increasing consumer adoption, and expanding applications. Strategic opportunities exist for companies to focus on developing smartwatches with enhanced health and fitness tracking capabilities, improved battery life, and seamless integration with other smart devices. The expansion into emerging markets and the development of niche applications will further drive industry growth. Companies that effectively navigate the challenges related to data privacy, supply chain management, and intense competition will be best positioned to capitalize on the considerable market potential.
Smartwatch Industry Segmentation
-
1. Operating System
- 1.1. Watch OS
- 1.2. Wear OS
- 1.3. Other Operating Systems
-
2. Display Type
- 2.1. AMOLED
- 2.2. PMOLED
- 2.3. TFT LCD
-
3. Application
- 3.1. Personal Assistance
- 3.2. Medical
- 3.3. Sports
- 3.4. Other Applications
Smartwatch Industry Segmentation By Geography
- 1. North America: United States Canada Mexico
- 2. Europe: Germany: France: Italy: United Kingdom Netherlands Rest of Europe
- 3. Asia Pacific: China, Japan, India, South Korea, Taiwan, Australia, Rest of Asia-Pacific
- 4. South America : Brazil, Argentina, Rest of South America
- 5. MEA: Middle East, Africa
Smartwatch Industry REPORT HIGHLIGHTS
| Aspects | Details |
|---|---|
| Study Period | 2019-2033 |
| Base Year | 2024 |
| Estimated Year | 2025 |
| Forecast Period | 2025-2033 |
| Historical Period | 2019-2024 |
| Growth Rate | CAGR of 27.78% from 2019-2033 |
| Segmentation |
|
Table of Contents
- 1. Introduction
- 1.1. Research Scope
- 1.2. Market Segmentation
- 1.3. Research Methodology
- 1.4. Definitions and Assumptions
- 2. Executive Summary
- 2.1. Introduction
- 3. Market Dynamics
- 3.1. Introduction
- 3.2. Market Drivers
- 3.2.1. Increasing Technological Advancements in the Wearables Market; Increasing Health Awareness among the Consumers
- 3.3. Market Restrains
- 3.3.1 Growing Complexity of Wearable Devices
- 3.3.2 Limited Use of Features
- 3.3.3 and Security Risks
- 3.4. Market Trends
- 3.4.1. Sports Segment to Account for Significant Market Share
- 4. Market Factor Analysis
- 4.1. Porters Five Forces
- 4.2. Supply/Value Chain
- 4.3. PESTEL analysis
- 4.4. Market Entropy
- 4.5. Patent/Trademark Analysis
- 5. Global Smartwatch Industry Analysis, Insights and Forecast, 2019-2031
- 5.1. Market Analysis, Insights and Forecast - by Operating System
- 5.1.1. Watch OS
- 5.1.2. Wear OS
- 5.1.3. Other Operating Systems
- 5.2. Market Analysis, Insights and Forecast - by Display Type
- 5.2.1. AMOLED
- 5.2.2. PMOLED
- 5.2.3. TFT LCD
- 5.3. Market Analysis, Insights and Forecast - by Application
- 5.3.1. Personal Assistance
- 5.3.2. Medical
- 5.3.3. Sports
- 5.3.4. Other Applications
- 5.4. Market Analysis, Insights and Forecast - by Region
- 5.4.1. North America: United States Canada Mexico
- 5.4.2. Europe: Germany: France: Italy: United Kingdom Netherlands Rest of Europe
- 5.4.3. Asia Pacific: China, Japan, India, South Korea, Taiwan, Australia, Rest of Asia-Pacific
- 5.4.4. South America : Brazil, Argentina, Rest of South America
- 5.4.5. MEA: Middle East, Africa
- 5.1. Market Analysis, Insights and Forecast - by Operating System
- 6. North America: United States Canada Mexico Smartwatch Industry Analysis, Insights and Forecast, 2019-2031
- 6.1. Market Analysis, Insights and Forecast - by Operating System
- 6.1.1. Watch OS
- 6.1.2. Wear OS
- 6.1.3. Other Operating Systems
- 6.2. Market Analysis, Insights and Forecast - by Display Type
- 6.2.1. AMOLED
- 6.2.2. PMOLED
- 6.2.3. TFT LCD
- 6.3. Market Analysis, Insights and Forecast - by Application
- 6.3.1. Personal Assistance
- 6.3.2. Medical
- 6.3.3. Sports
- 6.3.4. Other Applications
- 6.1. Market Analysis, Insights and Forecast - by Operating System
- 7. Europe: Germany: France: Italy: United Kingdom Netherlands Rest of Europe Smartwatch Industry Analysis, Insights and Forecast, 2019-2031
- 7.1. Market Analysis, Insights and Forecast - by Operating System
- 7.1.1. Watch OS
- 7.1.2. Wear OS
- 7.1.3. Other Operating Systems
- 7.2. Market Analysis, Insights and Forecast - by Display Type
- 7.2.1. AMOLED
- 7.2.2. PMOLED
- 7.2.3. TFT LCD
- 7.3. Market Analysis, Insights and Forecast - by Application
- 7.3.1. Personal Assistance
- 7.3.2. Medical
- 7.3.3. Sports
- 7.3.4. Other Applications
- 7.1. Market Analysis, Insights and Forecast - by Operating System
- 8. Asia Pacific: China, Japan, India, South Korea, Taiwan, Australia, Rest of Asia-Pacific Smartwatch Industry Analysis, Insights and Forecast, 2019-2031
- 8.1. Market Analysis, Insights and Forecast - by Operating System
- 8.1.1. Watch OS
- 8.1.2. Wear OS
- 8.1.3. Other Operating Systems
- 8.2. Market Analysis, Insights and Forecast - by Display Type
- 8.2.1. AMOLED
- 8.2.2. PMOLED
- 8.2.3. TFT LCD
- 8.3. Market Analysis, Insights and Forecast - by Application
- 8.3.1. Personal Assistance
- 8.3.2. Medical
- 8.3.3. Sports
- 8.3.4. Other Applications
- 8.1. Market Analysis, Insights and Forecast - by Operating System
- 9. South America : Brazil, Argentina, Rest of South America Smartwatch Industry Analysis, Insights and Forecast, 2019-2031
- 9.1. Market Analysis, Insights and Forecast - by Operating System
- 9.1.1. Watch OS
- 9.1.2. Wear OS
- 9.1.3. Other Operating Systems
- 9.2. Market Analysis, Insights and Forecast - by Display Type
- 9.2.1. AMOLED
- 9.2.2. PMOLED
- 9.2.3. TFT LCD
- 9.3. Market Analysis, Insights and Forecast - by Application
- 9.3.1. Personal Assistance
- 9.3.2. Medical
- 9.3.3. Sports
- 9.3.4. Other Applications
- 9.1. Market Analysis, Insights and Forecast - by Operating System
- 10. MEA: Middle East, Africa Smartwatch Industry Analysis, Insights and Forecast, 2019-2031
- 10.1. Market Analysis, Insights and Forecast - by Operating System
- 10.1.1. Watch OS
- 10.1.2. Wear OS
- 10.1.3. Other Operating Systems
- 10.2. Market Analysis, Insights and Forecast - by Display Type
- 10.2.1. AMOLED
- 10.2.2. PMOLED
- 10.2.3. TFT LCD
- 10.3. Market Analysis, Insights and Forecast - by Application
- 10.3.1. Personal Assistance
- 10.3.2. Medical
- 10.3.3. Sports
- 10.3.4. Other Applications
- 10.1. Market Analysis, Insights and Forecast - by Operating System
- 11. North America Smartwatch Industry Analysis, Insights and Forecast, 2019-2031
- 11.1. Market Analysis, Insights and Forecast - By Country/Sub-region
- 11.1.1.
- 12. Europe Smartwatch Industry Analysis, Insights and Forecast, 2019-2031
- 12.1. Market Analysis, Insights and Forecast - By Country/Sub-region
- 12.1.1.
- 13. Asia Pacific Smartwatch Industry Analysis, Insights and Forecast, 2019-2031
- 13.1. Market Analysis, Insights and Forecast - By Country/Sub-region
- 13.1.1.
- 14. Rest of the World Smartwatch Industry Analysis, Insights and Forecast, 2019-2031
- 14.1. Market Analysis, Insights and Forecast - By Country/Sub-region
- 14.1.1.
- 15. Competitive Analysis
- 15.1. Global Market Share Analysis 2024
- 15.2. Company Profiles
- 15.2.1 Polar Electro Oy
- 15.2.1.1. Overview
- 15.2.1.2. Products
- 15.2.1.3. SWOT Analysis
- 15.2.1.4. Recent Developments
- 15.2.1.5. Financials (Based on Availability)
- 15.2.2 LG Electronics Inc
- 15.2.2.1. Overview
- 15.2.2.2. Products
- 15.2.2.3. SWOT Analysis
- 15.2.2.4. Recent Developments
- 15.2.2.5. Financials (Based on Availability)
- 15.2.3 Lenovo Group Limited
- 15.2.3.1. Overview
- 15.2.3.2. Products
- 15.2.3.3. SWOT Analysis
- 15.2.3.4. Recent Developments
- 15.2.3.5. Financials (Based on Availability)
- 15.2.4 Casio Computer Co Ltd
- 15.2.4.1. Overview
- 15.2.4.2. Products
- 15.2.4.3. SWOT Analysis
- 15.2.4.4. Recent Developments
- 15.2.4.5. Financials (Based on Availability)
- 15.2.5 Zepp Health Corporation
- 15.2.5.1. Overview
- 15.2.5.2. Products
- 15.2.5.3. SWOT Analysis
- 15.2.5.4. Recent Developments
- 15.2.5.5. Financials (Based on Availability)
- 15.2.6 Samsung Electronics Co Ltd
- 15.2.6.1. Overview
- 15.2.6.2. Products
- 15.2.6.3. SWOT Analysis
- 15.2.6.4. Recent Developments
- 15.2.6.5. Financials (Based on Availability)
- 15.2.7 Garmin Ltd
- 15.2.7.1. Overview
- 15.2.7.2. Products
- 15.2.7.3. SWOT Analysis
- 15.2.7.4. Recent Developments
- 15.2.7.5. Financials (Based on Availability)
- 15.2.8 Fitbit Inc
- 15.2.8.1. Overview
- 15.2.8.2. Products
- 15.2.8.3. SWOT Analysis
- 15.2.8.4. Recent Developments
- 15.2.8.5. Financials (Based on Availability)
- 15.2.9 Huawei Technologies Co Ltd
- 15.2.9.1. Overview
- 15.2.9.2. Products
- 15.2.9.3. SWOT Analysis
- 15.2.9.4. Recent Developments
- 15.2.9.5. Financials (Based on Availability)
- 15.2.10 Fossil Group Inc
- 15.2.10.1. Overview
- 15.2.10.2. Products
- 15.2.10.3. SWOT Analysis
- 15.2.10.4. Recent Developments
- 15.2.10.5. Financials (Based on Availability)
- 15.2.11 Apple Inc
- 15.2.11.1. Overview
- 15.2.11.2. Products
- 15.2.11.3. SWOT Analysis
- 15.2.11.4. Recent Developments
- 15.2.11.5. Financials (Based on Availability)
- 15.2.12 Sony Corporation
- 15.2.12.1. Overview
- 15.2.12.2. Products
- 15.2.12.3. SWOT Analysis
- 15.2.12.4. Recent Developments
- 15.2.12.5. Financials (Based on Availability)
- 15.2.1 Polar Electro Oy
List of Figures
- Figure 1: Global Smartwatch Industry Revenue Breakdown (Million, %) by Region 2024 & 2032
- Figure 2: Global Smartwatch Industry Volume Breakdown (Million, %) by Region 2024 & 2032
- Figure 3: North America Smartwatch Industry Revenue (Million), by Country 2024 & 2032
- Figure 4: North America Smartwatch Industry Volume (Million), by Country 2024 & 2032
- Figure 5: North America Smartwatch Industry Revenue Share (%), by Country 2024 & 2032
- Figure 6: North America Smartwatch Industry Volume Share (%), by Country 2024 & 2032
- Figure 7: Europe Smartwatch Industry Revenue (Million), by Country 2024 & 2032
- Figure 8: Europe Smartwatch Industry Volume (Million), by Country 2024 & 2032
- Figure 9: Europe Smartwatch Industry Revenue Share (%), by Country 2024 & 2032
- Figure 10: Europe Smartwatch Industry Volume Share (%), by Country 2024 & 2032
- Figure 11: Asia Pacific Smartwatch Industry Revenue (Million), by Country 2024 & 2032
- Figure 12: Asia Pacific Smartwatch Industry Volume (Million), by Country 2024 & 2032
- Figure 13: Asia Pacific Smartwatch Industry Revenue Share (%), by Country 2024 & 2032
- Figure 14: Asia Pacific Smartwatch Industry Volume Share (%), by Country 2024 & 2032
- Figure 15: Rest of the World Smartwatch Industry Revenue (Million), by Country 2024 & 2032
- Figure 16: Rest of the World Smartwatch Industry Volume (Million), by Country 2024 & 2032
- Figure 17: Rest of the World Smartwatch Industry Revenue Share (%), by Country 2024 & 2032
- Figure 18: Rest of the World Smartwatch Industry Volume Share (%), by Country 2024 & 2032
- Figure 19: North America: United States Canada Mexico Smartwatch Industry Revenue (Million), by Operating System 2024 & 2032
- Figure 20: North America: United States Canada Mexico Smartwatch Industry Volume (Million), by Operating System 2024 & 2032
- Figure 21: North America: United States Canada Mexico Smartwatch Industry Revenue Share (%), by Operating System 2024 & 2032
- Figure 22: North America: United States Canada Mexico Smartwatch Industry Volume Share (%), by Operating System 2024 & 2032
- Figure 23: North America: United States Canada Mexico Smartwatch Industry Revenue (Million), by Display Type 2024 & 2032
- Figure 24: North America: United States Canada Mexico Smartwatch Industry Volume (Million), by Display Type 2024 & 2032
- Figure 25: North America: United States Canada Mexico Smartwatch Industry Revenue Share (%), by Display Type 2024 & 2032
- Figure 26: North America: United States Canada Mexico Smartwatch Industry Volume Share (%), by Display Type 2024 & 2032
- Figure 27: North America: United States Canada Mexico Smartwatch Industry Revenue (Million), by Application 2024 & 2032
- Figure 28: North America: United States Canada Mexico Smartwatch Industry Volume (Million), by Application 2024 & 2032
- Figure 29: North America: United States Canada Mexico Smartwatch Industry Revenue Share (%), by Application 2024 & 2032
- Figure 30: North America: United States Canada Mexico Smartwatch Industry Volume Share (%), by Application 2024 & 2032
- Figure 31: North America: United States Canada Mexico Smartwatch Industry Revenue (Million), by Country 2024 & 2032
- Figure 32: North America: United States Canada Mexico Smartwatch Industry Volume (Million), by Country 2024 & 2032
- Figure 33: North America: United States Canada Mexico Smartwatch Industry Revenue Share (%), by Country 2024 & 2032
- Figure 34: North America: United States Canada Mexico Smartwatch Industry Volume Share (%), by Country 2024 & 2032
- Figure 35: Europe: Germany: France: Italy: United Kingdom Netherlands Rest of Europe Smartwatch Industry Revenue (Million), by Operating System 2024 & 2032
- Figure 36: Europe: Germany: France: Italy: United Kingdom Netherlands Rest of Europe Smartwatch Industry Volume (Million), by Operating System 2024 & 2032
- Figure 37: Europe: Germany: France: Italy: United Kingdom Netherlands Rest of Europe Smartwatch Industry Revenue Share (%), by Operating System 2024 & 2032
- Figure 38: Europe: Germany: France: Italy: United Kingdom Netherlands Rest of Europe Smartwatch Industry Volume Share (%), by Operating System 2024 & 2032
- Figure 39: Europe: Germany: France: Italy: United Kingdom Netherlands Rest of Europe Smartwatch Industry Revenue (Million), by Display Type 2024 & 2032
- Figure 40: Europe: Germany: France: Italy: United Kingdom Netherlands Rest of Europe Smartwatch Industry Volume (Million), by Display Type 2024 & 2032
- Figure 41: Europe: Germany: France: Italy: United Kingdom Netherlands Rest of Europe Smartwatch Industry Revenue Share (%), by Display Type 2024 & 2032
- Figure 42: Europe: Germany: France: Italy: United Kingdom Netherlands Rest of Europe Smartwatch Industry Volume Share (%), by Display Type 2024 & 2032
- Figure 43: Europe: Germany: France: Italy: United Kingdom Netherlands Rest of Europe Smartwatch Industry Revenue (Million), by Application 2024 & 2032
- Figure 44: Europe: Germany: France: Italy: United Kingdom Netherlands Rest of Europe Smartwatch Industry Volume (Million), by Application 2024 & 2032
- Figure 45: Europe: Germany: France: Italy: United Kingdom Netherlands Rest of Europe Smartwatch Industry Revenue Share (%), by Application 2024 & 2032
- Figure 46: Europe: Germany: France: Italy: United Kingdom Netherlands Rest of Europe Smartwatch Industry Volume Share (%), by Application 2024 & 2032
- Figure 47: Europe: Germany: France: Italy: United Kingdom Netherlands Rest of Europe Smartwatch Industry Revenue (Million), by Country 2024 & 2032
- Figure 48: Europe: Germany: France: Italy: United Kingdom Netherlands Rest of Europe Smartwatch Industry Volume (Million), by Country 2024 & 2032
- Figure 49: Europe: Germany: France: Italy: United Kingdom Netherlands Rest of Europe Smartwatch Industry Revenue Share (%), by Country 2024 & 2032
- Figure 50: Europe: Germany: France: Italy: United Kingdom Netherlands Rest of Europe Smartwatch Industry Volume Share (%), by Country 2024 & 2032
- Figure 51: Asia Pacific: China, Japan, India, South Korea, Taiwan, Australia, Rest of Asia-Pacific Smartwatch Industry Revenue (Million), by Operating System 2024 & 2032
- Figure 52: Asia Pacific: China, Japan, India, South Korea, Taiwan, Australia, Rest of Asia-Pacific Smartwatch Industry Volume (Million), by Operating System 2024 & 2032
- Figure 53: Asia Pacific: China, Japan, India, South Korea, Taiwan, Australia, Rest of Asia-Pacific Smartwatch Industry Revenue Share (%), by Operating System 2024 & 2032
- Figure 54: Asia Pacific: China, Japan, India, South Korea, Taiwan, Australia, Rest of Asia-Pacific Smartwatch Industry Volume Share (%), by Operating System 2024 & 2032
- Figure 55: Asia Pacific: China, Japan, India, South Korea, Taiwan, Australia, Rest of Asia-Pacific Smartwatch Industry Revenue (Million), by Display Type 2024 & 2032
- Figure 56: Asia Pacific: China, Japan, India, South Korea, Taiwan, Australia, Rest of Asia-Pacific Smartwatch Industry Volume (Million), by Display Type 2024 & 2032
- Figure 57: Asia Pacific: China, Japan, India, South Korea, Taiwan, Australia, Rest of Asia-Pacific Smartwatch Industry Revenue Share (%), by Display Type 2024 & 2032
- Figure 58: Asia Pacific: China, Japan, India, South Korea, Taiwan, Australia, Rest of Asia-Pacific Smartwatch Industry Volume Share (%), by Display Type 2024 & 2032
- Figure 59: Asia Pacific: China, Japan, India, South Korea, Taiwan, Australia, Rest of Asia-Pacific Smartwatch Industry Revenue (Million), by Application 2024 & 2032
- Figure 60: Asia Pacific: China, Japan, India, South Korea, Taiwan, Australia, Rest of Asia-Pacific Smartwatch Industry Volume (Million), by Application 2024 & 2032
- Figure 61: Asia Pacific: China, Japan, India, South Korea, Taiwan, Australia, Rest of Asia-Pacific Smartwatch Industry Revenue Share (%), by Application 2024 & 2032
- Figure 62: Asia Pacific: China, Japan, India, South Korea, Taiwan, Australia, Rest of Asia-Pacific Smartwatch Industry Volume Share (%), by Application 2024 & 2032
- Figure 63: Asia Pacific: China, Japan, India, South Korea, Taiwan, Australia, Rest of Asia-Pacific Smartwatch Industry Revenue (Million), by Country 2024 & 2032
- Figure 64: Asia Pacific: China, Japan, India, South Korea, Taiwan, Australia, Rest of Asia-Pacific Smartwatch Industry Volume (Million), by Country 2024 & 2032
- Figure 65: Asia Pacific: China, Japan, India, South Korea, Taiwan, Australia, Rest of Asia-Pacific Smartwatch Industry Revenue Share (%), by Country 2024 & 2032
- Figure 66: Asia Pacific: China, Japan, India, South Korea, Taiwan, Australia, Rest of Asia-Pacific Smartwatch Industry Volume Share (%), by Country 2024 & 2032
- Figure 67: South America : Brazil, Argentina, Rest of South America Smartwatch Industry Revenue (Million), by Operating System 2024 & 2032
- Figure 68: South America : Brazil, Argentina, Rest of South America Smartwatch Industry Volume (Million), by Operating System 2024 & 2032
- Figure 69: South America : Brazil, Argentina, Rest of South America Smartwatch Industry Revenue Share (%), by Operating System 2024 & 2032
- Figure 70: South America : Brazil, Argentina, Rest of South America Smartwatch Industry Volume Share (%), by Operating System 2024 & 2032
- Figure 71: South America : Brazil, Argentina, Rest of South America Smartwatch Industry Revenue (Million), by Display Type 2024 & 2032
- Figure 72: South America : Brazil, Argentina, Rest of South America Smartwatch Industry Volume (Million), by Display Type 2024 & 2032
- Figure 73: South America : Brazil, Argentina, Rest of South America Smartwatch Industry Revenue Share (%), by Display Type 2024 & 2032
- Figure 74: South America : Brazil, Argentina, Rest of South America Smartwatch Industry Volume Share (%), by Display Type 2024 & 2032
- Figure 75: South America : Brazil, Argentina, Rest of South America Smartwatch Industry Revenue (Million), by Application 2024 & 2032
- Figure 76: South America : Brazil, Argentina, Rest of South America Smartwatch Industry Volume (Million), by Application 2024 & 2032
- Figure 77: South America : Brazil, Argentina, Rest of South America Smartwatch Industry Revenue Share (%), by Application 2024 & 2032
- Figure 78: South America : Brazil, Argentina, Rest of South America Smartwatch Industry Volume Share (%), by Application 2024 & 2032
- Figure 79: South America : Brazil, Argentina, Rest of South America Smartwatch Industry Revenue (Million), by Country 2024 & 2032
- Figure 80: South America : Brazil, Argentina, Rest of South America Smartwatch Industry Volume (Million), by Country 2024 & 2032
- Figure 81: South America : Brazil, Argentina, Rest of South America Smartwatch Industry Revenue Share (%), by Country 2024 & 2032
- Figure 82: South America : Brazil, Argentina, Rest of South America Smartwatch Industry Volume Share (%), by Country 2024 & 2032
- Figure 83: MEA: Middle East, Africa Smartwatch Industry Revenue (Million), by Operating System 2024 & 2032
- Figure 84: MEA: Middle East, Africa Smartwatch Industry Volume (Million), by Operating System 2024 & 2032
- Figure 85: MEA: Middle East, Africa Smartwatch Industry Revenue Share (%), by Operating System 2024 & 2032
- Figure 86: MEA: Middle East, Africa Smartwatch Industry Volume Share (%), by Operating System 2024 & 2032
- Figure 87: MEA: Middle East, Africa Smartwatch Industry Revenue (Million), by Display Type 2024 & 2032
- Figure 88: MEA: Middle East, Africa Smartwatch Industry Volume (Million), by Display Type 2024 & 2032
- Figure 89: MEA: Middle East, Africa Smartwatch Industry Revenue Share (%), by Display Type 2024 & 2032
- Figure 90: MEA: Middle East, Africa Smartwatch Industry Volume Share (%), by Display Type 2024 & 2032
- Figure 91: MEA: Middle East, Africa Smartwatch Industry Revenue (Million), by Application 2024 & 2032
- Figure 92: MEA: Middle East, Africa Smartwatch Industry Volume (Million), by Application 2024 & 2032
- Figure 93: MEA: Middle East, Africa Smartwatch Industry Revenue Share (%), by Application 2024 & 2032
- Figure 94: MEA: Middle East, Africa Smartwatch Industry Volume Share (%), by Application 2024 & 2032
- Figure 95: MEA: Middle East, Africa Smartwatch Industry Revenue (Million), by Country 2024 & 2032
- Figure 96: MEA: Middle East, Africa Smartwatch Industry Volume (Million), by Country 2024 & 2032
- Figure 97: MEA: Middle East, Africa Smartwatch Industry Revenue Share (%), by Country 2024 & 2032
- Figure 98: MEA: Middle East, Africa Smartwatch Industry Volume Share (%), by Country 2024 & 2032
List of Tables
- Table 1: Global Smartwatch Industry Revenue Million Forecast, by Region 2019 & 2032
- Table 2: Global Smartwatch Industry Volume Million Forecast, by Region 2019 & 2032
- Table 3: Global Smartwatch Industry Revenue Million Forecast, by Operating System 2019 & 2032
- Table 4: Global Smartwatch Industry Volume Million Forecast, by Operating System 2019 & 2032
- Table 5: Global Smartwatch Industry Revenue Million Forecast, by Display Type 2019 & 2032
- Table 6: Global Smartwatch Industry Volume Million Forecast, by Display Type 2019 & 2032
- Table 7: Global Smartwatch Industry Revenue Million Forecast, by Application 2019 & 2032
- Table 8: Global Smartwatch Industry Volume Million Forecast, by Application 2019 & 2032
- Table 9: Global Smartwatch Industry Revenue Million Forecast, by Region 2019 & 2032
- Table 10: Global Smartwatch Industry Volume Million Forecast, by Region 2019 & 2032
- Table 11: Global Smartwatch Industry Revenue Million Forecast, by Country 2019 & 2032
- Table 12: Global Smartwatch Industry Volume Million Forecast, by Country 2019 & 2032
- Table 13: Smartwatch Industry Revenue (Million) Forecast, by Application 2019 & 2032
- Table 14: Smartwatch Industry Volume (Million) Forecast, by Application 2019 & 2032
- Table 15: Global Smartwatch Industry Revenue Million Forecast, by Country 2019 & 2032
- Table 16: Global Smartwatch Industry Volume Million Forecast, by Country 2019 & 2032
- Table 17: Smartwatch Industry Revenue (Million) Forecast, by Application 2019 & 2032
- Table 18: Smartwatch Industry Volume (Million) Forecast, by Application 2019 & 2032
- Table 19: Global Smartwatch Industry Revenue Million Forecast, by Country 2019 & 2032
- Table 20: Global Smartwatch Industry Volume Million Forecast, by Country 2019 & 2032
- Table 21: Smartwatch Industry Revenue (Million) Forecast, by Application 2019 & 2032
- Table 22: Smartwatch Industry Volume (Million) Forecast, by Application 2019 & 2032
- Table 23: Global Smartwatch Industry Revenue Million Forecast, by Country 2019 & 2032
- Table 24: Global Smartwatch Industry Volume Million Forecast, by Country 2019 & 2032
- Table 25: Smartwatch Industry Revenue (Million) Forecast, by Application 2019 & 2032
- Table 26: Smartwatch Industry Volume (Million) Forecast, by Application 2019 & 2032
- Table 27: Global Smartwatch Industry Revenue Million Forecast, by Operating System 2019 & 2032
- Table 28: Global Smartwatch Industry Volume Million Forecast, by Operating System 2019 & 2032
- Table 29: Global Smartwatch Industry Revenue Million Forecast, by Display Type 2019 & 2032
- Table 30: Global Smartwatch Industry Volume Million Forecast, by Display Type 2019 & 2032
- Table 31: Global Smartwatch Industry Revenue Million Forecast, by Application 2019 & 2032
- Table 32: Global Smartwatch Industry Volume Million Forecast, by Application 2019 & 2032
- Table 33: Global Smartwatch Industry Revenue Million Forecast, by Country 2019 & 2032
- Table 34: Global Smartwatch Industry Volume Million Forecast, by Country 2019 & 2032
- Table 35: Global Smartwatch Industry Revenue Million Forecast, by Operating System 2019 & 2032
- Table 36: Global Smartwatch Industry Volume Million Forecast, by Operating System 2019 & 2032
- Table 37: Global Smartwatch Industry Revenue Million Forecast, by Display Type 2019 & 2032
- Table 38: Global Smartwatch Industry Volume Million Forecast, by Display Type 2019 & 2032
- Table 39: Global Smartwatch Industry Revenue Million Forecast, by Application 2019 & 2032
- Table 40: Global Smartwatch Industry Volume Million Forecast, by Application 2019 & 2032
- Table 41: Global Smartwatch Industry Revenue Million Forecast, by Country 2019 & 2032
- Table 42: Global Smartwatch Industry Volume Million Forecast, by Country 2019 & 2032
- Table 43: Global Smartwatch Industry Revenue Million Forecast, by Operating System 2019 & 2032
- Table 44: Global Smartwatch Industry Volume Million Forecast, by Operating System 2019 & 2032
- Table 45: Global Smartwatch Industry Revenue Million Forecast, by Display Type 2019 & 2032
- Table 46: Global Smartwatch Industry Volume Million Forecast, by Display Type 2019 & 2032
- Table 47: Global Smartwatch Industry Revenue Million Forecast, by Application 2019 & 2032
- Table 48: Global Smartwatch Industry Volume Million Forecast, by Application 2019 & 2032
- Table 49: Global Smartwatch Industry Revenue Million Forecast, by Country 2019 & 2032
- Table 50: Global Smartwatch Industry Volume Million Forecast, by Country 2019 & 2032
- Table 51: Global Smartwatch Industry Revenue Million Forecast, by Operating System 2019 & 2032
- Table 52: Global Smartwatch Industry Volume Million Forecast, by Operating System 2019 & 2032
- Table 53: Global Smartwatch Industry Revenue Million Forecast, by Display Type 2019 & 2032
- Table 54: Global Smartwatch Industry Volume Million Forecast, by Display Type 2019 & 2032
- Table 55: Global Smartwatch Industry Revenue Million Forecast, by Application 2019 & 2032
- Table 56: Global Smartwatch Industry Volume Million Forecast, by Application 2019 & 2032
- Table 57: Global Smartwatch Industry Revenue Million Forecast, by Country 2019 & 2032
- Table 58: Global Smartwatch Industry Volume Million Forecast, by Country 2019 & 2032
- Table 59: Global Smartwatch Industry Revenue Million Forecast, by Operating System 2019 & 2032
- Table 60: Global Smartwatch Industry Volume Million Forecast, by Operating System 2019 & 2032
- Table 61: Global Smartwatch Industry Revenue Million Forecast, by Display Type 2019 & 2032
- Table 62: Global Smartwatch Industry Volume Million Forecast, by Display Type 2019 & 2032
- Table 63: Global Smartwatch Industry Revenue Million Forecast, by Application 2019 & 2032
- Table 64: Global Smartwatch Industry Volume Million Forecast, by Application 2019 & 2032
- Table 65: Global Smartwatch Industry Revenue Million Forecast, by Country 2019 & 2032
- Table 66: Global Smartwatch Industry Volume Million Forecast, by Country 2019 & 2032
Frequently Asked Questions
1. What is the projected Compound Annual Growth Rate (CAGR) of the Smartwatch Industry?
The projected CAGR is approximately 27.78%.
2. Which companies are prominent players in the Smartwatch Industry?
Key companies in the market include Polar Electro Oy, LG Electronics Inc, Lenovo Group Limited, Casio Computer Co Ltd, Zepp Health Corporation, Samsung Electronics Co Ltd, Garmin Ltd, Fitbit Inc, Huawei Technologies Co Ltd, Fossil Group Inc, Apple Inc, Sony Corporation.
3. What are the main segments of the Smartwatch Industry?
The market segments include Operating System, Display Type, Application.
4. Can you provide details about the market size?
The market size is estimated to be USD XX Million as of 2022.
5. What are some drivers contributing to market growth?
Increasing Technological Advancements in the Wearables Market; Increasing Health Awareness among the Consumers.
6. What are the notable trends driving market growth?
Sports Segment to Account for Significant Market Share.
7. Are there any restraints impacting market growth?
Growing Complexity of Wearable Devices. Limited Use of Features. and Security Risks.
8. Can you provide examples of recent developments in the market?
June 2022 - Apple previewed watch OS 9, which brings the latest features and improved experiences to the wearable operating system. Apple Watch users can now have more watch faces to choose from, with richer complications that offer more information and opportunity for personalization. In the updated Workout app, advanced metrics, views, and training experiences inspired by high-performing athletes help users take their workouts to the next level.
9. What pricing options are available for accessing the report?
Pricing options include single-user, multi-user, and enterprise licenses priced at USD 3800, USD 4500, and USD 5800 respectively.
10. Is the market size provided in terms of value or volume?
The market size is provided in terms of value, measured in Million and volume, measured in Million.
11. Are there any specific market keywords associated with the report?
Yes, the market keyword associated with the report is "Smartwatch Industry," which aids in identifying and referencing the specific market segment covered.
12. How do I determine which pricing option suits my needs best?
The pricing options vary based on user requirements and access needs. Individual users may opt for single-user licenses, while businesses requiring broader access may choose multi-user or enterprise licenses for cost-effective access to the report.
13. Are there any additional resources or data provided in the Smartwatch Industry report?
While the report offers comprehensive insights, it's advisable to review the specific contents or supplementary materials provided to ascertain if additional resources or data are available.
14. How can I stay updated on further developments or reports in the Smartwatch Industry?
To stay informed about further developments, trends, and reports in the Smartwatch Industry, consider subscribing to industry newsletters, following relevant companies and organizations, or regularly checking reputable industry news sources and publications.
Methodology
Step 1 - Identification of Relevant Samples Size from Population Database


Step 2 - Approaches for Defining Global Market Size (Value, Volume* & Price*)

Note*: In applicable scenarios
Step 3 - Data Sources
Primary Research
- Web Analytics
- Survey Reports
- Research Institute
- Latest Research Reports
- Opinion Leaders
Secondary Research
- Annual Reports
- White Paper
- Latest Press Release
- Industry Association
- Paid Database
- Investor Presentations

Step 4 - Data Triangulation
Involves using different sources of information in order to increase the validity of a study
These sources are likely to be stakeholders in a program - participants, other researchers, program staff, other community members, and so on.
Then we put all data in single framework & apply various statistical tools to find out the dynamic on the market.
During the analysis stage, feedback from the stakeholder groups would be compared to determine areas of agreement as well as areas of divergence


