
Key Insights
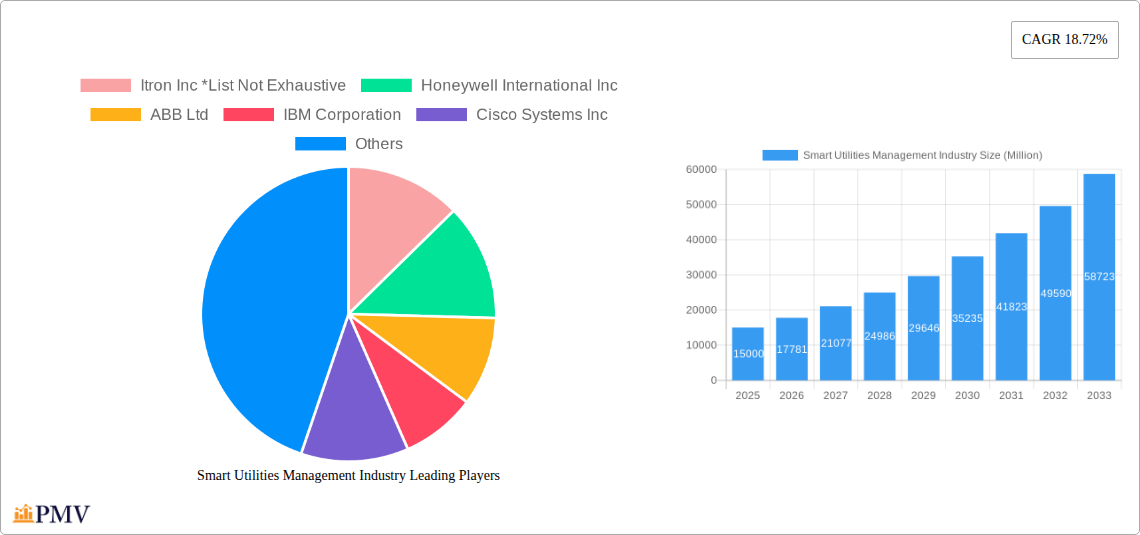
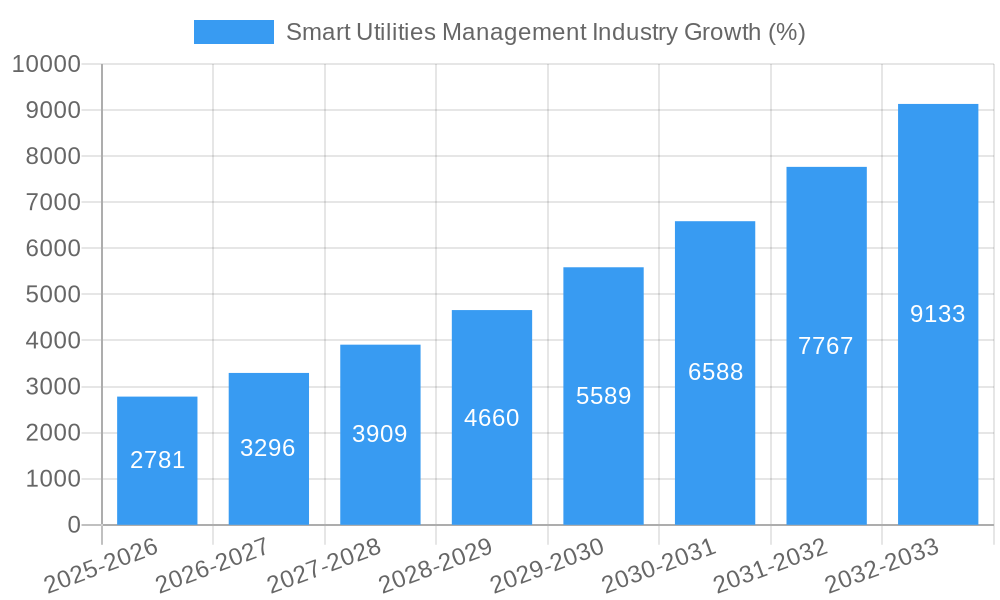
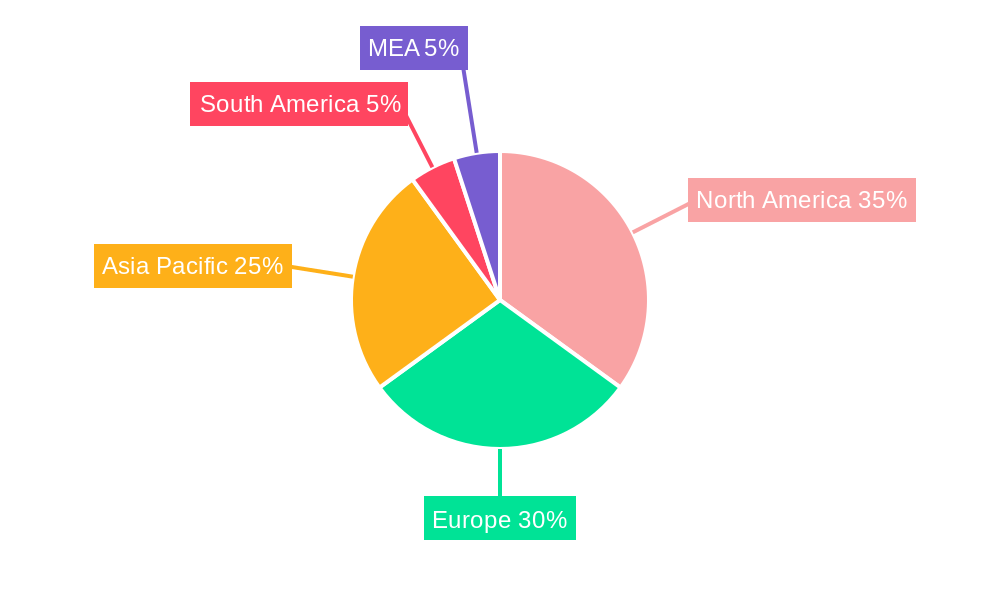
The Smart Utilities Management market is experiencing robust growth, projected at a Compound Annual Growth Rate (CAGR) of 18.72% from 2019 to 2033. This expansion is fueled by several key drivers. Increasing urbanization and the escalating demand for reliable energy infrastructure are pushing utilities to adopt advanced technologies for efficient grid management. The rising adoption of smart meters, enabling real-time energy monitoring and data analysis, is a significant contributor. Furthermore, government regulations promoting energy efficiency and renewable energy integration are creating a favorable environment for market growth. The integration of Internet of Things (IoT) devices and advanced analytics further enhances grid optimization, predictive maintenance, and improved customer service, bolstering market adoption. Key market segments include Meter Data Management Systems (MDMS), Energy Monitoring/Management systems, and Smart Distribution Management solutions. North America and Europe currently hold significant market share, driven by early adoption and robust regulatory frameworks, but the Asia-Pacific region is poised for rapid growth due to increasing infrastructure development and government initiatives. While initial investments in infrastructure can present a restraint, the long-term cost savings and improved efficiency associated with smart utility management are driving widespread adoption.
Competition within the market is intense, with established players like Itron Inc., Honeywell International Inc., ABB Ltd., IBM Corporation, Cisco Systems Inc., Siemens AG, Atos SE, and Tendrill Inc. vying for market dominance. These companies are investing heavily in research and development to offer advanced solutions and expand their geographical reach. The market's future hinges on continued technological innovation, particularly in areas such as artificial intelligence (AI) for predictive maintenance and blockchain technology for enhanced security and transparency. The ongoing evolution of communication networks, including 5G and improved broadband access, will play a critical role in supporting the real-time data transmission essential for effective smart utility management. This synergy of technological advancements and regulatory support will ensure continued, strong growth of the smart utilities market in the coming years.
Smart Utilities Management Industry: A Comprehensive Market Analysis (2019-2033)
This in-depth report provides a comprehensive analysis of the Smart Utilities Management industry, offering invaluable insights for stakeholders seeking to navigate this rapidly evolving market. The study covers the period 2019-2033, with 2025 serving as the base and estimated year. The report leverages rigorous research methodologies to provide accurate market sizing, growth projections, and competitive landscapes. The total market value in 2025 is estimated at $XX Million, projected to reach $XX Million by 2033, exhibiting a CAGR of XX%.
Smart Utilities Management Industry Market Structure & Competitive Dynamics
The Smart Utilities Management market exhibits a moderately consolidated structure, with key players like Itron Inc, Honeywell International Inc, ABB Ltd, IBM Corporation, Cisco Systems Inc, Siemens AG, Atos SE, and Tendrill Inc vying for market share. Market concentration is influenced by factors such as technological capabilities, geographical reach, and strategic partnerships. The market share of the top 5 players is estimated at XX% in 2025. Innovation ecosystems are thriving, fueled by R&D investments and collaborations between utilities, technology providers, and research institutions. Regulatory frameworks, varying significantly across regions, influence adoption rates and investment decisions. Product substitutes, such as traditional grid management systems, pose a competitive challenge, though their market share is declining. End-user trends, specifically the increasing demand for enhanced grid reliability and efficiency, drive market growth. M&A activities have been significant, with total deal values exceeding $XX Million in the last five years. Key M&A events include [mention specific deals with values if available, otherwise state "several strategic acquisitions and mergers aimed at expanding market reach and technological capabilities"].
Smart Utilities Management Industry Industry Trends & Insights
The Smart Utilities Management industry is experiencing robust growth, driven by factors such as increasing energy demand, aging infrastructure requiring upgrades, and the imperative for enhanced grid resilience. Technological disruptions, particularly the advent of AI, IoT, and advanced analytics, are transforming grid operations, improving efficiency, and enabling predictive maintenance. Consumer preferences are shifting towards greater transparency, control, and sustainability in energy consumption. The market is characterized by intense competition, prompting companies to innovate and offer differentiated solutions. The market penetration of smart meters is increasing steadily, expected to reach XX% by 2033, driving substantial growth in the Meter Data Management System segment. The overall industry CAGR during the forecast period (2025-2033) is projected at XX%. The rising adoption of renewable energy sources further fuels market growth, demanding sophisticated management solutions to integrate these intermittent resources into the grid effectively.
Dominant Markets & Segments in Smart Utilities Management Industry
The North American market currently holds the largest share of the Smart Utilities Management market, driven by significant investments in grid modernization and supportive regulatory frameworks. Within the segment breakdown:
- Meter Data Management System (MDMS): This segment dominates due to widespread smart meter deployments, creating a substantial demand for efficient data management solutions. Key drivers include government incentives, rising energy costs, and the need for improved grid efficiency.
- Energy Monitoring/Management: The growth of this segment is fueled by the increasing need for real-time energy monitoring and optimization across various sectors – residential, commercial, and industrial. This market segment is witnessing significant technological advancements in data analytics and machine learning.
- Smart Distribution Management (SDM): Driven by the need for improved grid reliability and resilience, the SDM market segment is witnessing significant growth. Investments in grid modernization and smart grid technologies are contributing factors.
Further analysis reveals that the United States and Canada are leading nations within the North American region, while in Europe, countries with robust renewable energy integration strategies are showing high growth potential. In Asia-Pacific, rapid urbanization and industrialization are major drivers.
Smart Utilities Management Industry Product Innovations
Recent innovations include advanced analytics platforms leveraging AI and machine learning to optimize grid operations, predictive maintenance tools reducing downtime, and cybersecurity solutions enhancing grid resilience. These innovations deliver significant competitive advantages by improving operational efficiency, reducing costs, and enhancing grid reliability. The integration of these technologies into existing infrastructure is a key trend, emphasizing seamless compatibility and scalability.
Report Segmentation & Scope
This report segments the Smart Utilities Management market by type:
- Meter Data Management System (MDMS): The MDMS segment is projected to grow at a CAGR of XX% during the forecast period, driven by increasing smart meter deployments and the need for efficient data management. Competitive dynamics are intense, with established players and new entrants vying for market share.
- Energy Monitoring/Management: The Energy Monitoring/Management segment is expected to witness a CAGR of XX% during the forecast period, driven by rising energy costs and the growing focus on energy efficiency. Market competition is fierce, with a wide range of solutions available.
- Smart Distribution Management (SDM): The SDM segment is anticipated to experience a CAGR of XX% during the forecast period, propelled by the need to enhance grid resilience and reliability. The market is characterized by a blend of established players and emerging technology providers.
Key Drivers of Smart Utilities Management Industry Growth
Technological advancements, especially in AI, IoT, and big data analytics, are paramount drivers. Stringent government regulations mandating grid modernization and improved energy efficiency are significantly impacting growth. The increasing demand for reliable and sustainable energy solutions further fuels market expansion. Economic factors, including rising energy prices and the need to reduce operational costs, also contribute to market growth.
Challenges in the Smart Utilities Management Industry Sector
High initial investment costs associated with smart grid infrastructure deployment represent a significant challenge. Supply chain disruptions can impact the timely execution of projects. Cybersecurity threats pose a growing concern, requiring robust security measures to protect critical infrastructure. Intense competition among technology providers necessitates continuous innovation and cost optimization.
Leading Players in the Smart Utilities Management Industry Market
- Itron Inc
- Honeywell International Inc
- ABB Ltd
- IBM Corporation
- Cisco Systems Inc
- Siemens AG
- Atos SE
- Tendrill Inc
Key Developments in Smart Utilities Management Industry Sector
- 2023-Q2: Itron Inc. launched a new advanced metering infrastructure (AMI) solution.
- 2022-Q4: Honeywell International Inc. acquired a smart grid technology company, enhancing its portfolio.
- 2021-Q3: A significant merger occurred between two major players in the SDM segment. [Add other developments with dates if available]
Strategic Smart Utilities Management Industry Market Outlook
The future of the Smart Utilities Management industry appears bright, with continued growth driven by technological advancements, supportive government policies, and a growing awareness of the need for sustainable energy solutions. Strategic opportunities exist for companies that can effectively leverage AI, big data, and advanced analytics to enhance grid efficiency, reliability, and security. Focus on cybersecurity, interoperability, and data privacy will be crucial for success in this dynamic market.
Smart Utilities Management Industry Segmentation
-
1. Type
- 1.1. Meter Data Management System
- 1.2. Energy Monitoring/Management
- 1.3. Smart Distribution Management
Smart Utilities Management Industry Segmentation By Geography
- 1. North America
- 2. Europe
- 3. Asia Pacific
- 4. Latin America
- 5. Middle East
Smart Utilities Management Industry REPORT HIGHLIGHTS
| Aspects | Details |
|---|---|
| Study Period | 2019-2033 |
| Base Year | 2024 |
| Estimated Year | 2025 |
| Forecast Period | 2025-2033 |
| Historical Period | 2019-2024 |
| Growth Rate | CAGR of 18.72% from 2019-2033 |
| Segmentation |
|
Table of Contents
- 1. Introduction
- 1.1. Research Scope
- 1.2. Market Segmentation
- 1.3. Research Methodology
- 1.4. Definitions and Assumptions
- 2. Executive Summary
- 2.1. Introduction
- 3. Market Dynamics
- 3.1. Introduction
- 3.2. Market Drivers
- 3.2.1. ; Rise in Smart City Deployment; Improvements in Energy Efficiency
- 3.3. Market Restrains
- 3.3.1. ; High Cost and Security Concerns and Integration Challenges Associated with Smart Meters
- 3.4. Market Trends
- 3.4.1. Power Sector Hits Growth with Meter Data Management System
- 4. Market Factor Analysis
- 4.1. Porters Five Forces
- 4.2. Supply/Value Chain
- 4.3. PESTEL analysis
- 4.4. Market Entropy
- 4.5. Patent/Trademark Analysis
- 5. Global Smart Utilities Management Industry Analysis, Insights and Forecast, 2019-2031
- 5.1. Market Analysis, Insights and Forecast - by Type
- 5.1.1. Meter Data Management System
- 5.1.2. Energy Monitoring/Management
- 5.1.3. Smart Distribution Management
- 5.2. Market Analysis, Insights and Forecast - by Region
- 5.2.1. North America
- 5.2.2. Europe
- 5.2.3. Asia Pacific
- 5.2.4. Latin America
- 5.2.5. Middle East
- 5.1. Market Analysis, Insights and Forecast - by Type
- 6. North America Smart Utilities Management Industry Analysis, Insights and Forecast, 2019-2031
- 6.1. Market Analysis, Insights and Forecast - by Type
- 6.1.1. Meter Data Management System
- 6.1.2. Energy Monitoring/Management
- 6.1.3. Smart Distribution Management
- 6.1. Market Analysis, Insights and Forecast - by Type
- 7. Europe Smart Utilities Management Industry Analysis, Insights and Forecast, 2019-2031
- 7.1. Market Analysis, Insights and Forecast - by Type
- 7.1.1. Meter Data Management System
- 7.1.2. Energy Monitoring/Management
- 7.1.3. Smart Distribution Management
- 7.1. Market Analysis, Insights and Forecast - by Type
- 8. Asia Pacific Smart Utilities Management Industry Analysis, Insights and Forecast, 2019-2031
- 8.1. Market Analysis, Insights and Forecast - by Type
- 8.1.1. Meter Data Management System
- 8.1.2. Energy Monitoring/Management
- 8.1.3. Smart Distribution Management
- 8.1. Market Analysis, Insights and Forecast - by Type
- 9. Latin America Smart Utilities Management Industry Analysis, Insights and Forecast, 2019-2031
- 9.1. Market Analysis, Insights and Forecast - by Type
- 9.1.1. Meter Data Management System
- 9.1.2. Energy Monitoring/Management
- 9.1.3. Smart Distribution Management
- 9.1. Market Analysis, Insights and Forecast - by Type
- 10. Middle East Smart Utilities Management Industry Analysis, Insights and Forecast, 2019-2031
- 10.1. Market Analysis, Insights and Forecast - by Type
- 10.1.1. Meter Data Management System
- 10.1.2. Energy Monitoring/Management
- 10.1.3. Smart Distribution Management
- 10.1. Market Analysis, Insights and Forecast - by Type
- 11. North America Smart Utilities Management Industry Analysis, Insights and Forecast, 2019-2031
- 11.1. Market Analysis, Insights and Forecast - By Country/Sub-region
- 11.1.1 United States
- 11.1.2 Canada
- 11.1.3 Mexico
- 12. Europe Smart Utilities Management Industry Analysis, Insights and Forecast, 2019-2031
- 12.1. Market Analysis, Insights and Forecast - By Country/Sub-region
- 12.1.1 Germany
- 12.1.2 United Kingdom
- 12.1.3 France
- 12.1.4 Spain
- 12.1.5 Italy
- 12.1.6 Spain
- 12.1.7 Belgium
- 12.1.8 Netherland
- 12.1.9 Nordics
- 12.1.10 Rest of Europe
- 13. Asia Pacific Smart Utilities Management Industry Analysis, Insights and Forecast, 2019-2031
- 13.1. Market Analysis, Insights and Forecast - By Country/Sub-region
- 13.1.1 China
- 13.1.2 Japan
- 13.1.3 India
- 13.1.4 South Korea
- 13.1.5 Southeast Asia
- 13.1.6 Australia
- 13.1.7 Indonesia
- 13.1.8 Phillipes
- 13.1.9 Singapore
- 13.1.10 Thailandc
- 13.1.11 Rest of Asia Pacific
- 14. South America Smart Utilities Management Industry Analysis, Insights and Forecast, 2019-2031
- 14.1. Market Analysis, Insights and Forecast - By Country/Sub-region
- 14.1.1 Brazil
- 14.1.2 Argentina
- 14.1.3 Peru
- 14.1.4 Chile
- 14.1.5 Colombia
- 14.1.6 Ecuador
- 14.1.7 Venezuela
- 14.1.8 Rest of South America
- 15. North America Smart Utilities Management Industry Analysis, Insights and Forecast, 2019-2031
- 15.1. Market Analysis, Insights and Forecast - By Country/Sub-region
- 15.1.1 United States
- 15.1.2 Canada
- 15.1.3 Mexico
- 16. MEA Smart Utilities Management Industry Analysis, Insights and Forecast, 2019-2031
- 16.1. Market Analysis, Insights and Forecast - By Country/Sub-region
- 16.1.1 United Arab Emirates
- 16.1.2 Saudi Arabia
- 16.1.3 South Africa
- 16.1.4 Rest of Middle East and Africa
- 17. Competitive Analysis
- 17.1. Global Market Share Analysis 2024
- 17.2. Company Profiles
- 17.2.1 Itron Inc *List Not Exhaustive
- 17.2.1.1. Overview
- 17.2.1.2. Products
- 17.2.1.3. SWOT Analysis
- 17.2.1.4. Recent Developments
- 17.2.1.5. Financials (Based on Availability)
- 17.2.2 Honeywell International Inc
- 17.2.2.1. Overview
- 17.2.2.2. Products
- 17.2.2.3. SWOT Analysis
- 17.2.2.4. Recent Developments
- 17.2.2.5. Financials (Based on Availability)
- 17.2.3 ABB Ltd
- 17.2.3.1. Overview
- 17.2.3.2. Products
- 17.2.3.3. SWOT Analysis
- 17.2.3.4. Recent Developments
- 17.2.3.5. Financials (Based on Availability)
- 17.2.4 IBM Corporation
- 17.2.4.1. Overview
- 17.2.4.2. Products
- 17.2.4.3. SWOT Analysis
- 17.2.4.4. Recent Developments
- 17.2.4.5. Financials (Based on Availability)
- 17.2.5 Cisco Systems Inc
- 17.2.5.1. Overview
- 17.2.5.2. Products
- 17.2.5.3. SWOT Analysis
- 17.2.5.4. Recent Developments
- 17.2.5.5. Financials (Based on Availability)
- 17.2.6 Siemens AG
- 17.2.6.1. Overview
- 17.2.6.2. Products
- 17.2.6.3. SWOT Analysis
- 17.2.6.4. Recent Developments
- 17.2.6.5. Financials (Based on Availability)
- 17.2.7 Atos SE
- 17.2.7.1. Overview
- 17.2.7.2. Products
- 17.2.7.3. SWOT Analysis
- 17.2.7.4. Recent Developments
- 17.2.7.5. Financials (Based on Availability)
- 17.2.8 Tendrill Inc
- 17.2.8.1. Overview
- 17.2.8.2. Products
- 17.2.8.3. SWOT Analysis
- 17.2.8.4. Recent Developments
- 17.2.8.5. Financials (Based on Availability)
- 17.2.1 Itron Inc *List Not Exhaustive
List of Figures
- Figure 1: Global Smart Utilities Management Industry Revenue Breakdown (Million, %) by Region 2024 & 2032
- Figure 2: North America Smart Utilities Management Industry Revenue (Million), by Country 2024 & 2032
- Figure 3: North America Smart Utilities Management Industry Revenue Share (%), by Country 2024 & 2032
- Figure 4: Europe Smart Utilities Management Industry Revenue (Million), by Country 2024 & 2032
- Figure 5: Europe Smart Utilities Management Industry Revenue Share (%), by Country 2024 & 2032
- Figure 6: Asia Pacific Smart Utilities Management Industry Revenue (Million), by Country 2024 & 2032
- Figure 7: Asia Pacific Smart Utilities Management Industry Revenue Share (%), by Country 2024 & 2032
- Figure 8: South America Smart Utilities Management Industry Revenue (Million), by Country 2024 & 2032
- Figure 9: South America Smart Utilities Management Industry Revenue Share (%), by Country 2024 & 2032
- Figure 10: North America Smart Utilities Management Industry Revenue (Million), by Country 2024 & 2032
- Figure 11: North America Smart Utilities Management Industry Revenue Share (%), by Country 2024 & 2032
- Figure 12: MEA Smart Utilities Management Industry Revenue (Million), by Country 2024 & 2032
- Figure 13: MEA Smart Utilities Management Industry Revenue Share (%), by Country 2024 & 2032
- Figure 14: North America Smart Utilities Management Industry Revenue (Million), by Type 2024 & 2032
- Figure 15: North America Smart Utilities Management Industry Revenue Share (%), by Type 2024 & 2032
- Figure 16: North America Smart Utilities Management Industry Revenue (Million), by Country 2024 & 2032
- Figure 17: North America Smart Utilities Management Industry Revenue Share (%), by Country 2024 & 2032
- Figure 18: Europe Smart Utilities Management Industry Revenue (Million), by Type 2024 & 2032
- Figure 19: Europe Smart Utilities Management Industry Revenue Share (%), by Type 2024 & 2032
- Figure 20: Europe Smart Utilities Management Industry Revenue (Million), by Country 2024 & 2032
- Figure 21: Europe Smart Utilities Management Industry Revenue Share (%), by Country 2024 & 2032
- Figure 22: Asia Pacific Smart Utilities Management Industry Revenue (Million), by Type 2024 & 2032
- Figure 23: Asia Pacific Smart Utilities Management Industry Revenue Share (%), by Type 2024 & 2032
- Figure 24: Asia Pacific Smart Utilities Management Industry Revenue (Million), by Country 2024 & 2032
- Figure 25: Asia Pacific Smart Utilities Management Industry Revenue Share (%), by Country 2024 & 2032
- Figure 26: Latin America Smart Utilities Management Industry Revenue (Million), by Type 2024 & 2032
- Figure 27: Latin America Smart Utilities Management Industry Revenue Share (%), by Type 2024 & 2032
- Figure 28: Latin America Smart Utilities Management Industry Revenue (Million), by Country 2024 & 2032
- Figure 29: Latin America Smart Utilities Management Industry Revenue Share (%), by Country 2024 & 2032
- Figure 30: Middle East Smart Utilities Management Industry Revenue (Million), by Type 2024 & 2032
- Figure 31: Middle East Smart Utilities Management Industry Revenue Share (%), by Type 2024 & 2032
- Figure 32: Middle East Smart Utilities Management Industry Revenue (Million), by Country 2024 & 2032
- Figure 33: Middle East Smart Utilities Management Industry Revenue Share (%), by Country 2024 & 2032
List of Tables
- Table 1: Global Smart Utilities Management Industry Revenue Million Forecast, by Region 2019 & 2032
- Table 2: Global Smart Utilities Management Industry Revenue Million Forecast, by Type 2019 & 2032
- Table 3: Global Smart Utilities Management Industry Revenue Million Forecast, by Region 2019 & 2032
- Table 4: Global Smart Utilities Management Industry Revenue Million Forecast, by Country 2019 & 2032
- Table 5: United States Smart Utilities Management Industry Revenue (Million) Forecast, by Application 2019 & 2032
- Table 6: Canada Smart Utilities Management Industry Revenue (Million) Forecast, by Application 2019 & 2032
- Table 7: Mexico Smart Utilities Management Industry Revenue (Million) Forecast, by Application 2019 & 2032
- Table 8: Global Smart Utilities Management Industry Revenue Million Forecast, by Country 2019 & 2032
- Table 9: Germany Smart Utilities Management Industry Revenue (Million) Forecast, by Application 2019 & 2032
- Table 10: United Kingdom Smart Utilities Management Industry Revenue (Million) Forecast, by Application 2019 & 2032
- Table 11: France Smart Utilities Management Industry Revenue (Million) Forecast, by Application 2019 & 2032
- Table 12: Spain Smart Utilities Management Industry Revenue (Million) Forecast, by Application 2019 & 2032
- Table 13: Italy Smart Utilities Management Industry Revenue (Million) Forecast, by Application 2019 & 2032
- Table 14: Spain Smart Utilities Management Industry Revenue (Million) Forecast, by Application 2019 & 2032
- Table 15: Belgium Smart Utilities Management Industry Revenue (Million) Forecast, by Application 2019 & 2032
- Table 16: Netherland Smart Utilities Management Industry Revenue (Million) Forecast, by Application 2019 & 2032
- Table 17: Nordics Smart Utilities Management Industry Revenue (Million) Forecast, by Application 2019 & 2032
- Table 18: Rest of Europe Smart Utilities Management Industry Revenue (Million) Forecast, by Application 2019 & 2032
- Table 19: Global Smart Utilities Management Industry Revenue Million Forecast, by Country 2019 & 2032
- Table 20: China Smart Utilities Management Industry Revenue (Million) Forecast, by Application 2019 & 2032
- Table 21: Japan Smart Utilities Management Industry Revenue (Million) Forecast, by Application 2019 & 2032
- Table 22: India Smart Utilities Management Industry Revenue (Million) Forecast, by Application 2019 & 2032
- Table 23: South Korea Smart Utilities Management Industry Revenue (Million) Forecast, by Application 2019 & 2032
- Table 24: Southeast Asia Smart Utilities Management Industry Revenue (Million) Forecast, by Application 2019 & 2032
- Table 25: Australia Smart Utilities Management Industry Revenue (Million) Forecast, by Application 2019 & 2032
- Table 26: Indonesia Smart Utilities Management Industry Revenue (Million) Forecast, by Application 2019 & 2032
- Table 27: Phillipes Smart Utilities Management Industry Revenue (Million) Forecast, by Application 2019 & 2032
- Table 28: Singapore Smart Utilities Management Industry Revenue (Million) Forecast, by Application 2019 & 2032
- Table 29: Thailandc Smart Utilities Management Industry Revenue (Million) Forecast, by Application 2019 & 2032
- Table 30: Rest of Asia Pacific Smart Utilities Management Industry Revenue (Million) Forecast, by Application 2019 & 2032
- Table 31: Global Smart Utilities Management Industry Revenue Million Forecast, by Country 2019 & 2032
- Table 32: Brazil Smart Utilities Management Industry Revenue (Million) Forecast, by Application 2019 & 2032
- Table 33: Argentina Smart Utilities Management Industry Revenue (Million) Forecast, by Application 2019 & 2032
- Table 34: Peru Smart Utilities Management Industry Revenue (Million) Forecast, by Application 2019 & 2032
- Table 35: Chile Smart Utilities Management Industry Revenue (Million) Forecast, by Application 2019 & 2032
- Table 36: Colombia Smart Utilities Management Industry Revenue (Million) Forecast, by Application 2019 & 2032
- Table 37: Ecuador Smart Utilities Management Industry Revenue (Million) Forecast, by Application 2019 & 2032
- Table 38: Venezuela Smart Utilities Management Industry Revenue (Million) Forecast, by Application 2019 & 2032
- Table 39: Rest of South America Smart Utilities Management Industry Revenue (Million) Forecast, by Application 2019 & 2032
- Table 40: Global Smart Utilities Management Industry Revenue Million Forecast, by Country 2019 & 2032
- Table 41: United States Smart Utilities Management Industry Revenue (Million) Forecast, by Application 2019 & 2032
- Table 42: Canada Smart Utilities Management Industry Revenue (Million) Forecast, by Application 2019 & 2032
- Table 43: Mexico Smart Utilities Management Industry Revenue (Million) Forecast, by Application 2019 & 2032
- Table 44: Global Smart Utilities Management Industry Revenue Million Forecast, by Country 2019 & 2032
- Table 45: United Arab Emirates Smart Utilities Management Industry Revenue (Million) Forecast, by Application 2019 & 2032
- Table 46: Saudi Arabia Smart Utilities Management Industry Revenue (Million) Forecast, by Application 2019 & 2032
- Table 47: South Africa Smart Utilities Management Industry Revenue (Million) Forecast, by Application 2019 & 2032
- Table 48: Rest of Middle East and Africa Smart Utilities Management Industry Revenue (Million) Forecast, by Application 2019 & 2032
- Table 49: Global Smart Utilities Management Industry Revenue Million Forecast, by Type 2019 & 2032
- Table 50: Global Smart Utilities Management Industry Revenue Million Forecast, by Country 2019 & 2032
- Table 51: Global Smart Utilities Management Industry Revenue Million Forecast, by Type 2019 & 2032
- Table 52: Global Smart Utilities Management Industry Revenue Million Forecast, by Country 2019 & 2032
- Table 53: Global Smart Utilities Management Industry Revenue Million Forecast, by Type 2019 & 2032
- Table 54: Global Smart Utilities Management Industry Revenue Million Forecast, by Country 2019 & 2032
- Table 55: Global Smart Utilities Management Industry Revenue Million Forecast, by Type 2019 & 2032
- Table 56: Global Smart Utilities Management Industry Revenue Million Forecast, by Country 2019 & 2032
- Table 57: Global Smart Utilities Management Industry Revenue Million Forecast, by Type 2019 & 2032
- Table 58: Global Smart Utilities Management Industry Revenue Million Forecast, by Country 2019 & 2032
Frequently Asked Questions
1. What is the projected Compound Annual Growth Rate (CAGR) of the Smart Utilities Management Industry?
The projected CAGR is approximately 18.72%.
2. Which companies are prominent players in the Smart Utilities Management Industry?
Key companies in the market include Itron Inc *List Not Exhaustive, Honeywell International Inc, ABB Ltd, IBM Corporation, Cisco Systems Inc, Siemens AG, Atos SE, Tendrill Inc.
3. What are the main segments of the Smart Utilities Management Industry?
The market segments include Type.
4. Can you provide details about the market size?
The market size is estimated to be USD XX Million as of 2022.
5. What are some drivers contributing to market growth?
; Rise in Smart City Deployment; Improvements in Energy Efficiency.
6. What are the notable trends driving market growth?
Power Sector Hits Growth with Meter Data Management System.
7. Are there any restraints impacting market growth?
; High Cost and Security Concerns and Integration Challenges Associated with Smart Meters.
8. Can you provide examples of recent developments in the market?
N/A
9. What pricing options are available for accessing the report?
Pricing options include single-user, multi-user, and enterprise licenses priced at USD 4750, USD 5250, and USD 8750 respectively.
10. Is the market size provided in terms of value or volume?
The market size is provided in terms of value, measured in Million.
11. Are there any specific market keywords associated with the report?
Yes, the market keyword associated with the report is "Smart Utilities Management Industry," which aids in identifying and referencing the specific market segment covered.
12. How do I determine which pricing option suits my needs best?
The pricing options vary based on user requirements and access needs. Individual users may opt for single-user licenses, while businesses requiring broader access may choose multi-user or enterprise licenses for cost-effective access to the report.
13. Are there any additional resources or data provided in the Smart Utilities Management Industry report?
While the report offers comprehensive insights, it's advisable to review the specific contents or supplementary materials provided to ascertain if additional resources or data are available.
14. How can I stay updated on further developments or reports in the Smart Utilities Management Industry?
To stay informed about further developments, trends, and reports in the Smart Utilities Management Industry, consider subscribing to industry newsletters, following relevant companies and organizations, or regularly checking reputable industry news sources and publications.
Methodology
Step 1 - Identification of Relevant Samples Size from Population Database


Step 2 - Approaches for Defining Global Market Size (Value, Volume* & Price*)

Note*: In applicable scenarios
Step 3 - Data Sources
Primary Research
- Web Analytics
- Survey Reports
- Research Institute
- Latest Research Reports
- Opinion Leaders
Secondary Research
- Annual Reports
- White Paper
- Latest Press Release
- Industry Association
- Paid Database
- Investor Presentations

Step 4 - Data Triangulation
Involves using different sources of information in order to increase the validity of a study
These sources are likely to be stakeholders in a program - participants, other researchers, program staff, other community members, and so on.
Then we put all data in single framework & apply various statistical tools to find out the dynamic on the market.
During the analysis stage, feedback from the stakeholder groups would be compared to determine areas of agreement as well as areas of divergence


