
Key Insights
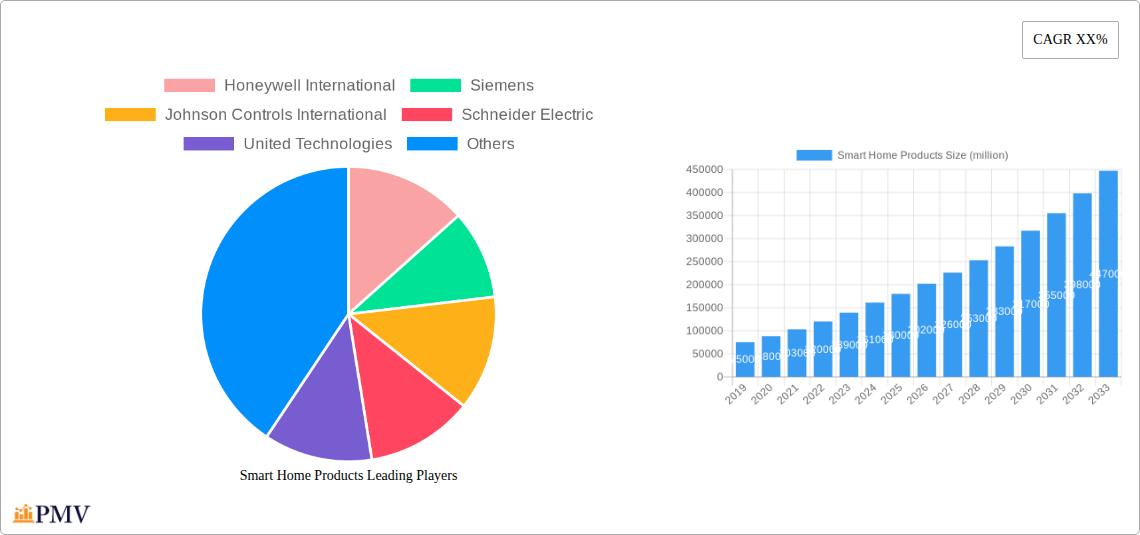
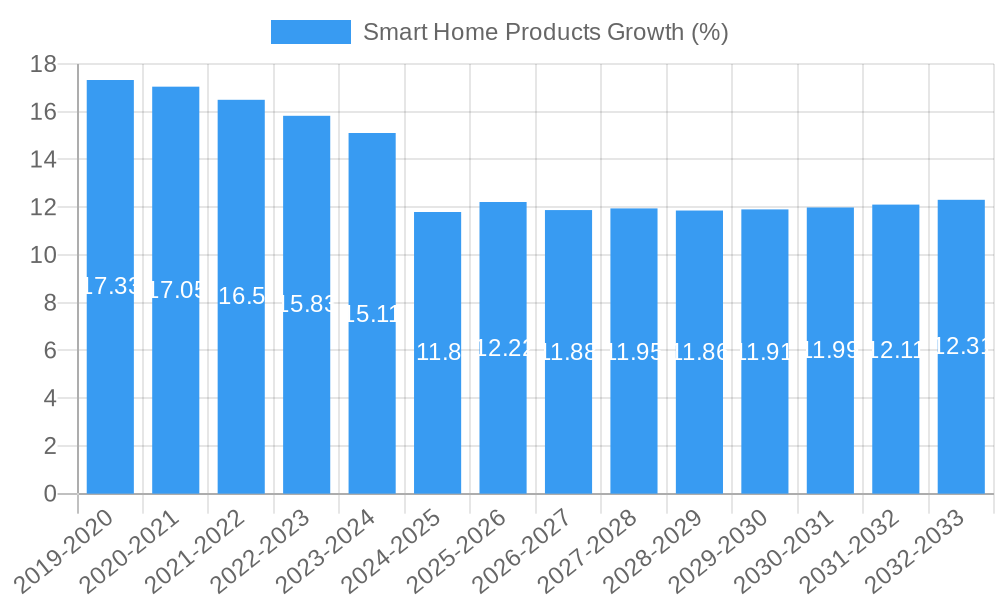
The global smart home products market is poised for significant expansion, projected to reach a valuation of approximately $180 billion by 2025. This robust growth trajectory is underpinned by a Compound Annual Growth Rate (CAGR) of around 15% anticipated over the forecast period of 2025-2033. Key drivers fueling this surge include the increasing consumer demand for enhanced convenience, security, and energy efficiency in residential settings. The proliferation of Internet of Things (IoT) devices, coupled with advancements in artificial intelligence and voice assistant technology, is further accelerating adoption. The market is segmented by application into Entertainment, Health, Security, and others, with Security and Entertainment applications currently leading in adoption rates due to their tangible benefits in safeguarding homes and enhancing lifestyle. Hardware devices, ranging from smart thermostats and lighting to security cameras and smart speakers, form the backbone of this ecosystem, while software systems provide the intelligent integration and control necessary for a seamless smart home experience.
The market's expansion is further bolstered by evolving consumer lifestyles and a growing awareness of the potential for smart home technology to improve quality of life and reduce operational costs. The rising disposable incomes in emerging economies, coupled with increasing urbanization, are creating fertile ground for smart home product penetration. Prominent companies like Honeywell International, Siemens, Johnson Controls International, Amazon, Apple, and Google are heavily investing in research and development, introducing innovative products and expanding their market reach. However, challenges such as data privacy concerns, interoperability issues between different smart home ecosystems, and the initial cost of adoption for some consumers may pose restraints. Despite these hurdles, the overarching trend towards connected living and the demonstrable benefits offered by smart home solutions indicate a dynamic and promising future for the industry.
This in-depth market research report provides a detailed examination of the global Smart Home Products market, offering critical insights for industry stakeholders. Covering the historical period from 2019 to 2024, a base year of 2025, and a forecast period extending from 2025 to 2033, this study is an essential resource for understanding market dynamics, identifying growth opportunities, and navigating competitive landscapes. The report leverages advanced analytical techniques to deliver actionable intelligence on market size, trends, segmentation, and future outlook.
Smart Home Products Market Structure & Competitive Dynamics
The global smart home products market exhibits a dynamic structure characterized by a mix of established conglomerates and innovative startups. Market concentration is moderate, with key players like Honeywell International, Siemens, Johnson Controls International, Schneider Electric, United Technologies, Amazon, Apple, and Google holding significant market shares. The innovation ecosystem thrives on rapid technological advancements, particularly in AI, IoT, and cloud computing, driving the development of sophisticated hardware devices and software systems. Regulatory frameworks, while evolving to address data privacy and security concerns, play a crucial role in shaping market entry and product standards. Product substitutes, such as traditional home automation systems and individual smart devices, are increasingly being integrated into comprehensive smart home ecosystems. End-user trends are heavily influenced by growing consumer demand for convenience, security, energy efficiency, and entertainment. Mergers and acquisitions (M&A) activities are prevalent, with substantial deal values often in the hundreds of millions to billions of dollars, as companies seek to expand their product portfolios, market reach, and technological capabilities. Recent M&A activities have been valued at approximately $500 million to $2 billion, reflecting the consolidation and strategic partnerships shaping the industry.
Smart Home Products Industry Trends & Insights
The smart home products industry is poised for robust growth, driven by several compelling trends and insights. A primary growth driver is the escalating consumer adoption of connected devices, fueled by increased disposable incomes and a growing awareness of the benefits offered by smart home technology. The market penetration of smart home devices is projected to reach over 60% in developed economies by 2030. Technological disruptions, including advancements in artificial intelligence (AI) for predictive analytics, the proliferation of the Internet of Things (IoT) for seamless device connectivity, and the expansion of 5G networks for faster data transmission, are fundamentally reshaping the smart home landscape. Consumer preferences are increasingly leaning towards integrated smart home solutions that offer convenience, enhanced security, energy management, and personalized entertainment experiences. This includes a surge in demand for voice-activated assistants, smart security cameras, intelligent thermostats, and connected entertainment systems. The competitive dynamics are intensifying, with companies investing heavily in research and development to differentiate their offerings and capture market share. The overall compound annual growth rate (CAGR) for the smart home products market is estimated at approximately 15-20% during the forecast period. The integration of machine learning for personalized user experiences and predictive maintenance is also a significant trend. Furthermore, the growing emphasis on sustainability and energy efficiency is driving the adoption of smart energy management systems, contributing to market expansion. The cybersecurity aspect of smart homes is also becoming a critical focus, with consumers demanding robust security features and manufacturers prioritizing data protection. The rising adoption of smart appliances, from refrigerators to washing machines, further diversifies the market.
Dominant Markets & Segments in Smart Home Products
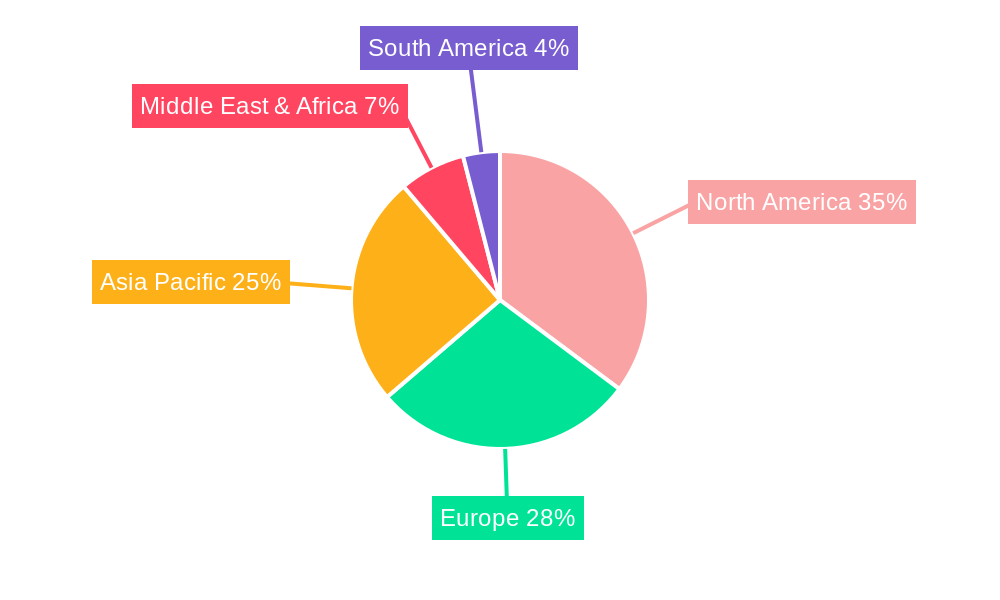
North America currently holds a dominant position in the global smart home products market, driven by high disposable incomes, widespread internet penetration, and early adoption of advanced technologies. The United States, in particular, represents a substantial market share due to the presence of major tech giants like Amazon, Apple, and Google, alongside established players such as Honeywell International and ADT. Key drivers for this dominance include supportive economic policies that encourage technological innovation, robust digital infrastructure, and a consumer base that readily embraces new gadgets and connected living. The Security segment within the Application category is particularly strong, with a market size estimated to be over $20 billion, fueled by increasing concerns about personal safety and property protection. The Types segment is dominated by Hardware Devices, accounting for approximately 70% of the market revenue, reflecting the foundational nature of physical devices in smart home ecosystems. However, the Software System segment is experiencing rapid growth, with a projected CAGR of over 20%, as sophisticated control platforms and AI-driven analytics become increasingly critical.
- Leading Region: North America, driven by the United States.
- Key Drivers: High disposable income, advanced digital infrastructure, strong R&D investments, and consumer acceptance of smart technologies.
- Dominant Application Segment: Security.
- Key Drivers: Heightened consumer awareness of safety, availability of advanced smart surveillance and alarm systems, and integration with emergency services.
- Dominant Type Segment: Hardware Devices.
- Key Drivers: Essential for core functionality, broad range of product categories (sensors, cameras, hubs, actuators), and continuous innovation in device capabilities.
- Emerging Application Segment: Health.
- Key Drivers: Aging populations, increasing health consciousness, and the development of remote patient monitoring and wellness tracking devices.
- Rapidly Growing Type Segment: Software System.
- Key Drivers: Enhanced user experience, advanced analytics, AI integration, remote control capabilities, and platform interoperability.
Smart Home Products Product Innovations
Product innovation in the smart home sector is characterized by the development of intuitive, interconnected, and AI-powered devices. Key advancements include the integration of machine learning for personalized user experiences, predictive maintenance for appliances, and enhanced energy management capabilities. Innovations in voice recognition technology from companies like Amazon and Apple are driving seamless interaction with smart home systems. Security products are seeing advancements in facial recognition and anomaly detection. The development of interoperable software systems is crucial, enabling devices from different manufacturers to communicate effectively. These innovations provide competitive advantages by enhancing user convenience, security, and energy efficiency, leading to increased market adoption.
Report Segmentation & Scope
This comprehensive report segments the smart home products market by Application and Type. The Application segments include Entertainment, Health, and Security. The Entertainment segment encompasses smart TVs, audio systems, and gaming consoles, with projected market growth driven by advancements in immersive media experiences. The Health segment focuses on wearable health trackers, smart medical devices, and home-based healthcare solutions, with significant potential due to an aging global population and increasing health awareness. The Security segment covers smart locks, cameras, alarm systems, and sensors, which continue to be a primary driver of smart home adoption. The Types segments include Hardware Devices and Software Systems. Hardware Devices, the foundational component, includes a wide array of physical products like smart thermostats, lighting, appliances, and more. Software Systems encompass operating platforms, mobile applications, and cloud-based services that enable control, automation, and data analysis. Growth projections for each segment are detailed within the report, along with their respective market sizes and competitive dynamics.
Key Drivers of Smart Home Products Growth
The smart home products sector is propelled by a confluence of powerful growth drivers. Technological advancements, particularly in Artificial Intelligence (AI) and the Internet of Things (IoT), are enabling more sophisticated, interconnected, and intuitive smart home experiences. Economic factors such as increasing disposable incomes and a growing middle class in emerging economies are expanding the addressable market. Government initiatives promoting energy efficiency and smart city development also contribute to market expansion. The escalating consumer demand for convenience, security, and energy savings, coupled with the increasing prevalence of home automation and connected devices in daily life, are fundamental drivers. Furthermore, the declining cost of smart devices and the rise of interoperable platforms are lowering adoption barriers.
Challenges in the Smart Home Products Sector
Despite its promising growth, the smart home products sector faces several significant challenges. Regulatory hurdles related to data privacy and cybersecurity are evolving and can impact product development and deployment timelines. Supply chain disruptions, as witnessed in recent years, can affect the availability and cost of critical components, impacting production volumes. Intense competitive pressures from both established players and new entrants necessitate continuous innovation and aggressive pricing strategies. Consumer concerns regarding the complexity of installation and setup, as well as interoperability issues between different brands, also present barriers to widespread adoption. The cost of initial investment for comprehensive smart home systems remains a restraint for some consumer segments.
Leading Players in the Smart Home Products Market
- Honeywell International
- Siemens
- Johnson Controls International
- Schneider Electric
- United Technologies
- Amazon
- Apple
- ADT
- Robert Bosch
- Assa Abloy
- Legrand
- ABB
- Ingersoll-Rand
- Comcast
- Hubbell
- Vivint
Key Developments in Smart Home Products Sector
- 2024 January: Apple announces enhanced HomeKit integration, improving cross-device compatibility and user experience.
- 2023 October: Google expands its Nest lineup with new AI-powered security cameras offering advanced threat detection features.
- 2023 July: Amazon introduces a new line of Eero Wi-Fi 7 routers, promising faster speeds and more reliable connectivity for smart homes.
- 2022 December: Siemens showcases its latest advancements in smart energy management systems for residential applications, focusing on sustainability and cost savings.
- 2021 November: Johnson Controls International launches an updated building automation platform with integrated smart home functionalities.
- 2020 September: Honeywell International unveils a new range of smart thermostats with improved learning algorithms for optimal energy efficiency.
Strategic Smart Home Products Market Outlook
The strategic outlook for the smart home products market is exceptionally positive, characterized by sustained growth accelerators. The increasing demand for integrated, AI-driven solutions that enhance convenience, security, and energy efficiency will continue to fuel market expansion. The ongoing development of standards for interoperability will simplify user experiences and encourage wider adoption. Emerging technologies such as Matter protocol are poised to revolutionize device compatibility. Strategic opportunities lie in catering to the growing health and wellness segment, developing more robust cybersecurity measures, and expanding into underserved geographic markets. Partnerships between technology providers, utility companies, and insurance providers will create new revenue streams and service models. The future of smart homes lies in creating truly intuitive, personalized, and seamless living environments.
Smart Home Products Segmentation
-
1. Application
- 1.1. Entertainment
- 1.2. Health
- 1.3. Security
-
2. Types
- 2.1. Hardware Devices
- 2.2. Software System
Smart Home Products Segmentation By Geography
-
1. North America
- 1.1. United States
- 1.2. Canada
- 1.3. Mexico
-
2. South America
- 2.1. Brazil
- 2.2. Argentina
- 2.3. Rest of South America
-
3. Europe
- 3.1. United Kingdom
- 3.2. Germany
- 3.3. France
- 3.4. Italy
- 3.5. Spain
- 3.6. Russia
- 3.7. Benelux
- 3.8. Nordics
- 3.9. Rest of Europe
-
4. Middle East & Africa
- 4.1. Turkey
- 4.2. Israel
- 4.3. GCC
- 4.4. North Africa
- 4.5. South Africa
- 4.6. Rest of Middle East & Africa
-
5. Asia Pacific
- 5.1. China
- 5.2. India
- 5.3. Japan
- 5.4. South Korea
- 5.5. ASEAN
- 5.6. Oceania
- 5.7. Rest of Asia Pacific
Smart Home Products REPORT HIGHLIGHTS
| Aspects | Details |
|---|---|
| Study Period | 2019-2033 |
| Base Year | 2024 |
| Estimated Year | 2025 |
| Forecast Period | 2025-2033 |
| Historical Period | 2019-2024 |
| Growth Rate | CAGR of XX% from 2019-2033 |
| Segmentation |
|
Table of Contents
- 1. Introduction
- 1.1. Research Scope
- 1.2. Market Segmentation
- 1.3. Research Methodology
- 1.4. Definitions and Assumptions
- 2. Executive Summary
- 2.1. Introduction
- 3. Market Dynamics
- 3.1. Introduction
- 3.2. Market Drivers
- 3.3. Market Restrains
- 3.4. Market Trends
- 4. Market Factor Analysis
- 4.1. Porters Five Forces
- 4.2. Supply/Value Chain
- 4.3. PESTEL analysis
- 4.4. Market Entropy
- 4.5. Patent/Trademark Analysis
- 5. Global Smart Home Products Analysis, Insights and Forecast, 2019-2031
- 5.1. Market Analysis, Insights and Forecast - by Application
- 5.1.1. Entertainment
- 5.1.2. Health
- 5.1.3. Security
- 5.2. Market Analysis, Insights and Forecast - by Types
- 5.2.1. Hardware Devices
- 5.2.2. Software System
- 5.3. Market Analysis, Insights and Forecast - by Region
- 5.3.1. North America
- 5.3.2. South America
- 5.3.3. Europe
- 5.3.4. Middle East & Africa
- 5.3.5. Asia Pacific
- 5.1. Market Analysis, Insights and Forecast - by Application
- 6. North America Smart Home Products Analysis, Insights and Forecast, 2019-2031
- 6.1. Market Analysis, Insights and Forecast - by Application
- 6.1.1. Entertainment
- 6.1.2. Health
- 6.1.3. Security
- 6.2. Market Analysis, Insights and Forecast - by Types
- 6.2.1. Hardware Devices
- 6.2.2. Software System
- 6.1. Market Analysis, Insights and Forecast - by Application
- 7. South America Smart Home Products Analysis, Insights and Forecast, 2019-2031
- 7.1. Market Analysis, Insights and Forecast - by Application
- 7.1.1. Entertainment
- 7.1.2. Health
- 7.1.3. Security
- 7.2. Market Analysis, Insights and Forecast - by Types
- 7.2.1. Hardware Devices
- 7.2.2. Software System
- 7.1. Market Analysis, Insights and Forecast - by Application
- 8. Europe Smart Home Products Analysis, Insights and Forecast, 2019-2031
- 8.1. Market Analysis, Insights and Forecast - by Application
- 8.1.1. Entertainment
- 8.1.2. Health
- 8.1.3. Security
- 8.2. Market Analysis, Insights and Forecast - by Types
- 8.2.1. Hardware Devices
- 8.2.2. Software System
- 8.1. Market Analysis, Insights and Forecast - by Application
- 9. Middle East & Africa Smart Home Products Analysis, Insights and Forecast, 2019-2031
- 9.1. Market Analysis, Insights and Forecast - by Application
- 9.1.1. Entertainment
- 9.1.2. Health
- 9.1.3. Security
- 9.2. Market Analysis, Insights and Forecast - by Types
- 9.2.1. Hardware Devices
- 9.2.2. Software System
- 9.1. Market Analysis, Insights and Forecast - by Application
- 10. Asia Pacific Smart Home Products Analysis, Insights and Forecast, 2019-2031
- 10.1. Market Analysis, Insights and Forecast - by Application
- 10.1.1. Entertainment
- 10.1.2. Health
- 10.1.3. Security
- 10.2. Market Analysis, Insights and Forecast - by Types
- 10.2.1. Hardware Devices
- 10.2.2. Software System
- 10.1. Market Analysis, Insights and Forecast - by Application
- 11. Competitive Analysis
- 11.1. Global Market Share Analysis 2024
- 11.2. Company Profiles
- 11.2.1 Honeywell International
- 11.2.1.1. Overview
- 11.2.1.2. Products
- 11.2.1.3. SWOT Analysis
- 11.2.1.4. Recent Developments
- 11.2.1.5. Financials (Based on Availability)
- 11.2.2 Siemens
- 11.2.2.1. Overview
- 11.2.2.2. Products
- 11.2.2.3. SWOT Analysis
- 11.2.2.4. Recent Developments
- 11.2.2.5. Financials (Based on Availability)
- 11.2.3 Johnson Controls International
- 11.2.3.1. Overview
- 11.2.3.2. Products
- 11.2.3.3. SWOT Analysis
- 11.2.3.4. Recent Developments
- 11.2.3.5. Financials (Based on Availability)
- 11.2.4 Schneider Electric
- 11.2.4.1. Overview
- 11.2.4.2. Products
- 11.2.4.3. SWOT Analysis
- 11.2.4.4. Recent Developments
- 11.2.4.5. Financials (Based on Availability)
- 11.2.5 United Technologies
- 11.2.5.1. Overview
- 11.2.5.2. Products
- 11.2.5.3. SWOT Analysis
- 11.2.5.4. Recent Developments
- 11.2.5.5. Financials (Based on Availability)
- 11.2.6 Amazon
- 11.2.6.1. Overview
- 11.2.6.2. Products
- 11.2.6.3. SWOT Analysis
- 11.2.6.4. Recent Developments
- 11.2.6.5. Financials (Based on Availability)
- 11.2.7 Apple
- 11.2.7.1. Overview
- 11.2.7.2. Products
- 11.2.7.3. SWOT Analysis
- 11.2.7.4. Recent Developments
- 11.2.7.5. Financials (Based on Availability)
- 11.2.8 Google
- 11.2.8.1. Overview
- 11.2.8.2. Products
- 11.2.8.3. SWOT Analysis
- 11.2.8.4. Recent Developments
- 11.2.8.5. Financials (Based on Availability)
- 11.2.9 ADT
- 11.2.9.1. Overview
- 11.2.9.2. Products
- 11.2.9.3. SWOT Analysis
- 11.2.9.4. Recent Developments
- 11.2.9.5. Financials (Based on Availability)
- 11.2.10 Robert Bosch
- 11.2.10.1. Overview
- 11.2.10.2. Products
- 11.2.10.3. SWOT Analysis
- 11.2.10.4. Recent Developments
- 11.2.10.5. Financials (Based on Availability)
- 11.2.11 Assa Abloy
- 11.2.11.1. Overview
- 11.2.11.2. Products
- 11.2.11.3. SWOT Analysis
- 11.2.11.4. Recent Developments
- 11.2.11.5. Financials (Based on Availability)
- 11.2.12 Legrand
- 11.2.12.1. Overview
- 11.2.12.2. Products
- 11.2.12.3. SWOT Analysis
- 11.2.12.4. Recent Developments
- 11.2.12.5. Financials (Based on Availability)
- 11.2.13 ABB
- 11.2.13.1. Overview
- 11.2.13.2. Products
- 11.2.13.3. SWOT Analysis
- 11.2.13.4. Recent Developments
- 11.2.13.5. Financials (Based on Availability)
- 11.2.14 Ingersoll-Rand
- 11.2.14.1. Overview
- 11.2.14.2. Products
- 11.2.14.3. SWOT Analysis
- 11.2.14.4. Recent Developments
- 11.2.14.5. Financials (Based on Availability)
- 11.2.15 Comcast
- 11.2.15.1. Overview
- 11.2.15.2. Products
- 11.2.15.3. SWOT Analysis
- 11.2.15.4. Recent Developments
- 11.2.15.5. Financials (Based on Availability)
- 11.2.16 Hubbell
- 11.2.16.1. Overview
- 11.2.16.2. Products
- 11.2.16.3. SWOT Analysis
- 11.2.16.4. Recent Developments
- 11.2.16.5. Financials (Based on Availability)
- 11.2.17 Vivint
- 11.2.17.1. Overview
- 11.2.17.2. Products
- 11.2.17.3. SWOT Analysis
- 11.2.17.4. Recent Developments
- 11.2.17.5. Financials (Based on Availability)
- 11.2.1 Honeywell International
List of Figures
- Figure 1: Global Smart Home Products Revenue Breakdown (million, %) by Region 2024 & 2032
- Figure 2: Global Smart Home Products Volume Breakdown (K, %) by Region 2024 & 2032
- Figure 3: North America Smart Home Products Revenue (million), by Application 2024 & 2032
- Figure 4: North America Smart Home Products Volume (K), by Application 2024 & 2032
- Figure 5: North America Smart Home Products Revenue Share (%), by Application 2024 & 2032
- Figure 6: North America Smart Home Products Volume Share (%), by Application 2024 & 2032
- Figure 7: North America Smart Home Products Revenue (million), by Types 2024 & 2032
- Figure 8: North America Smart Home Products Volume (K), by Types 2024 & 2032
- Figure 9: North America Smart Home Products Revenue Share (%), by Types 2024 & 2032
- Figure 10: North America Smart Home Products Volume Share (%), by Types 2024 & 2032
- Figure 11: North America Smart Home Products Revenue (million), by Country 2024 & 2032
- Figure 12: North America Smart Home Products Volume (K), by Country 2024 & 2032
- Figure 13: North America Smart Home Products Revenue Share (%), by Country 2024 & 2032
- Figure 14: North America Smart Home Products Volume Share (%), by Country 2024 & 2032
- Figure 15: South America Smart Home Products Revenue (million), by Application 2024 & 2032
- Figure 16: South America Smart Home Products Volume (K), by Application 2024 & 2032
- Figure 17: South America Smart Home Products Revenue Share (%), by Application 2024 & 2032
- Figure 18: South America Smart Home Products Volume Share (%), by Application 2024 & 2032
- Figure 19: South America Smart Home Products Revenue (million), by Types 2024 & 2032
- Figure 20: South America Smart Home Products Volume (K), by Types 2024 & 2032
- Figure 21: South America Smart Home Products Revenue Share (%), by Types 2024 & 2032
- Figure 22: South America Smart Home Products Volume Share (%), by Types 2024 & 2032
- Figure 23: South America Smart Home Products Revenue (million), by Country 2024 & 2032
- Figure 24: South America Smart Home Products Volume (K), by Country 2024 & 2032
- Figure 25: South America Smart Home Products Revenue Share (%), by Country 2024 & 2032
- Figure 26: South America Smart Home Products Volume Share (%), by Country 2024 & 2032
- Figure 27: Europe Smart Home Products Revenue (million), by Application 2024 & 2032
- Figure 28: Europe Smart Home Products Volume (K), by Application 2024 & 2032
- Figure 29: Europe Smart Home Products Revenue Share (%), by Application 2024 & 2032
- Figure 30: Europe Smart Home Products Volume Share (%), by Application 2024 & 2032
- Figure 31: Europe Smart Home Products Revenue (million), by Types 2024 & 2032
- Figure 32: Europe Smart Home Products Volume (K), by Types 2024 & 2032
- Figure 33: Europe Smart Home Products Revenue Share (%), by Types 2024 & 2032
- Figure 34: Europe Smart Home Products Volume Share (%), by Types 2024 & 2032
- Figure 35: Europe Smart Home Products Revenue (million), by Country 2024 & 2032
- Figure 36: Europe Smart Home Products Volume (K), by Country 2024 & 2032
- Figure 37: Europe Smart Home Products Revenue Share (%), by Country 2024 & 2032
- Figure 38: Europe Smart Home Products Volume Share (%), by Country 2024 & 2032
- Figure 39: Middle East & Africa Smart Home Products Revenue (million), by Application 2024 & 2032
- Figure 40: Middle East & Africa Smart Home Products Volume (K), by Application 2024 & 2032
- Figure 41: Middle East & Africa Smart Home Products Revenue Share (%), by Application 2024 & 2032
- Figure 42: Middle East & Africa Smart Home Products Volume Share (%), by Application 2024 & 2032
- Figure 43: Middle East & Africa Smart Home Products Revenue (million), by Types 2024 & 2032
- Figure 44: Middle East & Africa Smart Home Products Volume (K), by Types 2024 & 2032
- Figure 45: Middle East & Africa Smart Home Products Revenue Share (%), by Types 2024 & 2032
- Figure 46: Middle East & Africa Smart Home Products Volume Share (%), by Types 2024 & 2032
- Figure 47: Middle East & Africa Smart Home Products Revenue (million), by Country 2024 & 2032
- Figure 48: Middle East & Africa Smart Home Products Volume (K), by Country 2024 & 2032
- Figure 49: Middle East & Africa Smart Home Products Revenue Share (%), by Country 2024 & 2032
- Figure 50: Middle East & Africa Smart Home Products Volume Share (%), by Country 2024 & 2032
- Figure 51: Asia Pacific Smart Home Products Revenue (million), by Application 2024 & 2032
- Figure 52: Asia Pacific Smart Home Products Volume (K), by Application 2024 & 2032
- Figure 53: Asia Pacific Smart Home Products Revenue Share (%), by Application 2024 & 2032
- Figure 54: Asia Pacific Smart Home Products Volume Share (%), by Application 2024 & 2032
- Figure 55: Asia Pacific Smart Home Products Revenue (million), by Types 2024 & 2032
- Figure 56: Asia Pacific Smart Home Products Volume (K), by Types 2024 & 2032
- Figure 57: Asia Pacific Smart Home Products Revenue Share (%), by Types 2024 & 2032
- Figure 58: Asia Pacific Smart Home Products Volume Share (%), by Types 2024 & 2032
- Figure 59: Asia Pacific Smart Home Products Revenue (million), by Country 2024 & 2032
- Figure 60: Asia Pacific Smart Home Products Volume (K), by Country 2024 & 2032
- Figure 61: Asia Pacific Smart Home Products Revenue Share (%), by Country 2024 & 2032
- Figure 62: Asia Pacific Smart Home Products Volume Share (%), by Country 2024 & 2032
List of Tables
- Table 1: Global Smart Home Products Revenue million Forecast, by Region 2019 & 2032
- Table 2: Global Smart Home Products Volume K Forecast, by Region 2019 & 2032
- Table 3: Global Smart Home Products Revenue million Forecast, by Application 2019 & 2032
- Table 4: Global Smart Home Products Volume K Forecast, by Application 2019 & 2032
- Table 5: Global Smart Home Products Revenue million Forecast, by Types 2019 & 2032
- Table 6: Global Smart Home Products Volume K Forecast, by Types 2019 & 2032
- Table 7: Global Smart Home Products Revenue million Forecast, by Region 2019 & 2032
- Table 8: Global Smart Home Products Volume K Forecast, by Region 2019 & 2032
- Table 9: Global Smart Home Products Revenue million Forecast, by Application 2019 & 2032
- Table 10: Global Smart Home Products Volume K Forecast, by Application 2019 & 2032
- Table 11: Global Smart Home Products Revenue million Forecast, by Types 2019 & 2032
- Table 12: Global Smart Home Products Volume K Forecast, by Types 2019 & 2032
- Table 13: Global Smart Home Products Revenue million Forecast, by Country 2019 & 2032
- Table 14: Global Smart Home Products Volume K Forecast, by Country 2019 & 2032
- Table 15: United States Smart Home Products Revenue (million) Forecast, by Application 2019 & 2032
- Table 16: United States Smart Home Products Volume (K) Forecast, by Application 2019 & 2032
- Table 17: Canada Smart Home Products Revenue (million) Forecast, by Application 2019 & 2032
- Table 18: Canada Smart Home Products Volume (K) Forecast, by Application 2019 & 2032
- Table 19: Mexico Smart Home Products Revenue (million) Forecast, by Application 2019 & 2032
- Table 20: Mexico Smart Home Products Volume (K) Forecast, by Application 2019 & 2032
- Table 21: Global Smart Home Products Revenue million Forecast, by Application 2019 & 2032
- Table 22: Global Smart Home Products Volume K Forecast, by Application 2019 & 2032
- Table 23: Global Smart Home Products Revenue million Forecast, by Types 2019 & 2032
- Table 24: Global Smart Home Products Volume K Forecast, by Types 2019 & 2032
- Table 25: Global Smart Home Products Revenue million Forecast, by Country 2019 & 2032
- Table 26: Global Smart Home Products Volume K Forecast, by Country 2019 & 2032
- Table 27: Brazil Smart Home Products Revenue (million) Forecast, by Application 2019 & 2032
- Table 28: Brazil Smart Home Products Volume (K) Forecast, by Application 2019 & 2032
- Table 29: Argentina Smart Home Products Revenue (million) Forecast, by Application 2019 & 2032
- Table 30: Argentina Smart Home Products Volume (K) Forecast, by Application 2019 & 2032
- Table 31: Rest of South America Smart Home Products Revenue (million) Forecast, by Application 2019 & 2032
- Table 32: Rest of South America Smart Home Products Volume (K) Forecast, by Application 2019 & 2032
- Table 33: Global Smart Home Products Revenue million Forecast, by Application 2019 & 2032
- Table 34: Global Smart Home Products Volume K Forecast, by Application 2019 & 2032
- Table 35: Global Smart Home Products Revenue million Forecast, by Types 2019 & 2032
- Table 36: Global Smart Home Products Volume K Forecast, by Types 2019 & 2032
- Table 37: Global Smart Home Products Revenue million Forecast, by Country 2019 & 2032
- Table 38: Global Smart Home Products Volume K Forecast, by Country 2019 & 2032
- Table 39: United Kingdom Smart Home Products Revenue (million) Forecast, by Application 2019 & 2032
- Table 40: United Kingdom Smart Home Products Volume (K) Forecast, by Application 2019 & 2032
- Table 41: Germany Smart Home Products Revenue (million) Forecast, by Application 2019 & 2032
- Table 42: Germany Smart Home Products Volume (K) Forecast, by Application 2019 & 2032
- Table 43: France Smart Home Products Revenue (million) Forecast, by Application 2019 & 2032
- Table 44: France Smart Home Products Volume (K) Forecast, by Application 2019 & 2032
- Table 45: Italy Smart Home Products Revenue (million) Forecast, by Application 2019 & 2032
- Table 46: Italy Smart Home Products Volume (K) Forecast, by Application 2019 & 2032
- Table 47: Spain Smart Home Products Revenue (million) Forecast, by Application 2019 & 2032
- Table 48: Spain Smart Home Products Volume (K) Forecast, by Application 2019 & 2032
- Table 49: Russia Smart Home Products Revenue (million) Forecast, by Application 2019 & 2032
- Table 50: Russia Smart Home Products Volume (K) Forecast, by Application 2019 & 2032
- Table 51: Benelux Smart Home Products Revenue (million) Forecast, by Application 2019 & 2032
- Table 52: Benelux Smart Home Products Volume (K) Forecast, by Application 2019 & 2032
- Table 53: Nordics Smart Home Products Revenue (million) Forecast, by Application 2019 & 2032
- Table 54: Nordics Smart Home Products Volume (K) Forecast, by Application 2019 & 2032
- Table 55: Rest of Europe Smart Home Products Revenue (million) Forecast, by Application 2019 & 2032
- Table 56: Rest of Europe Smart Home Products Volume (K) Forecast, by Application 2019 & 2032
- Table 57: Global Smart Home Products Revenue million Forecast, by Application 2019 & 2032
- Table 58: Global Smart Home Products Volume K Forecast, by Application 2019 & 2032
- Table 59: Global Smart Home Products Revenue million Forecast, by Types 2019 & 2032
- Table 60: Global Smart Home Products Volume K Forecast, by Types 2019 & 2032
- Table 61: Global Smart Home Products Revenue million Forecast, by Country 2019 & 2032
- Table 62: Global Smart Home Products Volume K Forecast, by Country 2019 & 2032
- Table 63: Turkey Smart Home Products Revenue (million) Forecast, by Application 2019 & 2032
- Table 64: Turkey Smart Home Products Volume (K) Forecast, by Application 2019 & 2032
- Table 65: Israel Smart Home Products Revenue (million) Forecast, by Application 2019 & 2032
- Table 66: Israel Smart Home Products Volume (K) Forecast, by Application 2019 & 2032
- Table 67: GCC Smart Home Products Revenue (million) Forecast, by Application 2019 & 2032
- Table 68: GCC Smart Home Products Volume (K) Forecast, by Application 2019 & 2032
- Table 69: North Africa Smart Home Products Revenue (million) Forecast, by Application 2019 & 2032
- Table 70: North Africa Smart Home Products Volume (K) Forecast, by Application 2019 & 2032
- Table 71: South Africa Smart Home Products Revenue (million) Forecast, by Application 2019 & 2032
- Table 72: South Africa Smart Home Products Volume (K) Forecast, by Application 2019 & 2032
- Table 73: Rest of Middle East & Africa Smart Home Products Revenue (million) Forecast, by Application 2019 & 2032
- Table 74: Rest of Middle East & Africa Smart Home Products Volume (K) Forecast, by Application 2019 & 2032
- Table 75: Global Smart Home Products Revenue million Forecast, by Application 2019 & 2032
- Table 76: Global Smart Home Products Volume K Forecast, by Application 2019 & 2032
- Table 77: Global Smart Home Products Revenue million Forecast, by Types 2019 & 2032
- Table 78: Global Smart Home Products Volume K Forecast, by Types 2019 & 2032
- Table 79: Global Smart Home Products Revenue million Forecast, by Country 2019 & 2032
- Table 80: Global Smart Home Products Volume K Forecast, by Country 2019 & 2032
- Table 81: China Smart Home Products Revenue (million) Forecast, by Application 2019 & 2032
- Table 82: China Smart Home Products Volume (K) Forecast, by Application 2019 & 2032
- Table 83: India Smart Home Products Revenue (million) Forecast, by Application 2019 & 2032
- Table 84: India Smart Home Products Volume (K) Forecast, by Application 2019 & 2032
- Table 85: Japan Smart Home Products Revenue (million) Forecast, by Application 2019 & 2032
- Table 86: Japan Smart Home Products Volume (K) Forecast, by Application 2019 & 2032
- Table 87: South Korea Smart Home Products Revenue (million) Forecast, by Application 2019 & 2032
- Table 88: South Korea Smart Home Products Volume (K) Forecast, by Application 2019 & 2032
- Table 89: ASEAN Smart Home Products Revenue (million) Forecast, by Application 2019 & 2032
- Table 90: ASEAN Smart Home Products Volume (K) Forecast, by Application 2019 & 2032
- Table 91: Oceania Smart Home Products Revenue (million) Forecast, by Application 2019 & 2032
- Table 92: Oceania Smart Home Products Volume (K) Forecast, by Application 2019 & 2032
- Table 93: Rest of Asia Pacific Smart Home Products Revenue (million) Forecast, by Application 2019 & 2032
- Table 94: Rest of Asia Pacific Smart Home Products Volume (K) Forecast, by Application 2019 & 2032
Frequently Asked Questions
1. What is the projected Compound Annual Growth Rate (CAGR) of the Smart Home Products?
The projected CAGR is approximately XX%.
2. Which companies are prominent players in the Smart Home Products?
Key companies in the market include Honeywell International, Siemens, Johnson Controls International, Schneider Electric, United Technologies, Amazon, Apple, Google, ADT, Robert Bosch, Assa Abloy, Legrand, ABB, Ingersoll-Rand, Comcast, Hubbell, Vivint.
3. What are the main segments of the Smart Home Products?
The market segments include Application, Types.
4. Can you provide details about the market size?
The market size is estimated to be USD XXX million as of 2022.
5. What are some drivers contributing to market growth?
N/A
6. What are the notable trends driving market growth?
N/A
7. Are there any restraints impacting market growth?
N/A
8. Can you provide examples of recent developments in the market?
N/A
9. What pricing options are available for accessing the report?
Pricing options include single-user, multi-user, and enterprise licenses priced at USD 3350.00, USD 5025.00, and USD 6700.00 respectively.
10. Is the market size provided in terms of value or volume?
The market size is provided in terms of value, measured in million and volume, measured in K.
11. Are there any specific market keywords associated with the report?
Yes, the market keyword associated with the report is "Smart Home Products," which aids in identifying and referencing the specific market segment covered.
12. How do I determine which pricing option suits my needs best?
The pricing options vary based on user requirements and access needs. Individual users may opt for single-user licenses, while businesses requiring broader access may choose multi-user or enterprise licenses for cost-effective access to the report.
13. Are there any additional resources or data provided in the Smart Home Products report?
While the report offers comprehensive insights, it's advisable to review the specific contents or supplementary materials provided to ascertain if additional resources or data are available.
14. How can I stay updated on further developments or reports in the Smart Home Products?
To stay informed about further developments, trends, and reports in the Smart Home Products, consider subscribing to industry newsletters, following relevant companies and organizations, or regularly checking reputable industry news sources and publications.
Methodology
Step 1 - Identification of Relevant Samples Size from Population Database


Step 2 - Approaches for Defining Global Market Size (Value, Volume* & Price*)

Note*: In applicable scenarios
Step 3 - Data Sources
Primary Research
- Web Analytics
- Survey Reports
- Research Institute
- Latest Research Reports
- Opinion Leaders
Secondary Research
- Annual Reports
- White Paper
- Latest Press Release
- Industry Association
- Paid Database
- Investor Presentations

Step 4 - Data Triangulation
Involves using different sources of information in order to increase the validity of a study
These sources are likely to be stakeholders in a program - participants, other researchers, program staff, other community members, and so on.
Then we put all data in single framework & apply various statistical tools to find out the dynamic on the market.
During the analysis stage, feedback from the stakeholder groups would be compared to determine areas of agreement as well as areas of divergence


