
Key Insights
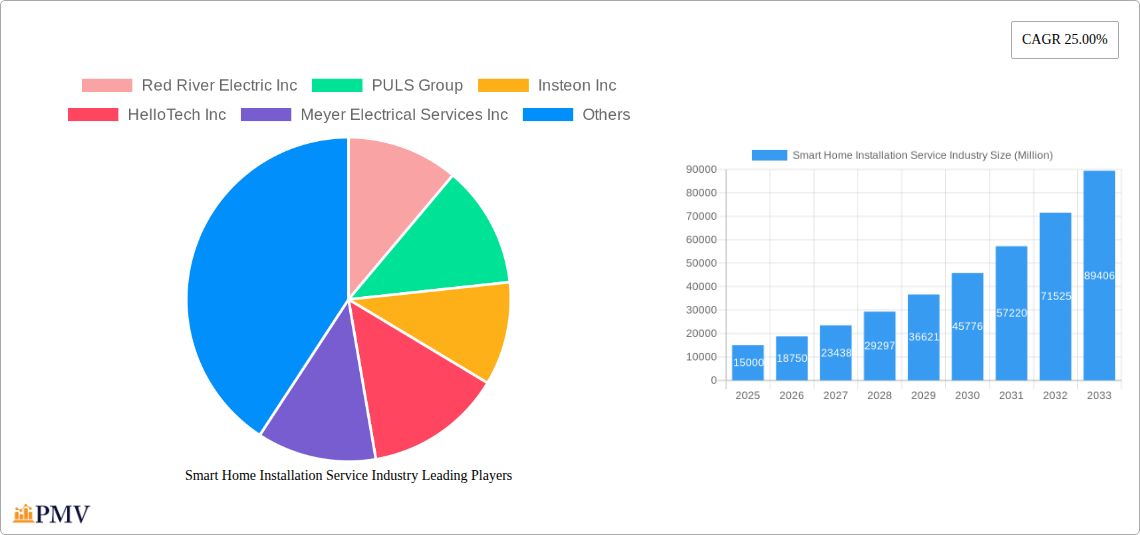
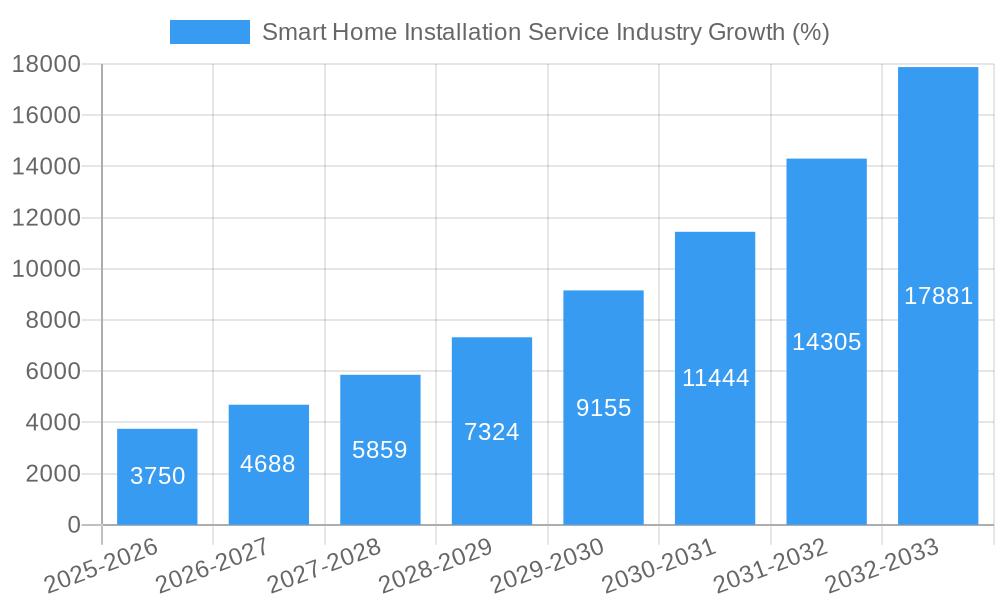
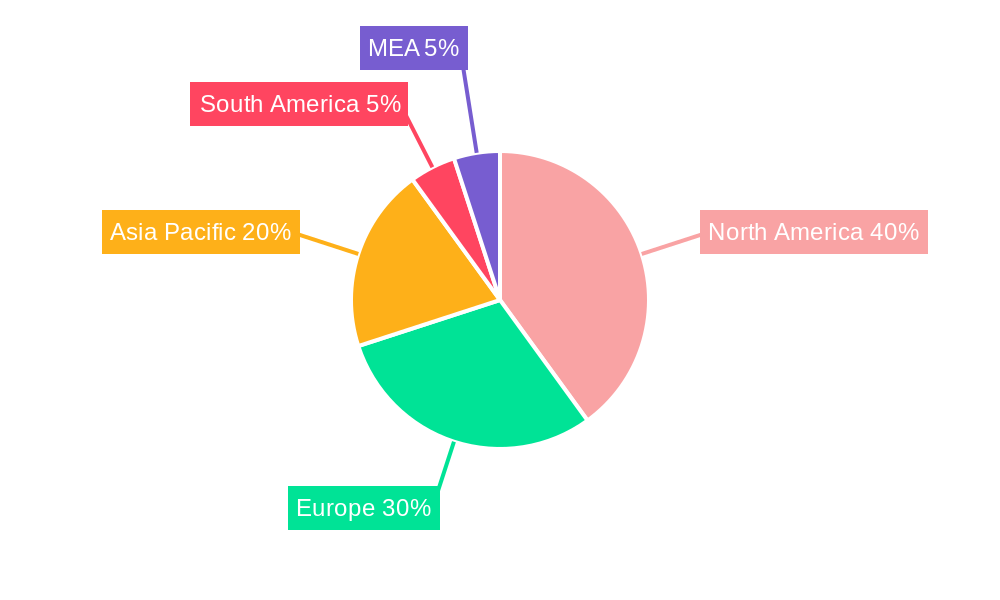
The smart home installation service industry is experiencing robust growth, driven by increasing consumer adoption of smart home devices and the rising demand for convenient, energy-efficient, and secure living spaces. The market's Compound Annual Growth Rate (CAGR) of 25% from 2019 to 2024 suggests significant expansion, projected to continue through 2033. Key drivers include the affordability and accessibility of smart home technologies, coupled with enhanced connectivity and integration capabilities. Consumers are increasingly drawn to the convenience of automated lighting, security systems, and energy management, leading to greater investment in professional installation services to ensure seamless functionality and optimal performance. Growth is also fueled by advancements in artificial intelligence (AI) and Internet of Things (IoT) integration, creating more sophisticated and personalized smart home experiences. While challenges like the initial high cost of smart home technology and concerns about data security persist, the overall trend points to sustained market expansion. The market segmentation reveals significant opportunity across various systems (lighting control, home monitoring, thermostats, etc.) and distribution channels (retailers, e-commerce, original equipment manufacturers (OEMs)). North America and Europe are currently leading market segments, but the Asia-Pacific region is projected to demonstrate substantial growth due to rapid technological advancements and rising disposable incomes.
The competitive landscape features both established electrical contractors and specialized smart home installation companies. Differentiation strategies focus on offering comprehensive service packages, including design, installation, and ongoing support. The integration of value-added services, such as energy efficiency audits and customized smart home solutions, is crucial for attracting and retaining customers. Future growth will be further propelled by advancements in smart home technology, including voice-activated control systems, improved energy management solutions, and the increasing integration of renewable energy sources within smart home ecosystems. The continued development of user-friendly interfaces and enhanced cybersecurity measures will also be crucial in addressing remaining consumer concerns and unlocking further market potential. This ongoing evolution promises a continually expanding market for smart home installation services.
Smart Home Installation Service Industry Market Report: 2019-2033
This comprehensive report provides a detailed analysis of the global Smart Home Installation Service industry, projecting a market value of $XX Million by 2033. The study covers the period from 2019 to 2033, with 2025 as the base and estimated year. This in-depth analysis offers invaluable insights for industry stakeholders, investors, and businesses seeking to navigate this rapidly evolving market. The report utilizes a robust methodology, incorporating both historical data (2019-2024) and future projections (2025-2033) to deliver actionable intelligence.
Smart Home Installation Service Industry Market Structure & Competitive Dynamics
The global smart home installation service market exhibits a moderately concentrated structure, with several key players vying for market share. The market's competitive landscape is shaped by factors including innovation ecosystems, regulatory frameworks, the availability of product substitutes, evolving end-user trends, and ongoing mergers and acquisitions (M&A) activities. Market share is largely determined by brand reputation, service quality, technological capabilities, and pricing strategies. Significant M&A activity has been observed in recent years, with deal values ranging from $XX Million to $XX Million, driving consolidation and shaping the industry's competitive dynamics. Regulatory frameworks concerning data privacy and security, as well as installation standards, significantly impact market players. Furthermore, the increasing availability of DIY smart home solutions presents a growing challenge to established installation service providers. The report details specific examples of M&A activities and their impact on market share, providing a comprehensive understanding of the current competitive landscape.
- Market Concentration: Moderately concentrated, with key players holding significant shares.
- Innovation Ecosystems: Rapid innovation in smart home technologies, driving continuous market evolution.
- Regulatory Frameworks: Data privacy and security regulations influence market strategies.
- Product Substitutes: DIY solutions and alternative service providers increase competition.
- End-User Trends: Increasing demand for convenience, security, and energy efficiency.
- M&A Activities: Consolidation through strategic acquisitions, impacting market share distribution.
Smart Home Installation Service Industry Industry Trends & Insights
The smart home installation service market is experiencing robust growth, driven by several key factors. The increasing adoption of smart home devices, coupled with consumer demand for enhanced convenience, security, and energy efficiency, is a primary growth catalyst. Technological advancements, including the Internet of Things (IoT) and artificial intelligence (AI), are fueling innovation and expanding the range of available services. Market penetration is steadily increasing, particularly in developed regions. The report analyzes these trends, providing detailed insights into consumer preferences, technological disruptions, and competitive dynamics, with a projected Compound Annual Growth Rate (CAGR) of XX% during the forecast period (2025-2033). The market penetration is estimated to reach XX% by 2033. These trends, coupled with the rising disposable incomes in emerging economies, contribute significantly to market growth.
Dominant Markets & Segments in Smart Home Installation Service Industry
The North American region currently holds a dominant position in the smart home installation service market, driven by high levels of technology adoption, strong infrastructure, and favorable economic policies. Within the segment breakdown, the Home Monitoring/Security system commands the largest market share, followed closely by Lighting Control systems. The E-commerce channel is experiencing rapid growth, reflecting changing consumer preferences.
- By System:
- Home Monitoring/Security: High demand for enhanced security and safety features.
- Lighting Control: Convenience and energy efficiency drive strong adoption.
- Thermostat: Energy savings and automated climate control fuel market growth.
- Video Entertainment: Increasing demand for seamless integration of entertainment systems.
- Smart Appliances: Convenience and enhanced functionality drive adoption.
- Other Systems: Emerging technologies and innovative applications contribute to growth.
- By Channel:
- Retailers: Traditional sales channels still hold significant market share.
- E-Commerce: Rapidly growing online sales channel, driven by convenience.
- OEM: Original equipment manufacturers play a crucial role in market expansion.
Key Drivers:
- Developed Economies: High disposable income and technology adoption.
- Government Initiatives: Subsidies and policies promoting energy efficiency.
- Infrastructure Development: Reliable internet connectivity and robust power grids.
Smart Home Installation Service Industry Product Innovations
Recent years have witnessed significant product innovations in the smart home installation service industry, driven by advancements in IoT, AI, and machine learning. New products and services offer enhanced features such as voice control, seamless integration with other smart devices, improved security measures, and enhanced user interfaces. These innovations cater to evolving consumer preferences and contribute to greater market acceptance. The development of user-friendly installation kits and services is also broadening market access. Competitive advantages are increasingly being defined by the ability to offer integrated, seamless, and secure smart home solutions.
Report Segmentation & Scope
This report segments the smart home installation service market by system (Lighting Control, Home Monitoring/Security, Thermostat, Video Entertainment, Smart Appliances, Other Systems) and by channel (Retailers, E-Commerce, OEM). Each segment's growth projections, market size, and competitive dynamics are analyzed in detail. For instance, the Home Monitoring/Security segment is projected to experience significant growth due to increasing security concerns, while the E-commerce channel is expected to witness rapid expansion due to the rising preference for online shopping. The report provides granular data for each segment and channel, offering a clear understanding of the market landscape.
Key Drivers of Smart Home Installation Service Industry Growth
Several key factors are driving the growth of the smart home installation service industry. Technological advancements such as the proliferation of IoT devices, AI-powered solutions, and improved connectivity are creating new opportunities. Economic factors, including rising disposable incomes and government incentives promoting energy efficiency, further contribute to market expansion. Regulatory frameworks that support data privacy and security are shaping industry standards, ensuring consumer trust. The increasing demand for convenience, enhanced security, and energy-efficient solutions is also a significant driver of growth.
Challenges in the Smart Home Installation Service Industry Sector
The smart home installation service industry faces several challenges. Regulatory hurdles related to data privacy and security can increase compliance costs. Supply chain disruptions, particularly in the context of global events, can impact the availability of key components. Intense competition from both established players and emerging entrants necessitates continuous innovation and efficient service delivery to maintain market share. Furthermore, cybersecurity concerns and the complexity of integrating diverse smart home systems pose significant challenges. The report quantifies the impact of these challenges on market growth.
Leading Players in the Smart Home Installation Service Industry Market
- Red River Electric Inc
- PULS Group
- Insteon Inc
- HelloTech Inc
- Meyer Electrical Services Inc
- Miami Electric Masters Inc
- Calix Inc
- Vivint Inc
- Finite Solutions LLC
- Handy Inc
- Smartify Home Automation Limited
Key Developments in Smart Home Installation Service Industry Sector
- May 2022: Vivint Smart Home announced the launch of new products, including an all-new Doorbell Camera Pro, Outdoor Camera Pro, Spotlight Pro, and Indoor Camera Pro, enhancing its smart home offerings. This launch significantly impacted the competitive landscape by strengthening Vivint's market position.
- July 2022: Xiaomi unveiled its new Smart Home Display 6 in China, demonstrating ongoing innovation in the smart home ecosystem. This product launch expanded Xiaomi's product portfolio and potentially increased market competition.
Strategic Smart Home Installation Service Industry Market Outlook
The future of the smart home installation service industry looks promising. Continued technological advancements, expanding internet connectivity, and rising consumer demand for smart home solutions will drive significant market growth. Strategic opportunities lie in developing innovative, integrated solutions, focusing on user experience, and addressing cybersecurity concerns. Companies that can effectively leverage emerging technologies and cater to the evolving needs of consumers will be well-positioned for success. Furthermore, strategic partnerships and collaborations can unlock significant growth potential.
Smart Home Installation Service Industry Segmentation
-
1. System
- 1.1. Lighting Control
- 1.2. Home Monitoring/Security
- 1.3. Thermostat
- 1.4. Video Entertainment
- 1.5. Smart Appliances
- 1.6. Other Systems
-
2. Channel
- 2.1. Retailers
- 2.2. E-Commerce
- 2.3. OEM
Smart Home Installation Service Industry Segmentation By Geography
- 1. North America
- 2. Europe
- 3. Asia Pacific
- 4. Latin America
- 5. Middle East
Smart Home Installation Service Industry REPORT HIGHLIGHTS
| Aspects | Details |
|---|---|
| Study Period | 2019-2033 |
| Base Year | 2024 |
| Estimated Year | 2025 |
| Forecast Period | 2025-2033 |
| Historical Period | 2019-2024 |
| Growth Rate | CAGR of 25.00% from 2019-2033 |
| Segmentation |
|
Table of Contents
- 1. Introduction
- 1.1. Research Scope
- 1.2. Market Segmentation
- 1.3. Research Methodology
- 1.4. Definitions and Assumptions
- 2. Executive Summary
- 2.1. Introduction
- 3. Market Dynamics
- 3.1. Introduction
- 3.2. Market Drivers
- 3.2.1. Increased Number of Cognitive Systems; Adoption of Intelligent Embedded Devices; Growing consumer preference towards E-Commerce
- 3.3. Market Restrains
- 3.3.1. Data Privacy and Security Concerns
- 3.4. Market Trends
- 3.4.1. E-commerce Boosting the Growth of Smart Home Installation Service Market
- 4. Market Factor Analysis
- 4.1. Porters Five Forces
- 4.2. Supply/Value Chain
- 4.3. PESTEL analysis
- 4.4. Market Entropy
- 4.5. Patent/Trademark Analysis
- 5. Global Smart Home Installation Service Industry Analysis, Insights and Forecast, 2019-2031
- 5.1. Market Analysis, Insights and Forecast - by System
- 5.1.1. Lighting Control
- 5.1.2. Home Monitoring/Security
- 5.1.3. Thermostat
- 5.1.4. Video Entertainment
- 5.1.5. Smart Appliances
- 5.1.6. Other Systems
- 5.2. Market Analysis, Insights and Forecast - by Channel
- 5.2.1. Retailers
- 5.2.2. E-Commerce
- 5.2.3. OEM
- 5.3. Market Analysis, Insights and Forecast - by Region
- 5.3.1. North America
- 5.3.2. Europe
- 5.3.3. Asia Pacific
- 5.3.4. Latin America
- 5.3.5. Middle East
- 5.1. Market Analysis, Insights and Forecast - by System
- 6. North America Smart Home Installation Service Industry Analysis, Insights and Forecast, 2019-2031
- 6.1. Market Analysis, Insights and Forecast - by System
- 6.1.1. Lighting Control
- 6.1.2. Home Monitoring/Security
- 6.1.3. Thermostat
- 6.1.4. Video Entertainment
- 6.1.5. Smart Appliances
- 6.1.6. Other Systems
- 6.2. Market Analysis, Insights and Forecast - by Channel
- 6.2.1. Retailers
- 6.2.2. E-Commerce
- 6.2.3. OEM
- 6.1. Market Analysis, Insights and Forecast - by System
- 7. Europe Smart Home Installation Service Industry Analysis, Insights and Forecast, 2019-2031
- 7.1. Market Analysis, Insights and Forecast - by System
- 7.1.1. Lighting Control
- 7.1.2. Home Monitoring/Security
- 7.1.3. Thermostat
- 7.1.4. Video Entertainment
- 7.1.5. Smart Appliances
- 7.1.6. Other Systems
- 7.2. Market Analysis, Insights and Forecast - by Channel
- 7.2.1. Retailers
- 7.2.2. E-Commerce
- 7.2.3. OEM
- 7.1. Market Analysis, Insights and Forecast - by System
- 8. Asia Pacific Smart Home Installation Service Industry Analysis, Insights and Forecast, 2019-2031
- 8.1. Market Analysis, Insights and Forecast - by System
- 8.1.1. Lighting Control
- 8.1.2. Home Monitoring/Security
- 8.1.3. Thermostat
- 8.1.4. Video Entertainment
- 8.1.5. Smart Appliances
- 8.1.6. Other Systems
- 8.2. Market Analysis, Insights and Forecast - by Channel
- 8.2.1. Retailers
- 8.2.2. E-Commerce
- 8.2.3. OEM
- 8.1. Market Analysis, Insights and Forecast - by System
- 9. Latin America Smart Home Installation Service Industry Analysis, Insights and Forecast, 2019-2031
- 9.1. Market Analysis, Insights and Forecast - by System
- 9.1.1. Lighting Control
- 9.1.2. Home Monitoring/Security
- 9.1.3. Thermostat
- 9.1.4. Video Entertainment
- 9.1.5. Smart Appliances
- 9.1.6. Other Systems
- 9.2. Market Analysis, Insights and Forecast - by Channel
- 9.2.1. Retailers
- 9.2.2. E-Commerce
- 9.2.3. OEM
- 9.1. Market Analysis, Insights and Forecast - by System
- 10. Middle East Smart Home Installation Service Industry Analysis, Insights and Forecast, 2019-2031
- 10.1. Market Analysis, Insights and Forecast - by System
- 10.1.1. Lighting Control
- 10.1.2. Home Monitoring/Security
- 10.1.3. Thermostat
- 10.1.4. Video Entertainment
- 10.1.5. Smart Appliances
- 10.1.6. Other Systems
- 10.2. Market Analysis, Insights and Forecast - by Channel
- 10.2.1. Retailers
- 10.2.2. E-Commerce
- 10.2.3. OEM
- 10.1. Market Analysis, Insights and Forecast - by System
- 11. North America Smart Home Installation Service Industry Analysis, Insights and Forecast, 2019-2031
- 11.1. Market Analysis, Insights and Forecast - By Country/Sub-region
- 11.1.1 United States
- 11.1.2 Canada
- 11.1.3 Mexico
- 12. Europe Smart Home Installation Service Industry Analysis, Insights and Forecast, 2019-2031
- 12.1. Market Analysis, Insights and Forecast - By Country/Sub-region
- 12.1.1 Germany
- 12.1.2 United Kingdom
- 12.1.3 France
- 12.1.4 Spain
- 12.1.5 Italy
- 12.1.6 Spain
- 12.1.7 Belgium
- 12.1.8 Netherland
- 12.1.9 Nordics
- 12.1.10 Rest of Europe
- 13. Asia Pacific Smart Home Installation Service Industry Analysis, Insights and Forecast, 2019-2031
- 13.1. Market Analysis, Insights and Forecast - By Country/Sub-region
- 13.1.1 China
- 13.1.2 Japan
- 13.1.3 India
- 13.1.4 South Korea
- 13.1.5 Southeast Asia
- 13.1.6 Australia
- 13.1.7 Indonesia
- 13.1.8 Phillipes
- 13.1.9 Singapore
- 13.1.10 Thailandc
- 13.1.11 Rest of Asia Pacific
- 14. South America Smart Home Installation Service Industry Analysis, Insights and Forecast, 2019-2031
- 14.1. Market Analysis, Insights and Forecast - By Country/Sub-region
- 14.1.1 Brazil
- 14.1.2 Argentina
- 14.1.3 Peru
- 14.1.4 Chile
- 14.1.5 Colombia
- 14.1.6 Ecuador
- 14.1.7 Venezuela
- 14.1.8 Rest of South America
- 15. North America Smart Home Installation Service Industry Analysis, Insights and Forecast, 2019-2031
- 15.1. Market Analysis, Insights and Forecast - By Country/Sub-region
- 15.1.1 United States
- 15.1.2 Canada
- 15.1.3 Mexico
- 16. MEA Smart Home Installation Service Industry Analysis, Insights and Forecast, 2019-2031
- 16.1. Market Analysis, Insights and Forecast - By Country/Sub-region
- 16.1.1 United Arab Emirates
- 16.1.2 Saudi Arabia
- 16.1.3 South Africa
- 16.1.4 Rest of Middle East and Africa
- 17. Competitive Analysis
- 17.1. Global Market Share Analysis 2024
- 17.2. Company Profiles
- 17.2.1 Red River Electric Inc
- 17.2.1.1. Overview
- 17.2.1.2. Products
- 17.2.1.3. SWOT Analysis
- 17.2.1.4. Recent Developments
- 17.2.1.5. Financials (Based on Availability)
- 17.2.2 PULS Group
- 17.2.2.1. Overview
- 17.2.2.2. Products
- 17.2.2.3. SWOT Analysis
- 17.2.2.4. Recent Developments
- 17.2.2.5. Financials (Based on Availability)
- 17.2.3 Insteon Inc
- 17.2.3.1. Overview
- 17.2.3.2. Products
- 17.2.3.3. SWOT Analysis
- 17.2.3.4. Recent Developments
- 17.2.3.5. Financials (Based on Availability)
- 17.2.4 HelloTech Inc
- 17.2.4.1. Overview
- 17.2.4.2. Products
- 17.2.4.3. SWOT Analysis
- 17.2.4.4. Recent Developments
- 17.2.4.5. Financials (Based on Availability)
- 17.2.5 Meyer Electrical Services Inc
- 17.2.5.1. Overview
- 17.2.5.2. Products
- 17.2.5.3. SWOT Analysis
- 17.2.5.4. Recent Developments
- 17.2.5.5. Financials (Based on Availability)
- 17.2.6 Miami Electric Masters Inc
- 17.2.6.1. Overview
- 17.2.6.2. Products
- 17.2.6.3. SWOT Analysis
- 17.2.6.4. Recent Developments
- 17.2.6.5. Financials (Based on Availability)
- 17.2.7 Calix Inc
- 17.2.7.1. Overview
- 17.2.7.2. Products
- 17.2.7.3. SWOT Analysis
- 17.2.7.4. Recent Developments
- 17.2.7.5. Financials (Based on Availability)
- 17.2.8 Vivint Inc
- 17.2.8.1. Overview
- 17.2.8.2. Products
- 17.2.8.3. SWOT Analysis
- 17.2.8.4. Recent Developments
- 17.2.8.5. Financials (Based on Availability)
- 17.2.9 Finite Solutions LLC
- 17.2.9.1. Overview
- 17.2.9.2. Products
- 17.2.9.3. SWOT Analysis
- 17.2.9.4. Recent Developments
- 17.2.9.5. Financials (Based on Availability)
- 17.2.10 Handy Inc
- 17.2.10.1. Overview
- 17.2.10.2. Products
- 17.2.10.3. SWOT Analysis
- 17.2.10.4. Recent Developments
- 17.2.10.5. Financials (Based on Availability)
- 17.2.11 Smartify Home Automation Limited
- 17.2.11.1. Overview
- 17.2.11.2. Products
- 17.2.11.3. SWOT Analysis
- 17.2.11.4. Recent Developments
- 17.2.11.5. Financials (Based on Availability)
- 17.2.1 Red River Electric Inc
List of Figures
- Figure 1: Global Smart Home Installation Service Industry Revenue Breakdown (Million, %) by Region 2024 & 2032
- Figure 2: Global Smart Home Installation Service Industry Volume Breakdown (K Unit, %) by Region 2024 & 2032
- Figure 3: North America Smart Home Installation Service Industry Revenue (Million), by Country 2024 & 2032
- Figure 4: North America Smart Home Installation Service Industry Volume (K Unit), by Country 2024 & 2032
- Figure 5: North America Smart Home Installation Service Industry Revenue Share (%), by Country 2024 & 2032
- Figure 6: North America Smart Home Installation Service Industry Volume Share (%), by Country 2024 & 2032
- Figure 7: Europe Smart Home Installation Service Industry Revenue (Million), by Country 2024 & 2032
- Figure 8: Europe Smart Home Installation Service Industry Volume (K Unit), by Country 2024 & 2032
- Figure 9: Europe Smart Home Installation Service Industry Revenue Share (%), by Country 2024 & 2032
- Figure 10: Europe Smart Home Installation Service Industry Volume Share (%), by Country 2024 & 2032
- Figure 11: Asia Pacific Smart Home Installation Service Industry Revenue (Million), by Country 2024 & 2032
- Figure 12: Asia Pacific Smart Home Installation Service Industry Volume (K Unit), by Country 2024 & 2032
- Figure 13: Asia Pacific Smart Home Installation Service Industry Revenue Share (%), by Country 2024 & 2032
- Figure 14: Asia Pacific Smart Home Installation Service Industry Volume Share (%), by Country 2024 & 2032
- Figure 15: South America Smart Home Installation Service Industry Revenue (Million), by Country 2024 & 2032
- Figure 16: South America Smart Home Installation Service Industry Volume (K Unit), by Country 2024 & 2032
- Figure 17: South America Smart Home Installation Service Industry Revenue Share (%), by Country 2024 & 2032
- Figure 18: South America Smart Home Installation Service Industry Volume Share (%), by Country 2024 & 2032
- Figure 19: North America Smart Home Installation Service Industry Revenue (Million), by Country 2024 & 2032
- Figure 20: North America Smart Home Installation Service Industry Volume (K Unit), by Country 2024 & 2032
- Figure 21: North America Smart Home Installation Service Industry Revenue Share (%), by Country 2024 & 2032
- Figure 22: North America Smart Home Installation Service Industry Volume Share (%), by Country 2024 & 2032
- Figure 23: MEA Smart Home Installation Service Industry Revenue (Million), by Country 2024 & 2032
- Figure 24: MEA Smart Home Installation Service Industry Volume (K Unit), by Country 2024 & 2032
- Figure 25: MEA Smart Home Installation Service Industry Revenue Share (%), by Country 2024 & 2032
- Figure 26: MEA Smart Home Installation Service Industry Volume Share (%), by Country 2024 & 2032
- Figure 27: North America Smart Home Installation Service Industry Revenue (Million), by System 2024 & 2032
- Figure 28: North America Smart Home Installation Service Industry Volume (K Unit), by System 2024 & 2032
- Figure 29: North America Smart Home Installation Service Industry Revenue Share (%), by System 2024 & 2032
- Figure 30: North America Smart Home Installation Service Industry Volume Share (%), by System 2024 & 2032
- Figure 31: North America Smart Home Installation Service Industry Revenue (Million), by Channel 2024 & 2032
- Figure 32: North America Smart Home Installation Service Industry Volume (K Unit), by Channel 2024 & 2032
- Figure 33: North America Smart Home Installation Service Industry Revenue Share (%), by Channel 2024 & 2032
- Figure 34: North America Smart Home Installation Service Industry Volume Share (%), by Channel 2024 & 2032
- Figure 35: North America Smart Home Installation Service Industry Revenue (Million), by Country 2024 & 2032
- Figure 36: North America Smart Home Installation Service Industry Volume (K Unit), by Country 2024 & 2032
- Figure 37: North America Smart Home Installation Service Industry Revenue Share (%), by Country 2024 & 2032
- Figure 38: North America Smart Home Installation Service Industry Volume Share (%), by Country 2024 & 2032
- Figure 39: Europe Smart Home Installation Service Industry Revenue (Million), by System 2024 & 2032
- Figure 40: Europe Smart Home Installation Service Industry Volume (K Unit), by System 2024 & 2032
- Figure 41: Europe Smart Home Installation Service Industry Revenue Share (%), by System 2024 & 2032
- Figure 42: Europe Smart Home Installation Service Industry Volume Share (%), by System 2024 & 2032
- Figure 43: Europe Smart Home Installation Service Industry Revenue (Million), by Channel 2024 & 2032
- Figure 44: Europe Smart Home Installation Service Industry Volume (K Unit), by Channel 2024 & 2032
- Figure 45: Europe Smart Home Installation Service Industry Revenue Share (%), by Channel 2024 & 2032
- Figure 46: Europe Smart Home Installation Service Industry Volume Share (%), by Channel 2024 & 2032
- Figure 47: Europe Smart Home Installation Service Industry Revenue (Million), by Country 2024 & 2032
- Figure 48: Europe Smart Home Installation Service Industry Volume (K Unit), by Country 2024 & 2032
- Figure 49: Europe Smart Home Installation Service Industry Revenue Share (%), by Country 2024 & 2032
- Figure 50: Europe Smart Home Installation Service Industry Volume Share (%), by Country 2024 & 2032
- Figure 51: Asia Pacific Smart Home Installation Service Industry Revenue (Million), by System 2024 & 2032
- Figure 52: Asia Pacific Smart Home Installation Service Industry Volume (K Unit), by System 2024 & 2032
- Figure 53: Asia Pacific Smart Home Installation Service Industry Revenue Share (%), by System 2024 & 2032
- Figure 54: Asia Pacific Smart Home Installation Service Industry Volume Share (%), by System 2024 & 2032
- Figure 55: Asia Pacific Smart Home Installation Service Industry Revenue (Million), by Channel 2024 & 2032
- Figure 56: Asia Pacific Smart Home Installation Service Industry Volume (K Unit), by Channel 2024 & 2032
- Figure 57: Asia Pacific Smart Home Installation Service Industry Revenue Share (%), by Channel 2024 & 2032
- Figure 58: Asia Pacific Smart Home Installation Service Industry Volume Share (%), by Channel 2024 & 2032
- Figure 59: Asia Pacific Smart Home Installation Service Industry Revenue (Million), by Country 2024 & 2032
- Figure 60: Asia Pacific Smart Home Installation Service Industry Volume (K Unit), by Country 2024 & 2032
- Figure 61: Asia Pacific Smart Home Installation Service Industry Revenue Share (%), by Country 2024 & 2032
- Figure 62: Asia Pacific Smart Home Installation Service Industry Volume Share (%), by Country 2024 & 2032
- Figure 63: Latin America Smart Home Installation Service Industry Revenue (Million), by System 2024 & 2032
- Figure 64: Latin America Smart Home Installation Service Industry Volume (K Unit), by System 2024 & 2032
- Figure 65: Latin America Smart Home Installation Service Industry Revenue Share (%), by System 2024 & 2032
- Figure 66: Latin America Smart Home Installation Service Industry Volume Share (%), by System 2024 & 2032
- Figure 67: Latin America Smart Home Installation Service Industry Revenue (Million), by Channel 2024 & 2032
- Figure 68: Latin America Smart Home Installation Service Industry Volume (K Unit), by Channel 2024 & 2032
- Figure 69: Latin America Smart Home Installation Service Industry Revenue Share (%), by Channel 2024 & 2032
- Figure 70: Latin America Smart Home Installation Service Industry Volume Share (%), by Channel 2024 & 2032
- Figure 71: Latin America Smart Home Installation Service Industry Revenue (Million), by Country 2024 & 2032
- Figure 72: Latin America Smart Home Installation Service Industry Volume (K Unit), by Country 2024 & 2032
- Figure 73: Latin America Smart Home Installation Service Industry Revenue Share (%), by Country 2024 & 2032
- Figure 74: Latin America Smart Home Installation Service Industry Volume Share (%), by Country 2024 & 2032
- Figure 75: Middle East Smart Home Installation Service Industry Revenue (Million), by System 2024 & 2032
- Figure 76: Middle East Smart Home Installation Service Industry Volume (K Unit), by System 2024 & 2032
- Figure 77: Middle East Smart Home Installation Service Industry Revenue Share (%), by System 2024 & 2032
- Figure 78: Middle East Smart Home Installation Service Industry Volume Share (%), by System 2024 & 2032
- Figure 79: Middle East Smart Home Installation Service Industry Revenue (Million), by Channel 2024 & 2032
- Figure 80: Middle East Smart Home Installation Service Industry Volume (K Unit), by Channel 2024 & 2032
- Figure 81: Middle East Smart Home Installation Service Industry Revenue Share (%), by Channel 2024 & 2032
- Figure 82: Middle East Smart Home Installation Service Industry Volume Share (%), by Channel 2024 & 2032
- Figure 83: Middle East Smart Home Installation Service Industry Revenue (Million), by Country 2024 & 2032
- Figure 84: Middle East Smart Home Installation Service Industry Volume (K Unit), by Country 2024 & 2032
- Figure 85: Middle East Smart Home Installation Service Industry Revenue Share (%), by Country 2024 & 2032
- Figure 86: Middle East Smart Home Installation Service Industry Volume Share (%), by Country 2024 & 2032
List of Tables
- Table 1: Global Smart Home Installation Service Industry Revenue Million Forecast, by Region 2019 & 2032
- Table 2: Global Smart Home Installation Service Industry Volume K Unit Forecast, by Region 2019 & 2032
- Table 3: Global Smart Home Installation Service Industry Revenue Million Forecast, by System 2019 & 2032
- Table 4: Global Smart Home Installation Service Industry Volume K Unit Forecast, by System 2019 & 2032
- Table 5: Global Smart Home Installation Service Industry Revenue Million Forecast, by Channel 2019 & 2032
- Table 6: Global Smart Home Installation Service Industry Volume K Unit Forecast, by Channel 2019 & 2032
- Table 7: Global Smart Home Installation Service Industry Revenue Million Forecast, by Region 2019 & 2032
- Table 8: Global Smart Home Installation Service Industry Volume K Unit Forecast, by Region 2019 & 2032
- Table 9: Global Smart Home Installation Service Industry Revenue Million Forecast, by Country 2019 & 2032
- Table 10: Global Smart Home Installation Service Industry Volume K Unit Forecast, by Country 2019 & 2032
- Table 11: United States Smart Home Installation Service Industry Revenue (Million) Forecast, by Application 2019 & 2032
- Table 12: United States Smart Home Installation Service Industry Volume (K Unit) Forecast, by Application 2019 & 2032
- Table 13: Canada Smart Home Installation Service Industry Revenue (Million) Forecast, by Application 2019 & 2032
- Table 14: Canada Smart Home Installation Service Industry Volume (K Unit) Forecast, by Application 2019 & 2032
- Table 15: Mexico Smart Home Installation Service Industry Revenue (Million) Forecast, by Application 2019 & 2032
- Table 16: Mexico Smart Home Installation Service Industry Volume (K Unit) Forecast, by Application 2019 & 2032
- Table 17: Global Smart Home Installation Service Industry Revenue Million Forecast, by Country 2019 & 2032
- Table 18: Global Smart Home Installation Service Industry Volume K Unit Forecast, by Country 2019 & 2032
- Table 19: Germany Smart Home Installation Service Industry Revenue (Million) Forecast, by Application 2019 & 2032
- Table 20: Germany Smart Home Installation Service Industry Volume (K Unit) Forecast, by Application 2019 & 2032
- Table 21: United Kingdom Smart Home Installation Service Industry Revenue (Million) Forecast, by Application 2019 & 2032
- Table 22: United Kingdom Smart Home Installation Service Industry Volume (K Unit) Forecast, by Application 2019 & 2032
- Table 23: France Smart Home Installation Service Industry Revenue (Million) Forecast, by Application 2019 & 2032
- Table 24: France Smart Home Installation Service Industry Volume (K Unit) Forecast, by Application 2019 & 2032
- Table 25: Spain Smart Home Installation Service Industry Revenue (Million) Forecast, by Application 2019 & 2032
- Table 26: Spain Smart Home Installation Service Industry Volume (K Unit) Forecast, by Application 2019 & 2032
- Table 27: Italy Smart Home Installation Service Industry Revenue (Million) Forecast, by Application 2019 & 2032
- Table 28: Italy Smart Home Installation Service Industry Volume (K Unit) Forecast, by Application 2019 & 2032
- Table 29: Spain Smart Home Installation Service Industry Revenue (Million) Forecast, by Application 2019 & 2032
- Table 30: Spain Smart Home Installation Service Industry Volume (K Unit) Forecast, by Application 2019 & 2032
- Table 31: Belgium Smart Home Installation Service Industry Revenue (Million) Forecast, by Application 2019 & 2032
- Table 32: Belgium Smart Home Installation Service Industry Volume (K Unit) Forecast, by Application 2019 & 2032
- Table 33: Netherland Smart Home Installation Service Industry Revenue (Million) Forecast, by Application 2019 & 2032
- Table 34: Netherland Smart Home Installation Service Industry Volume (K Unit) Forecast, by Application 2019 & 2032
- Table 35: Nordics Smart Home Installation Service Industry Revenue (Million) Forecast, by Application 2019 & 2032
- Table 36: Nordics Smart Home Installation Service Industry Volume (K Unit) Forecast, by Application 2019 & 2032
- Table 37: Rest of Europe Smart Home Installation Service Industry Revenue (Million) Forecast, by Application 2019 & 2032
- Table 38: Rest of Europe Smart Home Installation Service Industry Volume (K Unit) Forecast, by Application 2019 & 2032
- Table 39: Global Smart Home Installation Service Industry Revenue Million Forecast, by Country 2019 & 2032
- Table 40: Global Smart Home Installation Service Industry Volume K Unit Forecast, by Country 2019 & 2032
- Table 41: China Smart Home Installation Service Industry Revenue (Million) Forecast, by Application 2019 & 2032
- Table 42: China Smart Home Installation Service Industry Volume (K Unit) Forecast, by Application 2019 & 2032
- Table 43: Japan Smart Home Installation Service Industry Revenue (Million) Forecast, by Application 2019 & 2032
- Table 44: Japan Smart Home Installation Service Industry Volume (K Unit) Forecast, by Application 2019 & 2032
- Table 45: India Smart Home Installation Service Industry Revenue (Million) Forecast, by Application 2019 & 2032
- Table 46: India Smart Home Installation Service Industry Volume (K Unit) Forecast, by Application 2019 & 2032
- Table 47: South Korea Smart Home Installation Service Industry Revenue (Million) Forecast, by Application 2019 & 2032
- Table 48: South Korea Smart Home Installation Service Industry Volume (K Unit) Forecast, by Application 2019 & 2032
- Table 49: Southeast Asia Smart Home Installation Service Industry Revenue (Million) Forecast, by Application 2019 & 2032
- Table 50: Southeast Asia Smart Home Installation Service Industry Volume (K Unit) Forecast, by Application 2019 & 2032
- Table 51: Australia Smart Home Installation Service Industry Revenue (Million) Forecast, by Application 2019 & 2032
- Table 52: Australia Smart Home Installation Service Industry Volume (K Unit) Forecast, by Application 2019 & 2032
- Table 53: Indonesia Smart Home Installation Service Industry Revenue (Million) Forecast, by Application 2019 & 2032
- Table 54: Indonesia Smart Home Installation Service Industry Volume (K Unit) Forecast, by Application 2019 & 2032
- Table 55: Phillipes Smart Home Installation Service Industry Revenue (Million) Forecast, by Application 2019 & 2032
- Table 56: Phillipes Smart Home Installation Service Industry Volume (K Unit) Forecast, by Application 2019 & 2032
- Table 57: Singapore Smart Home Installation Service Industry Revenue (Million) Forecast, by Application 2019 & 2032
- Table 58: Singapore Smart Home Installation Service Industry Volume (K Unit) Forecast, by Application 2019 & 2032
- Table 59: Thailandc Smart Home Installation Service Industry Revenue (Million) Forecast, by Application 2019 & 2032
- Table 60: Thailandc Smart Home Installation Service Industry Volume (K Unit) Forecast, by Application 2019 & 2032
- Table 61: Rest of Asia Pacific Smart Home Installation Service Industry Revenue (Million) Forecast, by Application 2019 & 2032
- Table 62: Rest of Asia Pacific Smart Home Installation Service Industry Volume (K Unit) Forecast, by Application 2019 & 2032
- Table 63: Global Smart Home Installation Service Industry Revenue Million Forecast, by Country 2019 & 2032
- Table 64: Global Smart Home Installation Service Industry Volume K Unit Forecast, by Country 2019 & 2032
- Table 65: Brazil Smart Home Installation Service Industry Revenue (Million) Forecast, by Application 2019 & 2032
- Table 66: Brazil Smart Home Installation Service Industry Volume (K Unit) Forecast, by Application 2019 & 2032
- Table 67: Argentina Smart Home Installation Service Industry Revenue (Million) Forecast, by Application 2019 & 2032
- Table 68: Argentina Smart Home Installation Service Industry Volume (K Unit) Forecast, by Application 2019 & 2032
- Table 69: Peru Smart Home Installation Service Industry Revenue (Million) Forecast, by Application 2019 & 2032
- Table 70: Peru Smart Home Installation Service Industry Volume (K Unit) Forecast, by Application 2019 & 2032
- Table 71: Chile Smart Home Installation Service Industry Revenue (Million) Forecast, by Application 2019 & 2032
- Table 72: Chile Smart Home Installation Service Industry Volume (K Unit) Forecast, by Application 2019 & 2032
- Table 73: Colombia Smart Home Installation Service Industry Revenue (Million) Forecast, by Application 2019 & 2032
- Table 74: Colombia Smart Home Installation Service Industry Volume (K Unit) Forecast, by Application 2019 & 2032
- Table 75: Ecuador Smart Home Installation Service Industry Revenue (Million) Forecast, by Application 2019 & 2032
- Table 76: Ecuador Smart Home Installation Service Industry Volume (K Unit) Forecast, by Application 2019 & 2032
- Table 77: Venezuela Smart Home Installation Service Industry Revenue (Million) Forecast, by Application 2019 & 2032
- Table 78: Venezuela Smart Home Installation Service Industry Volume (K Unit) Forecast, by Application 2019 & 2032
- Table 79: Rest of South America Smart Home Installation Service Industry Revenue (Million) Forecast, by Application 2019 & 2032
- Table 80: Rest of South America Smart Home Installation Service Industry Volume (K Unit) Forecast, by Application 2019 & 2032
- Table 81: Global Smart Home Installation Service Industry Revenue Million Forecast, by Country 2019 & 2032
- Table 82: Global Smart Home Installation Service Industry Volume K Unit Forecast, by Country 2019 & 2032
- Table 83: United States Smart Home Installation Service Industry Revenue (Million) Forecast, by Application 2019 & 2032
- Table 84: United States Smart Home Installation Service Industry Volume (K Unit) Forecast, by Application 2019 & 2032
- Table 85: Canada Smart Home Installation Service Industry Revenue (Million) Forecast, by Application 2019 & 2032
- Table 86: Canada Smart Home Installation Service Industry Volume (K Unit) Forecast, by Application 2019 & 2032
- Table 87: Mexico Smart Home Installation Service Industry Revenue (Million) Forecast, by Application 2019 & 2032
- Table 88: Mexico Smart Home Installation Service Industry Volume (K Unit) Forecast, by Application 2019 & 2032
- Table 89: Global Smart Home Installation Service Industry Revenue Million Forecast, by Country 2019 & 2032
- Table 90: Global Smart Home Installation Service Industry Volume K Unit Forecast, by Country 2019 & 2032
- Table 91: United Arab Emirates Smart Home Installation Service Industry Revenue (Million) Forecast, by Application 2019 & 2032
- Table 92: United Arab Emirates Smart Home Installation Service Industry Volume (K Unit) Forecast, by Application 2019 & 2032
- Table 93: Saudi Arabia Smart Home Installation Service Industry Revenue (Million) Forecast, by Application 2019 & 2032
- Table 94: Saudi Arabia Smart Home Installation Service Industry Volume (K Unit) Forecast, by Application 2019 & 2032
- Table 95: South Africa Smart Home Installation Service Industry Revenue (Million) Forecast, by Application 2019 & 2032
- Table 96: South Africa Smart Home Installation Service Industry Volume (K Unit) Forecast, by Application 2019 & 2032
- Table 97: Rest of Middle East and Africa Smart Home Installation Service Industry Revenue (Million) Forecast, by Application 2019 & 2032
- Table 98: Rest of Middle East and Africa Smart Home Installation Service Industry Volume (K Unit) Forecast, by Application 2019 & 2032
- Table 99: Global Smart Home Installation Service Industry Revenue Million Forecast, by System 2019 & 2032
- Table 100: Global Smart Home Installation Service Industry Volume K Unit Forecast, by System 2019 & 2032
- Table 101: Global Smart Home Installation Service Industry Revenue Million Forecast, by Channel 2019 & 2032
- Table 102: Global Smart Home Installation Service Industry Volume K Unit Forecast, by Channel 2019 & 2032
- Table 103: Global Smart Home Installation Service Industry Revenue Million Forecast, by Country 2019 & 2032
- Table 104: Global Smart Home Installation Service Industry Volume K Unit Forecast, by Country 2019 & 2032
- Table 105: Global Smart Home Installation Service Industry Revenue Million Forecast, by System 2019 & 2032
- Table 106: Global Smart Home Installation Service Industry Volume K Unit Forecast, by System 2019 & 2032
- Table 107: Global Smart Home Installation Service Industry Revenue Million Forecast, by Channel 2019 & 2032
- Table 108: Global Smart Home Installation Service Industry Volume K Unit Forecast, by Channel 2019 & 2032
- Table 109: Global Smart Home Installation Service Industry Revenue Million Forecast, by Country 2019 & 2032
- Table 110: Global Smart Home Installation Service Industry Volume K Unit Forecast, by Country 2019 & 2032
- Table 111: Global Smart Home Installation Service Industry Revenue Million Forecast, by System 2019 & 2032
- Table 112: Global Smart Home Installation Service Industry Volume K Unit Forecast, by System 2019 & 2032
- Table 113: Global Smart Home Installation Service Industry Revenue Million Forecast, by Channel 2019 & 2032
- Table 114: Global Smart Home Installation Service Industry Volume K Unit Forecast, by Channel 2019 & 2032
- Table 115: Global Smart Home Installation Service Industry Revenue Million Forecast, by Country 2019 & 2032
- Table 116: Global Smart Home Installation Service Industry Volume K Unit Forecast, by Country 2019 & 2032
- Table 117: Global Smart Home Installation Service Industry Revenue Million Forecast, by System 2019 & 2032
- Table 118: Global Smart Home Installation Service Industry Volume K Unit Forecast, by System 2019 & 2032
- Table 119: Global Smart Home Installation Service Industry Revenue Million Forecast, by Channel 2019 & 2032
- Table 120: Global Smart Home Installation Service Industry Volume K Unit Forecast, by Channel 2019 & 2032
- Table 121: Global Smart Home Installation Service Industry Revenue Million Forecast, by Country 2019 & 2032
- Table 122: Global Smart Home Installation Service Industry Volume K Unit Forecast, by Country 2019 & 2032
- Table 123: Global Smart Home Installation Service Industry Revenue Million Forecast, by System 2019 & 2032
- Table 124: Global Smart Home Installation Service Industry Volume K Unit Forecast, by System 2019 & 2032
- Table 125: Global Smart Home Installation Service Industry Revenue Million Forecast, by Channel 2019 & 2032
- Table 126: Global Smart Home Installation Service Industry Volume K Unit Forecast, by Channel 2019 & 2032
- Table 127: Global Smart Home Installation Service Industry Revenue Million Forecast, by Country 2019 & 2032
- Table 128: Global Smart Home Installation Service Industry Volume K Unit Forecast, by Country 2019 & 2032
Frequently Asked Questions
1. What is the projected Compound Annual Growth Rate (CAGR) of the Smart Home Installation Service Industry?
The projected CAGR is approximately 25.00%.
2. Which companies are prominent players in the Smart Home Installation Service Industry?
Key companies in the market include Red River Electric Inc, PULS Group, Insteon Inc, HelloTech Inc, Meyer Electrical Services Inc, Miami Electric Masters Inc, Calix Inc, Vivint Inc, Finite Solutions LLC, Handy Inc, Smartify Home Automation Limited.
3. What are the main segments of the Smart Home Installation Service Industry?
The market segments include System, Channel.
4. Can you provide details about the market size?
The market size is estimated to be USD XX Million as of 2022.
5. What are some drivers contributing to market growth?
Increased Number of Cognitive Systems; Adoption of Intelligent Embedded Devices; Growing consumer preference towards E-Commerce.
6. What are the notable trends driving market growth?
E-commerce Boosting the Growth of Smart Home Installation Service Market.
7. Are there any restraints impacting market growth?
Data Privacy and Security Concerns.
8. Can you provide examples of recent developments in the market?
July 2022 - Xiaomi unveiled a new product In its native market of China. The new Xiaomi Smart Home Display 6 has just been introduced on the company's official Weibo account.
9. What pricing options are available for accessing the report?
Pricing options include single-user, multi-user, and enterprise licenses priced at USD 4750, USD 5250, and USD 8750 respectively.
10. Is the market size provided in terms of value or volume?
The market size is provided in terms of value, measured in Million and volume, measured in K Unit.
11. Are there any specific market keywords associated with the report?
Yes, the market keyword associated with the report is "Smart Home Installation Service Industry," which aids in identifying and referencing the specific market segment covered.
12. How do I determine which pricing option suits my needs best?
The pricing options vary based on user requirements and access needs. Individual users may opt for single-user licenses, while businesses requiring broader access may choose multi-user or enterprise licenses for cost-effective access to the report.
13. Are there any additional resources or data provided in the Smart Home Installation Service Industry report?
While the report offers comprehensive insights, it's advisable to review the specific contents or supplementary materials provided to ascertain if additional resources or data are available.
14. How can I stay updated on further developments or reports in the Smart Home Installation Service Industry?
To stay informed about further developments, trends, and reports in the Smart Home Installation Service Industry, consider subscribing to industry newsletters, following relevant companies and organizations, or regularly checking reputable industry news sources and publications.
Methodology
Step 1 - Identification of Relevant Samples Size from Population Database


Step 2 - Approaches for Defining Global Market Size (Value, Volume* & Price*)

Note*: In applicable scenarios
Step 3 - Data Sources
Primary Research
- Web Analytics
- Survey Reports
- Research Institute
- Latest Research Reports
- Opinion Leaders
Secondary Research
- Annual Reports
- White Paper
- Latest Press Release
- Industry Association
- Paid Database
- Investor Presentations

Step 4 - Data Triangulation
Involves using different sources of information in order to increase the validity of a study
These sources are likely to be stakeholders in a program - participants, other researchers, program staff, other community members, and so on.
Then we put all data in single framework & apply various statistical tools to find out the dynamic on the market.
During the analysis stage, feedback from the stakeholder groups would be compared to determine areas of agreement as well as areas of divergence


