
Key Insights
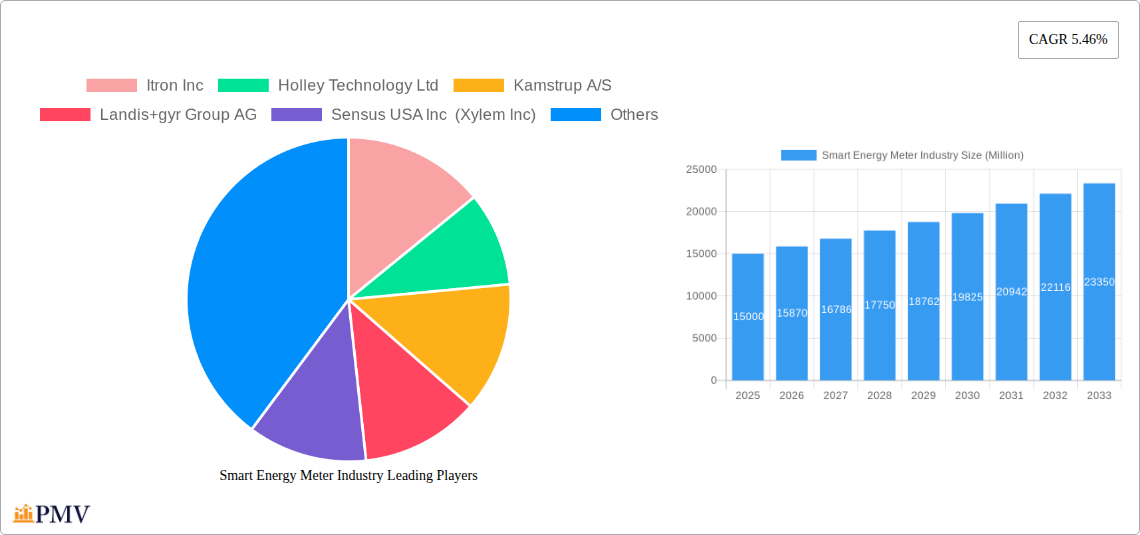
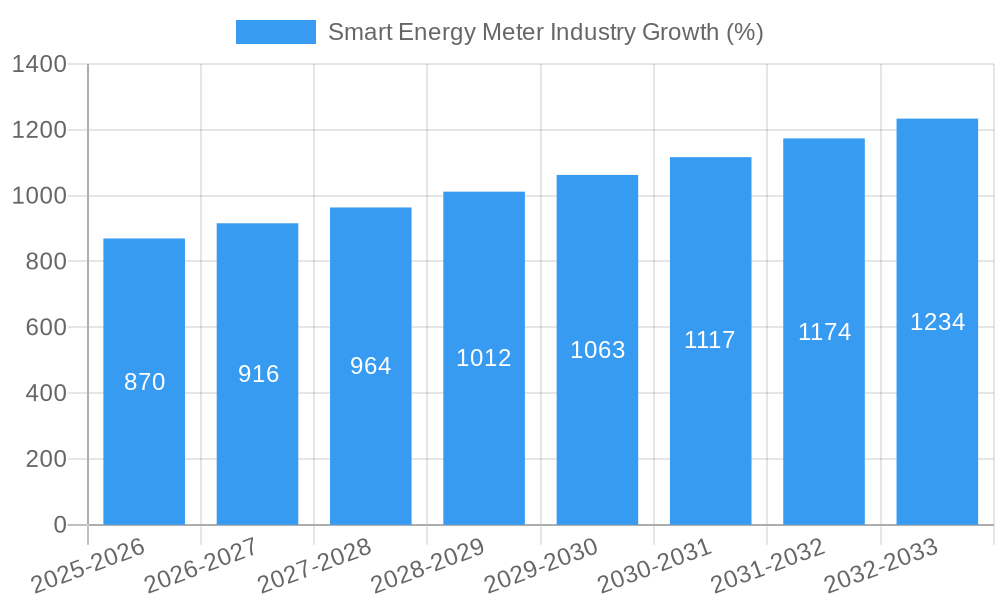
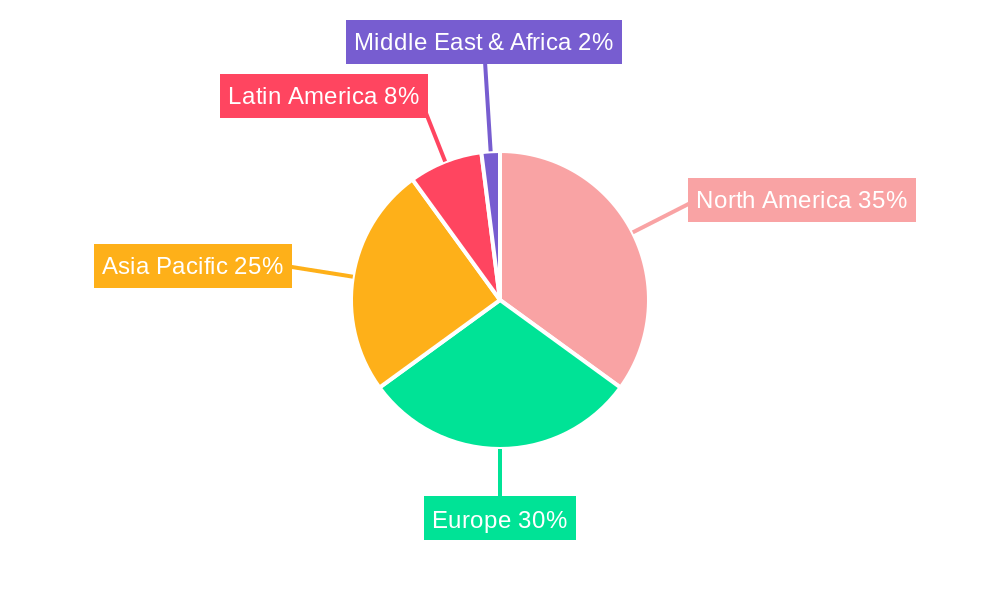
The smart energy meter market is experiencing robust growth, driven by the increasing demand for efficient energy management and grid modernization initiatives globally. A CAGR of 5.46% from 2019 to 2024 suggests a significant market expansion, and this momentum is projected to continue through 2033. The rising adoption of smart grids, coupled with government regulations promoting energy efficiency and renewable energy integration, are key drivers. Further fueling this growth is the increasing penetration of smart homes and buildings, requiring advanced metering infrastructure for optimized energy consumption monitoring and control. Residential end-users are a significant market segment, followed by commercial and industrial applications. The competitive landscape is characterized by a mix of established players like Itron, Landis+Gyr, and Honeywell (through Elster), and emerging regional players in Asia, particularly China. Technological advancements, such as the incorporation of advanced communication protocols (e.g., cellular, AMI) and the integration of smart home ecosystems, are shaping market trends. However, the high initial investment costs associated with smart meter deployment and the potential for cybersecurity vulnerabilities can act as restraints in certain regions. Geographic expansion into developing economies presents a significant opportunity for growth, as these regions often lack efficient metering infrastructure and are actively investing in grid modernization. North America and Europe currently hold significant market shares, but rapid growth is anticipated in Asia Pacific and Latin America, driven by increasing urbanization and expanding energy consumption.
The market segmentation reveals a diverse application landscape. Residential adoption is primarily driven by consumer demand for energy savings and monitoring capabilities, while commercial and industrial sectors benefit from enhanced energy efficiency, cost optimization, and improved grid stability. The continuous evolution of smart meter technology, including advanced analytics and integration with energy storage systems, offers further growth potential. The strategic partnerships and mergers and acquisitions within the industry are likely to intensify competition and drive innovation in the coming years. This continued evolution and adoption will contribute to the sustained expansion of the smart energy meter market, making it an attractive sector for investment and technological advancements.
Smart Energy Meter Industry: A Comprehensive Market Report (2019-2033)
This detailed report provides a comprehensive analysis of the global smart energy meter industry, offering invaluable insights for stakeholders seeking to understand market dynamics, competitive landscapes, and future growth trajectories. The study period covers 2019-2033, with 2025 as the base and estimated year. The forecast period spans 2025-2033, while the historical period encompasses 2019-2024. The report projects a market valued at xx Million by 2033, exhibiting a CAGR of xx% during the forecast period.
Smart Energy Meter Industry Market Structure & Competitive Dynamics
This section analyzes the competitive landscape of the smart energy meter market, encompassing market concentration, innovation ecosystems, regulatory frameworks, product substitutes, end-user trends, and mergers and acquisitions (M&A) activities. The global smart energy meter market exhibits a moderately consolidated structure with key players holding significant market shares. For example, Itron Inc., Landis+gyr Group AG, and Kamstrup A/S collectively account for approximately xx% of the global market share in 2024. However, the presence of numerous regional and local players fosters intense competition, particularly in developing economies.
The industry's innovation ecosystem is dynamic, driven by continuous advancements in communication technologies (e.g., NB-IoT, LoRaWAN), data analytics, and smart grid integration. Regulatory frameworks, particularly those promoting energy efficiency and grid modernization, significantly influence market growth. Smart energy meters face competition from traditional electromechanical meters; however, government incentives and the increasing demand for real-time energy consumption data are driving adoption. End-user trends, particularly the growing preference for energy-efficient solutions and remote monitoring capabilities, fuel market expansion. M&A activities play a vital role in shaping market consolidation and technological advancements. In recent years, significant M&A deals have involved investments totaling xx Million, primarily focused on expanding product portfolios and geographic reach.
Smart Energy Meter Industry Industry Trends & Insights
The smart energy meter market is experiencing robust growth, driven by several key factors. The increasing focus on grid modernization and smart grid initiatives by governments globally is a major catalyst. Furthermore, rising energy costs and growing environmental concerns are pushing consumers and businesses to adopt energy-efficient solutions. Technological advancements, such as the development of advanced metering infrastructure (AMI) and the integration of smart meters with renewable energy sources, further accelerate market expansion.
The market exhibits a strong preference for advanced features such as real-time data analytics, remote meter reading capabilities, and two-way communication functionalities. Competitive dynamics remain intense, with companies continuously striving to improve product functionalities, reduce costs, and enhance customer service. This market demonstrates a significant market penetration rate, particularly in developed economies, with xx% of households utilizing smart energy meters in 2024. The overall market is expected to experience considerable growth, with a projected CAGR of xx% from 2025 to 2033.
Dominant Markets & Segments in Smart Energy Meter Industry
The residential segment dominates the smart energy meter market, accounting for approximately xx Million in revenue in 2024. This dominance is fueled by factors such as rising energy awareness among consumers, government initiatives promoting energy conservation, and the availability of cost-effective smart meters for residential applications. Key drivers for the residential segment include:
- Government subsidies and incentives: Many governments offer financial assistance to encourage the adoption of smart meters.
- Growing energy awareness: Consumers are increasingly concerned about their energy consumption and costs.
- Improved energy efficiency: Smart meters allow for better monitoring and management of energy use, leading to savings.
The commercial and industrial segments are also witnessing significant growth, although at a slower pace compared to the residential segment. This growth is primarily driven by the need for precise energy consumption monitoring, efficient energy management, and improved grid stability within commercial and industrial facilities.
Geographically, North America and Europe held the largest market shares in 2024, driven by advanced infrastructure development and strong regulatory support. However, Asia-Pacific is projected to witness the highest growth rate during the forecast period, driven by rapid urbanization, expanding energy infrastructure, and supportive government policies.
Smart Energy Meter Industry Product Innovations
Recent innovations in smart energy meters are focused on improving communication technologies, data analytics capabilities, and cybersecurity features. Advanced metering infrastructure (AMI) systems are becoming increasingly sophisticated, incorporating functionalities such as real-time data acquisition, remote meter reading, and fault detection. New smart meters are being designed to integrate with renewable energy sources and smart grid technologies, optimizing energy distribution and enhancing grid efficiency. This convergence of technologies facilitates better grid management and promotes sustainable energy practices, thereby driving market growth. The integration of advanced analytics also allows utilities to proactively identify and address potential grid issues, minimizing disruptions and enhancing service reliability.
Report Segmentation & Scope
This report segments the smart energy meter market by end-user:
Residential: This segment accounts for the largest market share, driven by rising consumer demand for energy efficiency and smart home technologies. The market size is projected to reach xx Million by 2033. Competitive dynamics are characterized by a large number of players offering a wide range of products and services.
Commercial: This segment is experiencing steady growth, driven by increasing energy costs and the need for efficient energy management in commercial buildings. The market is projected to reach xx Million by 2033. The competitive landscape is relatively concentrated, with a few major players dominating the market.
Industrial: The industrial segment represents a significant growth opportunity, driven by the need for real-time energy monitoring and management in industrial facilities. The market size is estimated to reach xx Million by 2033. The market is dominated by a smaller group of specialized vendors offering advanced solutions.
Key Drivers of Smart Energy Meter Industry Growth
Several key factors are driving the growth of the smart energy meter industry. Technological advancements, such as the development of advanced communication protocols and data analytics capabilities, are enabling more efficient and reliable energy management. Stringent government regulations promoting grid modernization and energy efficiency are also contributing to market expansion. Furthermore, rising energy prices and increased environmental awareness are encouraging consumers and businesses to adopt energy-saving technologies, further boosting market growth. Examples include government mandates for AMI deployment in several countries and the growing adoption of renewable energy sources.
Challenges in the Smart Energy Meter Industry Sector
Despite significant growth potential, the smart energy meter industry faces certain challenges. High initial investment costs associated with infrastructure upgrades and smart meter deployment can be a barrier to adoption, particularly in developing countries. Supply chain disruptions and the complexity of integrating smart meters with existing grid infrastructure also pose significant hurdles. Furthermore, cybersecurity concerns related to data privacy and grid security are crucial considerations that require robust mitigation strategies. These challenges can lead to delays in project implementation and negatively impact overall market growth. The estimated impact of these challenges on the market is an estimated xx% reduction in the projected growth rate.
Leading Players in the Smart Energy Meter Industry Market
- Itron Inc.
- Holley Technology Ltd
- Kamstrup A/S
- Landis+gyr Group AG
- Sensus USA Inc (Xylem Inc)
- Nanjing Xinlian Electronics Co Ltd
- Sagemcom SAS
- Jiangsu Linyang Energy Co Ltd
- Elster Group GMBH (Honeywell International Inc)
- Ningbo Sanxing Electric Co Ltd
- Shenzhen Hemei Group Co Ltd
- Wasion Group Holdings
- Hexing Electric Company Ltd
Key Developments in Smart Energy Meter Industry Sector
August 2022: Adani Electricity Mumbai Limited (AEML) announced a USD 60 Million investment to install seven lakh smart meters in Mumbai, India, by the end of 2023. This significantly boosts the smart meter market in India.
April 2021: Itron launched a new residential smart electricity meter (eHZ-B) for German utilities, supporting advanced metering infrastructure across Europe and furthering the energy transition. This highlights the ongoing product innovation and expansion in the European market.
Strategic Smart Energy Meter Industry Market Outlook
The smart energy meter market presents significant growth opportunities in the coming years. Continued investments in smart grid infrastructure, coupled with increasing government regulations and consumer awareness, will drive market expansion. The integration of smart meters with other smart city initiatives and the development of advanced analytics capabilities will further enhance market potential. Strategic opportunities lie in focusing on innovative product development, expanding into emerging markets, and strengthening partnerships with utilities and technology providers. The market is poised for robust growth, driven by the ongoing transition towards sustainable and efficient energy management practices.
Smart Energy Meter Industry Segmentation
-
1. End-user
- 1.1. Residential
- 1.2. Commercial
- 1.3. Industrial
Smart Energy Meter Industry Segmentation By Geography
-
1. North America
- 1.1. United States
- 1.2. Canada
-
2. Europe
- 2.1. United Kingdom
- 2.2. Spain
- 2.3. Germany
- 2.4. Italy
- 2.5. France
- 2.6. Turkey
- 2.7. Nordics
- 2.8. Benelux
- 2.9. Rest of Europe
-
3. Asia Pacific
- 3.1. China
- 3.2. India
- 3.3. Japan
- 3.4. Australia and New Zealand
- 3.5. South Korea
- 3.6. Southeast Asia
- 4. Rest of Asia Pacific
-
5. Latin America
- 5.1. Brazil
- 5.2. Mexico
- 5.3. Columbia
- 5.4. Chile
- 5.5. Rest of Latin America
- 6. Middle East
-
7. GCC
- 7.1. South Africa
- 7.2. Egypt
- 7.3. Rest of Africa
- 7.4. Rest of Middle East
Smart Energy Meter Industry REPORT HIGHLIGHTS
| Aspects | Details |
|---|---|
| Study Period | 2019-2033 |
| Base Year | 2024 |
| Estimated Year | 2025 |
| Forecast Period | 2025-2033 |
| Historical Period | 2019-2024 |
| Growth Rate | CAGR of 5.46% from 2019-2033 |
| Segmentation |
|
Table of Contents
- 1. Introduction
- 1.1. Research Scope
- 1.2. Market Segmentation
- 1.3. Research Methodology
- 1.4. Definitions and Assumptions
- 2. Executive Summary
- 2.1. Introduction
- 3. Market Dynamics
- 3.1. Introduction
- 3.2. Market Drivers
- 3.2.1. Supportive Government Regulations in Key Regions; Rise in Smart City Deployment
- 3.3. Market Restrains
- 3.3.1. High Costs and Security Concerns; Integration Difficulties with Smart Meters
- 3.4. Market Trends
- 3.4.1. Residential Segment to Register Significant Growing
- 4. Market Factor Analysis
- 4.1. Porters Five Forces
- 4.2. Supply/Value Chain
- 4.3. PESTEL analysis
- 4.4. Market Entropy
- 4.5. Patent/Trademark Analysis
- 5. Global Smart Energy Meter Industry Analysis, Insights and Forecast, 2019-2031
- 5.1. Market Analysis, Insights and Forecast - by End-user
- 5.1.1. Residential
- 5.1.2. Commercial
- 5.1.3. Industrial
- 5.2. Market Analysis, Insights and Forecast - by Region
- 5.2.1. North America
- 5.2.2. Europe
- 5.2.3. Asia Pacific
- 5.2.4. Rest of Asia Pacific
- 5.2.5. Latin America
- 5.2.6. Middle East
- 5.2.7. GCC
- 5.1. Market Analysis, Insights and Forecast - by End-user
- 6. North America Smart Energy Meter Industry Analysis, Insights and Forecast, 2019-2031
- 6.1. Market Analysis, Insights and Forecast - by End-user
- 6.1.1. Residential
- 6.1.2. Commercial
- 6.1.3. Industrial
- 6.1. Market Analysis, Insights and Forecast - by End-user
- 7. Europe Smart Energy Meter Industry Analysis, Insights and Forecast, 2019-2031
- 7.1. Market Analysis, Insights and Forecast - by End-user
- 7.1.1. Residential
- 7.1.2. Commercial
- 7.1.3. Industrial
- 7.1. Market Analysis, Insights and Forecast - by End-user
- 8. Asia Pacific Smart Energy Meter Industry Analysis, Insights and Forecast, 2019-2031
- 8.1. Market Analysis, Insights and Forecast - by End-user
- 8.1.1. Residential
- 8.1.2. Commercial
- 8.1.3. Industrial
- 8.1. Market Analysis, Insights and Forecast - by End-user
- 9. Rest of Asia Pacific Smart Energy Meter Industry Analysis, Insights and Forecast, 2019-2031
- 9.1. Market Analysis, Insights and Forecast - by End-user
- 9.1.1. Residential
- 9.1.2. Commercial
- 9.1.3. Industrial
- 9.1. Market Analysis, Insights and Forecast - by End-user
- 10. Latin America Smart Energy Meter Industry Analysis, Insights and Forecast, 2019-2031
- 10.1. Market Analysis, Insights and Forecast - by End-user
- 10.1.1. Residential
- 10.1.2. Commercial
- 10.1.3. Industrial
- 10.1. Market Analysis, Insights and Forecast - by End-user
- 11. Middle East Smart Energy Meter Industry Analysis, Insights and Forecast, 2019-2031
- 11.1. Market Analysis, Insights and Forecast - by End-user
- 11.1.1. Residential
- 11.1.2. Commercial
- 11.1.3. Industrial
- 11.1. Market Analysis, Insights and Forecast - by End-user
- 12. GCC Smart Energy Meter Industry Analysis, Insights and Forecast, 2019-2031
- 12.1. Market Analysis, Insights and Forecast - by End-user
- 12.1.1. Residential
- 12.1.2. Commercial
- 12.1.3. Industrial
- 12.1. Market Analysis, Insights and Forecast - by End-user
- 13. North America Smart Energy Meter Industry Analysis, Insights and Forecast, 2019-2031
- 13.1. Market Analysis, Insights and Forecast - By Country/Sub-region
- 13.1.1 United States
- 13.1.2 Canada
- 14. Europe Smart Energy Meter Industry Analysis, Insights and Forecast, 2019-2031
- 14.1. Market Analysis, Insights and Forecast - By Country/Sub-region
- 14.1.1 United Kingdom
- 14.1.2 Spain
- 14.1.3 Germany
- 14.1.4 Italy
- 14.1.5 France
- 14.1.6 Turkey
- 14.1.7 Nordics
- 14.1.8 Benelux
- 14.1.9 Rest of Europe
- 15. Asia Pacific Smart Energy Meter Industry Analysis, Insights and Forecast, 2019-2031
- 15.1. Market Analysis, Insights and Forecast - By Country/Sub-region
- 15.1.1 China
- 15.1.2 India
- 15.1.3 Japan
- 15.1.4 Australia and New Zealand
- 15.1.5 South Korea
- 15.1.6 Southeast Asia
- 16. Rest of Asia Pacific Smart Energy Meter Industry Analysis, Insights and Forecast, 2019-2031
- 16.1. Market Analysis, Insights and Forecast - By Country/Sub-region
- 16.1.1.
- 17. Latin America Smart Energy Meter Industry Analysis, Insights and Forecast, 2019-2031
- 17.1. Market Analysis, Insights and Forecast - By Country/Sub-region
- 17.1.1 Brazil
- 17.1.2 Mexico
- 17.1.3 Columbia
- 17.1.4 Chile
- 17.1.5 Rest of Latin America
- 18. Middle East Smart Energy Meter Industry Analysis, Insights and Forecast, 2019-2031
- 18.1. Market Analysis, Insights and Forecast - By Country/Sub-region
- 18.1.1.
- 19. GCC Smart Energy Meter Industry Analysis, Insights and Forecast, 2019-2031
- 19.1. Market Analysis, Insights and Forecast - By Country/Sub-region
- 19.1.1 South Africa
- 19.1.2 Egypt
- 19.1.3 Rest of Africa
- 19.1.4 Rest of Middle East
- 20. Competitive Analysis
- 20.1. Global Market Share Analysis 2024
- 20.2. Company Profiles
- 20.2.1 Itron Inc
- 20.2.1.1. Overview
- 20.2.1.2. Products
- 20.2.1.3. SWOT Analysis
- 20.2.1.4. Recent Developments
- 20.2.1.5. Financials (Based on Availability)
- 20.2.2 Holley Technology Ltd
- 20.2.2.1. Overview
- 20.2.2.2. Products
- 20.2.2.3. SWOT Analysis
- 20.2.2.4. Recent Developments
- 20.2.2.5. Financials (Based on Availability)
- 20.2.3 Kamstrup A/S
- 20.2.3.1. Overview
- 20.2.3.2. Products
- 20.2.3.3. SWOT Analysis
- 20.2.3.4. Recent Developments
- 20.2.3.5. Financials (Based on Availability)
- 20.2.4 Landis+gyr Group AG
- 20.2.4.1. Overview
- 20.2.4.2. Products
- 20.2.4.3. SWOT Analysis
- 20.2.4.4. Recent Developments
- 20.2.4.5. Financials (Based on Availability)
- 20.2.5 Sensus USA Inc (Xylem Inc)
- 20.2.5.1. Overview
- 20.2.5.2. Products
- 20.2.5.3. SWOT Analysis
- 20.2.5.4. Recent Developments
- 20.2.5.5. Financials (Based on Availability)
- 20.2.6 Nanjing Xinlian Electronics Co Ltd
- 20.2.6.1. Overview
- 20.2.6.2. Products
- 20.2.6.3. SWOT Analysis
- 20.2.6.4. Recent Developments
- 20.2.6.5. Financials (Based on Availability)
- 20.2.7 Sagemcom SAS
- 20.2.7.1. Overview
- 20.2.7.2. Products
- 20.2.7.3. SWOT Analysis
- 20.2.7.4. Recent Developments
- 20.2.7.5. Financials (Based on Availability)
- 20.2.8 Jiangsu Linyang Energy Co Ltd
- 20.2.8.1. Overview
- 20.2.8.2. Products
- 20.2.8.3. SWOT Analysis
- 20.2.8.4. Recent Developments
- 20.2.8.5. Financials (Based on Availability)
- 20.2.9 Elster Group GMBH (Honeywell International Inc )
- 20.2.9.1. Overview
- 20.2.9.2. Products
- 20.2.9.3. SWOT Analysis
- 20.2.9.4. Recent Developments
- 20.2.9.5. Financials (Based on Availability)
- 20.2.10 Ningbo Sanxing Electric Co Ltd
- 20.2.10.1. Overview
- 20.2.10.2. Products
- 20.2.10.3. SWOT Analysis
- 20.2.10.4. Recent Developments
- 20.2.10.5. Financials (Based on Availability)
- 20.2.11 Shenzhen Hemei Group Co Ltd*List Not Exhaustive
- 20.2.11.1. Overview
- 20.2.11.2. Products
- 20.2.11.3. SWOT Analysis
- 20.2.11.4. Recent Developments
- 20.2.11.5. Financials (Based on Availability)
- 20.2.12 Wasion Group Holdings
- 20.2.12.1. Overview
- 20.2.12.2. Products
- 20.2.12.3. SWOT Analysis
- 20.2.12.4. Recent Developments
- 20.2.12.5. Financials (Based on Availability)
- 20.2.13 Hexing Electric Company Ltd
- 20.2.13.1. Overview
- 20.2.13.2. Products
- 20.2.13.3. SWOT Analysis
- 20.2.13.4. Recent Developments
- 20.2.13.5. Financials (Based on Availability)
- 20.2.1 Itron Inc
List of Figures
- Figure 1: Global Smart Energy Meter Industry Revenue Breakdown (Million, %) by Region 2024 & 2032
- Figure 2: Global Smart Energy Meter Industry Volume Breakdown (Million, %) by Region 2024 & 2032
- Figure 3: North America Smart Energy Meter Industry Revenue (Million), by Country 2024 & 2032
- Figure 4: North America Smart Energy Meter Industry Volume (Million), by Country 2024 & 2032
- Figure 5: North America Smart Energy Meter Industry Revenue Share (%), by Country 2024 & 2032
- Figure 6: North America Smart Energy Meter Industry Volume Share (%), by Country 2024 & 2032
- Figure 7: Europe Smart Energy Meter Industry Revenue (Million), by Country 2024 & 2032
- Figure 8: Europe Smart Energy Meter Industry Volume (Million), by Country 2024 & 2032
- Figure 9: Europe Smart Energy Meter Industry Revenue Share (%), by Country 2024 & 2032
- Figure 10: Europe Smart Energy Meter Industry Volume Share (%), by Country 2024 & 2032
- Figure 11: Asia Pacific Smart Energy Meter Industry Revenue (Million), by Country 2024 & 2032
- Figure 12: Asia Pacific Smart Energy Meter Industry Volume (Million), by Country 2024 & 2032
- Figure 13: Asia Pacific Smart Energy Meter Industry Revenue Share (%), by Country 2024 & 2032
- Figure 14: Asia Pacific Smart Energy Meter Industry Volume Share (%), by Country 2024 & 2032
- Figure 15: Rest of Asia Pacific Smart Energy Meter Industry Revenue (Million), by Country 2024 & 2032
- Figure 16: Rest of Asia Pacific Smart Energy Meter Industry Volume (Million), by Country 2024 & 2032
- Figure 17: Rest of Asia Pacific Smart Energy Meter Industry Revenue Share (%), by Country 2024 & 2032
- Figure 18: Rest of Asia Pacific Smart Energy Meter Industry Volume Share (%), by Country 2024 & 2032
- Figure 19: Latin America Smart Energy Meter Industry Revenue (Million), by Country 2024 & 2032
- Figure 20: Latin America Smart Energy Meter Industry Volume (Million), by Country 2024 & 2032
- Figure 21: Latin America Smart Energy Meter Industry Revenue Share (%), by Country 2024 & 2032
- Figure 22: Latin America Smart Energy Meter Industry Volume Share (%), by Country 2024 & 2032
- Figure 23: Middle East Smart Energy Meter Industry Revenue (Million), by Country 2024 & 2032
- Figure 24: Middle East Smart Energy Meter Industry Volume (Million), by Country 2024 & 2032
- Figure 25: Middle East Smart Energy Meter Industry Revenue Share (%), by Country 2024 & 2032
- Figure 26: Middle East Smart Energy Meter Industry Volume Share (%), by Country 2024 & 2032
- Figure 27: GCC Smart Energy Meter Industry Revenue (Million), by Country 2024 & 2032
- Figure 28: GCC Smart Energy Meter Industry Volume (Million), by Country 2024 & 2032
- Figure 29: GCC Smart Energy Meter Industry Revenue Share (%), by Country 2024 & 2032
- Figure 30: GCC Smart Energy Meter Industry Volume Share (%), by Country 2024 & 2032
- Figure 31: North America Smart Energy Meter Industry Revenue (Million), by End-user 2024 & 2032
- Figure 32: North America Smart Energy Meter Industry Volume (Million), by End-user 2024 & 2032
- Figure 33: North America Smart Energy Meter Industry Revenue Share (%), by End-user 2024 & 2032
- Figure 34: North America Smart Energy Meter Industry Volume Share (%), by End-user 2024 & 2032
- Figure 35: North America Smart Energy Meter Industry Revenue (Million), by Country 2024 & 2032
- Figure 36: North America Smart Energy Meter Industry Volume (Million), by Country 2024 & 2032
- Figure 37: North America Smart Energy Meter Industry Revenue Share (%), by Country 2024 & 2032
- Figure 38: North America Smart Energy Meter Industry Volume Share (%), by Country 2024 & 2032
- Figure 39: Europe Smart Energy Meter Industry Revenue (Million), by End-user 2024 & 2032
- Figure 40: Europe Smart Energy Meter Industry Volume (Million), by End-user 2024 & 2032
- Figure 41: Europe Smart Energy Meter Industry Revenue Share (%), by End-user 2024 & 2032
- Figure 42: Europe Smart Energy Meter Industry Volume Share (%), by End-user 2024 & 2032
- Figure 43: Europe Smart Energy Meter Industry Revenue (Million), by Country 2024 & 2032
- Figure 44: Europe Smart Energy Meter Industry Volume (Million), by Country 2024 & 2032
- Figure 45: Europe Smart Energy Meter Industry Revenue Share (%), by Country 2024 & 2032
- Figure 46: Europe Smart Energy Meter Industry Volume Share (%), by Country 2024 & 2032
- Figure 47: Asia Pacific Smart Energy Meter Industry Revenue (Million), by End-user 2024 & 2032
- Figure 48: Asia Pacific Smart Energy Meter Industry Volume (Million), by End-user 2024 & 2032
- Figure 49: Asia Pacific Smart Energy Meter Industry Revenue Share (%), by End-user 2024 & 2032
- Figure 50: Asia Pacific Smart Energy Meter Industry Volume Share (%), by End-user 2024 & 2032
- Figure 51: Asia Pacific Smart Energy Meter Industry Revenue (Million), by Country 2024 & 2032
- Figure 52: Asia Pacific Smart Energy Meter Industry Volume (Million), by Country 2024 & 2032
- Figure 53: Asia Pacific Smart Energy Meter Industry Revenue Share (%), by Country 2024 & 2032
- Figure 54: Asia Pacific Smart Energy Meter Industry Volume Share (%), by Country 2024 & 2032
- Figure 55: Rest of Asia Pacific Smart Energy Meter Industry Revenue (Million), by End-user 2024 & 2032
- Figure 56: Rest of Asia Pacific Smart Energy Meter Industry Volume (Million), by End-user 2024 & 2032
- Figure 57: Rest of Asia Pacific Smart Energy Meter Industry Revenue Share (%), by End-user 2024 & 2032
- Figure 58: Rest of Asia Pacific Smart Energy Meter Industry Volume Share (%), by End-user 2024 & 2032
- Figure 59: Rest of Asia Pacific Smart Energy Meter Industry Revenue (Million), by Country 2024 & 2032
- Figure 60: Rest of Asia Pacific Smart Energy Meter Industry Volume (Million), by Country 2024 & 2032
- Figure 61: Rest of Asia Pacific Smart Energy Meter Industry Revenue Share (%), by Country 2024 & 2032
- Figure 62: Rest of Asia Pacific Smart Energy Meter Industry Volume Share (%), by Country 2024 & 2032
- Figure 63: Latin America Smart Energy Meter Industry Revenue (Million), by End-user 2024 & 2032
- Figure 64: Latin America Smart Energy Meter Industry Volume (Million), by End-user 2024 & 2032
- Figure 65: Latin America Smart Energy Meter Industry Revenue Share (%), by End-user 2024 & 2032
- Figure 66: Latin America Smart Energy Meter Industry Volume Share (%), by End-user 2024 & 2032
- Figure 67: Latin America Smart Energy Meter Industry Revenue (Million), by Country 2024 & 2032
- Figure 68: Latin America Smart Energy Meter Industry Volume (Million), by Country 2024 & 2032
- Figure 69: Latin America Smart Energy Meter Industry Revenue Share (%), by Country 2024 & 2032
- Figure 70: Latin America Smart Energy Meter Industry Volume Share (%), by Country 2024 & 2032
- Figure 71: Middle East Smart Energy Meter Industry Revenue (Million), by End-user 2024 & 2032
- Figure 72: Middle East Smart Energy Meter Industry Volume (Million), by End-user 2024 & 2032
- Figure 73: Middle East Smart Energy Meter Industry Revenue Share (%), by End-user 2024 & 2032
- Figure 74: Middle East Smart Energy Meter Industry Volume Share (%), by End-user 2024 & 2032
- Figure 75: Middle East Smart Energy Meter Industry Revenue (Million), by Country 2024 & 2032
- Figure 76: Middle East Smart Energy Meter Industry Volume (Million), by Country 2024 & 2032
- Figure 77: Middle East Smart Energy Meter Industry Revenue Share (%), by Country 2024 & 2032
- Figure 78: Middle East Smart Energy Meter Industry Volume Share (%), by Country 2024 & 2032
- Figure 79: GCC Smart Energy Meter Industry Revenue (Million), by End-user 2024 & 2032
- Figure 80: GCC Smart Energy Meter Industry Volume (Million), by End-user 2024 & 2032
- Figure 81: GCC Smart Energy Meter Industry Revenue Share (%), by End-user 2024 & 2032
- Figure 82: GCC Smart Energy Meter Industry Volume Share (%), by End-user 2024 & 2032
- Figure 83: GCC Smart Energy Meter Industry Revenue (Million), by Country 2024 & 2032
- Figure 84: GCC Smart Energy Meter Industry Volume (Million), by Country 2024 & 2032
- Figure 85: GCC Smart Energy Meter Industry Revenue Share (%), by Country 2024 & 2032
- Figure 86: GCC Smart Energy Meter Industry Volume Share (%), by Country 2024 & 2032
List of Tables
- Table 1: Global Smart Energy Meter Industry Revenue Million Forecast, by Region 2019 & 2032
- Table 2: Global Smart Energy Meter Industry Volume Million Forecast, by Region 2019 & 2032
- Table 3: Global Smart Energy Meter Industry Revenue Million Forecast, by End-user 2019 & 2032
- Table 4: Global Smart Energy Meter Industry Volume Million Forecast, by End-user 2019 & 2032
- Table 5: Global Smart Energy Meter Industry Revenue Million Forecast, by Region 2019 & 2032
- Table 6: Global Smart Energy Meter Industry Volume Million Forecast, by Region 2019 & 2032
- Table 7: Global Smart Energy Meter Industry Revenue Million Forecast, by Country 2019 & 2032
- Table 8: Global Smart Energy Meter Industry Volume Million Forecast, by Country 2019 & 2032
- Table 9: United States Smart Energy Meter Industry Revenue (Million) Forecast, by Application 2019 & 2032
- Table 10: United States Smart Energy Meter Industry Volume (Million) Forecast, by Application 2019 & 2032
- Table 11: Canada Smart Energy Meter Industry Revenue (Million) Forecast, by Application 2019 & 2032
- Table 12: Canada Smart Energy Meter Industry Volume (Million) Forecast, by Application 2019 & 2032
- Table 13: Global Smart Energy Meter Industry Revenue Million Forecast, by Country 2019 & 2032
- Table 14: Global Smart Energy Meter Industry Volume Million Forecast, by Country 2019 & 2032
- Table 15: United Kingdom Smart Energy Meter Industry Revenue (Million) Forecast, by Application 2019 & 2032
- Table 16: United Kingdom Smart Energy Meter Industry Volume (Million) Forecast, by Application 2019 & 2032
- Table 17: Spain Smart Energy Meter Industry Revenue (Million) Forecast, by Application 2019 & 2032
- Table 18: Spain Smart Energy Meter Industry Volume (Million) Forecast, by Application 2019 & 2032
- Table 19: Germany Smart Energy Meter Industry Revenue (Million) Forecast, by Application 2019 & 2032
- Table 20: Germany Smart Energy Meter Industry Volume (Million) Forecast, by Application 2019 & 2032
- Table 21: Italy Smart Energy Meter Industry Revenue (Million) Forecast, by Application 2019 & 2032
- Table 22: Italy Smart Energy Meter Industry Volume (Million) Forecast, by Application 2019 & 2032
- Table 23: France Smart Energy Meter Industry Revenue (Million) Forecast, by Application 2019 & 2032
- Table 24: France Smart Energy Meter Industry Volume (Million) Forecast, by Application 2019 & 2032
- Table 25: Turkey Smart Energy Meter Industry Revenue (Million) Forecast, by Application 2019 & 2032
- Table 26: Turkey Smart Energy Meter Industry Volume (Million) Forecast, by Application 2019 & 2032
- Table 27: Nordics Smart Energy Meter Industry Revenue (Million) Forecast, by Application 2019 & 2032
- Table 28: Nordics Smart Energy Meter Industry Volume (Million) Forecast, by Application 2019 & 2032
- Table 29: Benelux Smart Energy Meter Industry Revenue (Million) Forecast, by Application 2019 & 2032
- Table 30: Benelux Smart Energy Meter Industry Volume (Million) Forecast, by Application 2019 & 2032
- Table 31: Rest of Europe Smart Energy Meter Industry Revenue (Million) Forecast, by Application 2019 & 2032
- Table 32: Rest of Europe Smart Energy Meter Industry Volume (Million) Forecast, by Application 2019 & 2032
- Table 33: Global Smart Energy Meter Industry Revenue Million Forecast, by Country 2019 & 2032
- Table 34: Global Smart Energy Meter Industry Volume Million Forecast, by Country 2019 & 2032
- Table 35: China Smart Energy Meter Industry Revenue (Million) Forecast, by Application 2019 & 2032
- Table 36: China Smart Energy Meter Industry Volume (Million) Forecast, by Application 2019 & 2032
- Table 37: India Smart Energy Meter Industry Revenue (Million) Forecast, by Application 2019 & 2032
- Table 38: India Smart Energy Meter Industry Volume (Million) Forecast, by Application 2019 & 2032
- Table 39: Japan Smart Energy Meter Industry Revenue (Million) Forecast, by Application 2019 & 2032
- Table 40: Japan Smart Energy Meter Industry Volume (Million) Forecast, by Application 2019 & 2032
- Table 41: Australia and New Zealand Smart Energy Meter Industry Revenue (Million) Forecast, by Application 2019 & 2032
- Table 42: Australia and New Zealand Smart Energy Meter Industry Volume (Million) Forecast, by Application 2019 & 2032
- Table 43: South Korea Smart Energy Meter Industry Revenue (Million) Forecast, by Application 2019 & 2032
- Table 44: South Korea Smart Energy Meter Industry Volume (Million) Forecast, by Application 2019 & 2032
- Table 45: Southeast Asia Smart Energy Meter Industry Revenue (Million) Forecast, by Application 2019 & 2032
- Table 46: Southeast Asia Smart Energy Meter Industry Volume (Million) Forecast, by Application 2019 & 2032
- Table 47: Global Smart Energy Meter Industry Revenue Million Forecast, by Country 2019 & 2032
- Table 48: Global Smart Energy Meter Industry Volume Million Forecast, by Country 2019 & 2032
- Table 49: Smart Energy Meter Industry Revenue (Million) Forecast, by Application 2019 & 2032
- Table 50: Smart Energy Meter Industry Volume (Million) Forecast, by Application 2019 & 2032
- Table 51: Global Smart Energy Meter Industry Revenue Million Forecast, by Country 2019 & 2032
- Table 52: Global Smart Energy Meter Industry Volume Million Forecast, by Country 2019 & 2032
- Table 53: Brazil Smart Energy Meter Industry Revenue (Million) Forecast, by Application 2019 & 2032
- Table 54: Brazil Smart Energy Meter Industry Volume (Million) Forecast, by Application 2019 & 2032
- Table 55: Mexico Smart Energy Meter Industry Revenue (Million) Forecast, by Application 2019 & 2032
- Table 56: Mexico Smart Energy Meter Industry Volume (Million) Forecast, by Application 2019 & 2032
- Table 57: Columbia Smart Energy Meter Industry Revenue (Million) Forecast, by Application 2019 & 2032
- Table 58: Columbia Smart Energy Meter Industry Volume (Million) Forecast, by Application 2019 & 2032
- Table 59: Chile Smart Energy Meter Industry Revenue (Million) Forecast, by Application 2019 & 2032
- Table 60: Chile Smart Energy Meter Industry Volume (Million) Forecast, by Application 2019 & 2032
- Table 61: Rest of Latin America Smart Energy Meter Industry Revenue (Million) Forecast, by Application 2019 & 2032
- Table 62: Rest of Latin America Smart Energy Meter Industry Volume (Million) Forecast, by Application 2019 & 2032
- Table 63: Global Smart Energy Meter Industry Revenue Million Forecast, by Country 2019 & 2032
- Table 64: Global Smart Energy Meter Industry Volume Million Forecast, by Country 2019 & 2032
- Table 65: Smart Energy Meter Industry Revenue (Million) Forecast, by Application 2019 & 2032
- Table 66: Smart Energy Meter Industry Volume (Million) Forecast, by Application 2019 & 2032
- Table 67: Global Smart Energy Meter Industry Revenue Million Forecast, by Country 2019 & 2032
- Table 68: Global Smart Energy Meter Industry Volume Million Forecast, by Country 2019 & 2032
- Table 69: South Africa Smart Energy Meter Industry Revenue (Million) Forecast, by Application 2019 & 2032
- Table 70: South Africa Smart Energy Meter Industry Volume (Million) Forecast, by Application 2019 & 2032
- Table 71: Egypt Smart Energy Meter Industry Revenue (Million) Forecast, by Application 2019 & 2032
- Table 72: Egypt Smart Energy Meter Industry Volume (Million) Forecast, by Application 2019 & 2032
- Table 73: Rest of Africa Smart Energy Meter Industry Revenue (Million) Forecast, by Application 2019 & 2032
- Table 74: Rest of Africa Smart Energy Meter Industry Volume (Million) Forecast, by Application 2019 & 2032
- Table 75: Rest of Middle East Smart Energy Meter Industry Revenue (Million) Forecast, by Application 2019 & 2032
- Table 76: Rest of Middle East Smart Energy Meter Industry Volume (Million) Forecast, by Application 2019 & 2032
- Table 77: Global Smart Energy Meter Industry Revenue Million Forecast, by End-user 2019 & 2032
- Table 78: Global Smart Energy Meter Industry Volume Million Forecast, by End-user 2019 & 2032
- Table 79: Global Smart Energy Meter Industry Revenue Million Forecast, by Country 2019 & 2032
- Table 80: Global Smart Energy Meter Industry Volume Million Forecast, by Country 2019 & 2032
- Table 81: United States Smart Energy Meter Industry Revenue (Million) Forecast, by Application 2019 & 2032
- Table 82: United States Smart Energy Meter Industry Volume (Million) Forecast, by Application 2019 & 2032
- Table 83: Canada Smart Energy Meter Industry Revenue (Million) Forecast, by Application 2019 & 2032
- Table 84: Canada Smart Energy Meter Industry Volume (Million) Forecast, by Application 2019 & 2032
- Table 85: Global Smart Energy Meter Industry Revenue Million Forecast, by End-user 2019 & 2032
- Table 86: Global Smart Energy Meter Industry Volume Million Forecast, by End-user 2019 & 2032
- Table 87: Global Smart Energy Meter Industry Revenue Million Forecast, by Country 2019 & 2032
- Table 88: Global Smart Energy Meter Industry Volume Million Forecast, by Country 2019 & 2032
- Table 89: United Kingdom Smart Energy Meter Industry Revenue (Million) Forecast, by Application 2019 & 2032
- Table 90: United Kingdom Smart Energy Meter Industry Volume (Million) Forecast, by Application 2019 & 2032
- Table 91: Spain Smart Energy Meter Industry Revenue (Million) Forecast, by Application 2019 & 2032
- Table 92: Spain Smart Energy Meter Industry Volume (Million) Forecast, by Application 2019 & 2032
- Table 93: Germany Smart Energy Meter Industry Revenue (Million) Forecast, by Application 2019 & 2032
- Table 94: Germany Smart Energy Meter Industry Volume (Million) Forecast, by Application 2019 & 2032
- Table 95: Italy Smart Energy Meter Industry Revenue (Million) Forecast, by Application 2019 & 2032
- Table 96: Italy Smart Energy Meter Industry Volume (Million) Forecast, by Application 2019 & 2032
- Table 97: France Smart Energy Meter Industry Revenue (Million) Forecast, by Application 2019 & 2032
- Table 98: France Smart Energy Meter Industry Volume (Million) Forecast, by Application 2019 & 2032
- Table 99: Turkey Smart Energy Meter Industry Revenue (Million) Forecast, by Application 2019 & 2032
- Table 100: Turkey Smart Energy Meter Industry Volume (Million) Forecast, by Application 2019 & 2032
- Table 101: Nordics Smart Energy Meter Industry Revenue (Million) Forecast, by Application 2019 & 2032
- Table 102: Nordics Smart Energy Meter Industry Volume (Million) Forecast, by Application 2019 & 2032
- Table 103: Benelux Smart Energy Meter Industry Revenue (Million) Forecast, by Application 2019 & 2032
- Table 104: Benelux Smart Energy Meter Industry Volume (Million) Forecast, by Application 2019 & 2032
- Table 105: Rest of Europe Smart Energy Meter Industry Revenue (Million) Forecast, by Application 2019 & 2032
- Table 106: Rest of Europe Smart Energy Meter Industry Volume (Million) Forecast, by Application 2019 & 2032
- Table 107: Global Smart Energy Meter Industry Revenue Million Forecast, by End-user 2019 & 2032
- Table 108: Global Smart Energy Meter Industry Volume Million Forecast, by End-user 2019 & 2032
- Table 109: Global Smart Energy Meter Industry Revenue Million Forecast, by Country 2019 & 2032
- Table 110: Global Smart Energy Meter Industry Volume Million Forecast, by Country 2019 & 2032
- Table 111: China Smart Energy Meter Industry Revenue (Million) Forecast, by Application 2019 & 2032
- Table 112: China Smart Energy Meter Industry Volume (Million) Forecast, by Application 2019 & 2032
- Table 113: India Smart Energy Meter Industry Revenue (Million) Forecast, by Application 2019 & 2032
- Table 114: India Smart Energy Meter Industry Volume (Million) Forecast, by Application 2019 & 2032
- Table 115: Japan Smart Energy Meter Industry Revenue (Million) Forecast, by Application 2019 & 2032
- Table 116: Japan Smart Energy Meter Industry Volume (Million) Forecast, by Application 2019 & 2032
- Table 117: Australia and New Zealand Smart Energy Meter Industry Revenue (Million) Forecast, by Application 2019 & 2032
- Table 118: Australia and New Zealand Smart Energy Meter Industry Volume (Million) Forecast, by Application 2019 & 2032
- Table 119: South Korea Smart Energy Meter Industry Revenue (Million) Forecast, by Application 2019 & 2032
- Table 120: South Korea Smart Energy Meter Industry Volume (Million) Forecast, by Application 2019 & 2032
- Table 121: Southeast Asia Smart Energy Meter Industry Revenue (Million) Forecast, by Application 2019 & 2032
- Table 122: Southeast Asia Smart Energy Meter Industry Volume (Million) Forecast, by Application 2019 & 2032
- Table 123: Global Smart Energy Meter Industry Revenue Million Forecast, by End-user 2019 & 2032
- Table 124: Global Smart Energy Meter Industry Volume Million Forecast, by End-user 2019 & 2032
- Table 125: Global Smart Energy Meter Industry Revenue Million Forecast, by Country 2019 & 2032
- Table 126: Global Smart Energy Meter Industry Volume Million Forecast, by Country 2019 & 2032
- Table 127: Global Smart Energy Meter Industry Revenue Million Forecast, by End-user 2019 & 2032
- Table 128: Global Smart Energy Meter Industry Volume Million Forecast, by End-user 2019 & 2032
- Table 129: Global Smart Energy Meter Industry Revenue Million Forecast, by Country 2019 & 2032
- Table 130: Global Smart Energy Meter Industry Volume Million Forecast, by Country 2019 & 2032
- Table 131: Brazil Smart Energy Meter Industry Revenue (Million) Forecast, by Application 2019 & 2032
- Table 132: Brazil Smart Energy Meter Industry Volume (Million) Forecast, by Application 2019 & 2032
- Table 133: Mexico Smart Energy Meter Industry Revenue (Million) Forecast, by Application 2019 & 2032
- Table 134: Mexico Smart Energy Meter Industry Volume (Million) Forecast, by Application 2019 & 2032
- Table 135: Columbia Smart Energy Meter Industry Revenue (Million) Forecast, by Application 2019 & 2032
- Table 136: Columbia Smart Energy Meter Industry Volume (Million) Forecast, by Application 2019 & 2032
- Table 137: Chile Smart Energy Meter Industry Revenue (Million) Forecast, by Application 2019 & 2032
- Table 138: Chile Smart Energy Meter Industry Volume (Million) Forecast, by Application 2019 & 2032
- Table 139: Rest of Latin America Smart Energy Meter Industry Revenue (Million) Forecast, by Application 2019 & 2032
- Table 140: Rest of Latin America Smart Energy Meter Industry Volume (Million) Forecast, by Application 2019 & 2032
- Table 141: Global Smart Energy Meter Industry Revenue Million Forecast, by End-user 2019 & 2032
- Table 142: Global Smart Energy Meter Industry Volume Million Forecast, by End-user 2019 & 2032
- Table 143: Global Smart Energy Meter Industry Revenue Million Forecast, by Country 2019 & 2032
- Table 144: Global Smart Energy Meter Industry Volume Million Forecast, by Country 2019 & 2032
- Table 145: Global Smart Energy Meter Industry Revenue Million Forecast, by End-user 2019 & 2032
- Table 146: Global Smart Energy Meter Industry Volume Million Forecast, by End-user 2019 & 2032
- Table 147: Global Smart Energy Meter Industry Revenue Million Forecast, by Country 2019 & 2032
- Table 148: Global Smart Energy Meter Industry Volume Million Forecast, by Country 2019 & 2032
- Table 149: South Africa Smart Energy Meter Industry Revenue (Million) Forecast, by Application 2019 & 2032
- Table 150: South Africa Smart Energy Meter Industry Volume (Million) Forecast, by Application 2019 & 2032
- Table 151: Egypt Smart Energy Meter Industry Revenue (Million) Forecast, by Application 2019 & 2032
- Table 152: Egypt Smart Energy Meter Industry Volume (Million) Forecast, by Application 2019 & 2032
- Table 153: Rest of Africa Smart Energy Meter Industry Revenue (Million) Forecast, by Application 2019 & 2032
- Table 154: Rest of Africa Smart Energy Meter Industry Volume (Million) Forecast, by Application 2019 & 2032
- Table 155: Rest of Middle East Smart Energy Meter Industry Revenue (Million) Forecast, by Application 2019 & 2032
- Table 156: Rest of Middle East Smart Energy Meter Industry Volume (Million) Forecast, by Application 2019 & 2032
Frequently Asked Questions
1. What is the projected Compound Annual Growth Rate (CAGR) of the Smart Energy Meter Industry?
The projected CAGR is approximately 5.46%.
2. Which companies are prominent players in the Smart Energy Meter Industry?
Key companies in the market include Itron Inc, Holley Technology Ltd, Kamstrup A/S, Landis+gyr Group AG, Sensus USA Inc (Xylem Inc), Nanjing Xinlian Electronics Co Ltd, Sagemcom SAS, Jiangsu Linyang Energy Co Ltd, Elster Group GMBH (Honeywell International Inc ), Ningbo Sanxing Electric Co Ltd, Shenzhen Hemei Group Co Ltd*List Not Exhaustive, Wasion Group Holdings, Hexing Electric Company Ltd.
3. What are the main segments of the Smart Energy Meter Industry?
The market segments include End-user.
4. Can you provide details about the market size?
The market size is estimated to be USD XX Million as of 2022.
5. What are some drivers contributing to market growth?
Supportive Government Regulations in Key Regions; Rise in Smart City Deployment.
6. What are the notable trends driving market growth?
Residential Segment to Register Significant Growing.
7. Are there any restraints impacting market growth?
High Costs and Security Concerns; Integration Difficulties with Smart Meters.
8. Can you provide examples of recent developments in the market?
August 2022 - Adani Electricity Mumbai Limited (AEML) announced its plan to invest approximately INR 500 crore (~USD 60 million) to install smart meters in Mumbai, India. The company plans to install approximately seven lakh smart meters in the region by the end of 2023. The smart electricity meter of the company would enable the customers to get real-time updates on power consumption.
9. What pricing options are available for accessing the report?
Pricing options include single-user, multi-user, and enterprise licenses priced at USD 4750, USD 5250, and USD 8750 respectively.
10. Is the market size provided in terms of value or volume?
The market size is provided in terms of value, measured in Million and volume, measured in Million.
11. Are there any specific market keywords associated with the report?
Yes, the market keyword associated with the report is "Smart Energy Meter Industry," which aids in identifying and referencing the specific market segment covered.
12. How do I determine which pricing option suits my needs best?
The pricing options vary based on user requirements and access needs. Individual users may opt for single-user licenses, while businesses requiring broader access may choose multi-user or enterprise licenses for cost-effective access to the report.
13. Are there any additional resources or data provided in the Smart Energy Meter Industry report?
While the report offers comprehensive insights, it's advisable to review the specific contents or supplementary materials provided to ascertain if additional resources or data are available.
14. How can I stay updated on further developments or reports in the Smart Energy Meter Industry?
To stay informed about further developments, trends, and reports in the Smart Energy Meter Industry, consider subscribing to industry newsletters, following relevant companies and organizations, or regularly checking reputable industry news sources and publications.
Methodology
Step 1 - Identification of Relevant Samples Size from Population Database


Step 2 - Approaches for Defining Global Market Size (Value, Volume* & Price*)

Note*: In applicable scenarios
Step 3 - Data Sources
Primary Research
- Web Analytics
- Survey Reports
- Research Institute
- Latest Research Reports
- Opinion Leaders
Secondary Research
- Annual Reports
- White Paper
- Latest Press Release
- Industry Association
- Paid Database
- Investor Presentations

Step 4 - Data Triangulation
Involves using different sources of information in order to increase the validity of a study
These sources are likely to be stakeholders in a program - participants, other researchers, program staff, other community members, and so on.
Then we put all data in single framework & apply various statistical tools to find out the dynamic on the market.
During the analysis stage, feedback from the stakeholder groups would be compared to determine areas of agreement as well as areas of divergence


