
Key Insights
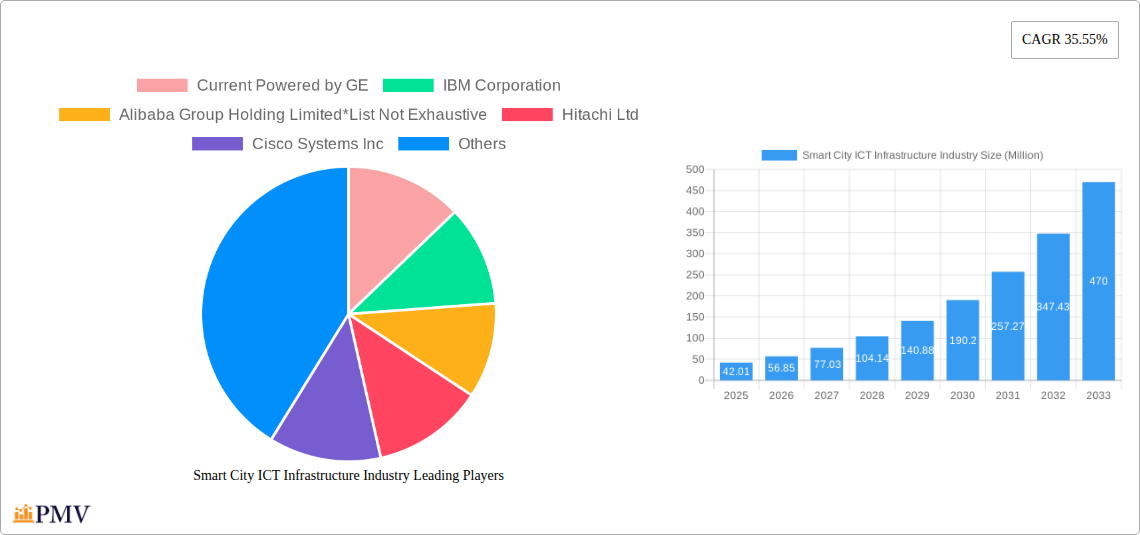
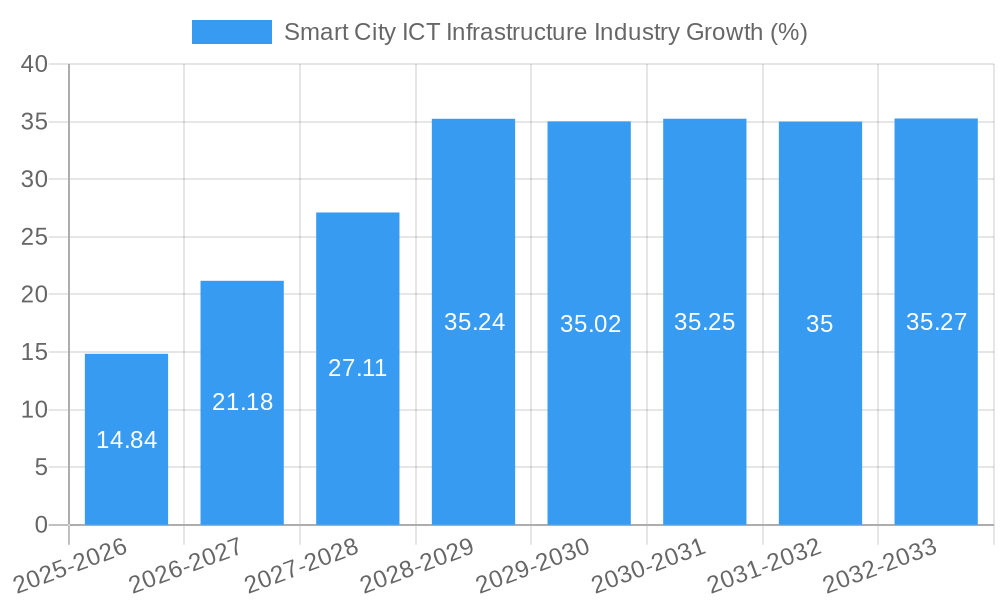
The Smart City ICT Infrastructure market is experiencing robust growth, projected to reach $42.01 million in 2025 and exhibiting a remarkable Compound Annual Growth Rate (CAGR) of 35.55%. This expansion is fueled by several key drivers. The increasing urbanization globally necessitates efficient and sustainable city management, driving the adoption of smart city technologies across various sectors. Government initiatives promoting digital transformation and smart city development projects are further accelerating market growth. Technological advancements, particularly in areas like IoT, AI, and big data analytics, are enabling the development of sophisticated smart city solutions capable of addressing complex urban challenges like traffic congestion, resource management, and public safety. Furthermore, the rising demand for improved citizen services and enhanced public safety is boosting investment in smart city infrastructure. The market is segmented by platform type (Connectivity Management, Integration, Device, Data, and Security Management Platforms) and application (Smart Mobility/Transportation, Smart Security, Smart Utilities, Smart Governance, Smart Infrastructure, Smart Healthcare, and Other Applications), with cloud deployment gaining significant traction over on-premise solutions due to scalability and cost-effectiveness. Key players like IBM, Cisco, Siemens, and Huawei are actively shaping the market landscape through innovation and strategic partnerships.
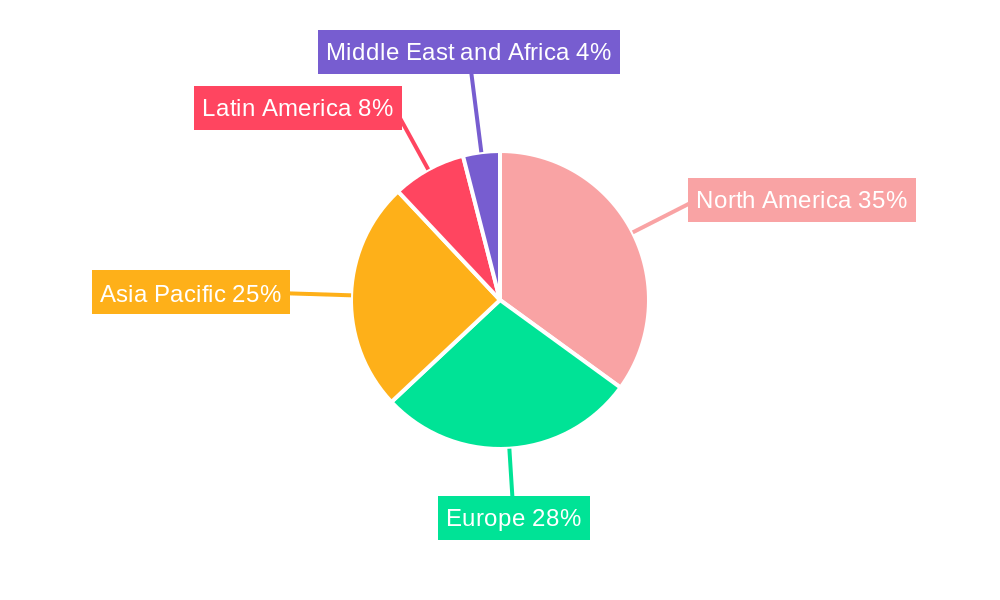
The market's future growth trajectory is expected to remain strong throughout the forecast period (2025-2033). While challenges like high initial investment costs and cybersecurity concerns exist, the long-term benefits of improved efficiency, resource optimization, and enhanced quality of life outweigh these limitations. The continued development of advanced technologies, coupled with increasing government support and private sector investment, will further propel market expansion. Regional variations are anticipated, with North America and Europe maintaining a significant market share due to established infrastructure and technological advancements, while the Asia-Pacific region is poised for substantial growth due to rapid urbanization and increasing government investments in smart city initiatives. The competitive landscape remains dynamic, with established technology vendors and emerging players vying for market dominance through strategic alliances, acquisitions, and technological innovation.
Smart City ICT Infrastructure Industry: A Comprehensive Market Report (2019-2033)
This in-depth report provides a comprehensive analysis of the Smart City ICT Infrastructure market, covering the period from 2019 to 2033. With a base year of 2025 and a forecast period spanning 2025-2033, this report offers invaluable insights for industry stakeholders, investors, and policymakers seeking to understand and navigate this rapidly evolving landscape. The global market is projected to reach xx Million by 2033, exhibiting a significant Compound Annual Growth Rate (CAGR) of xx%.
Smart City ICT Infrastructure Industry Market Structure & Competitive Dynamics
The Smart City ICT Infrastructure market exhibits a moderately concentrated structure, with several key players holding substantial market share. Companies like Current Powered by GE, IBM Corporation, Alibaba Group Holding Limited, Hitachi Ltd, Cisco Systems Inc, Siemens AG, Microsoft Corporation, Schneider Electric SE, and Huawei Technologies compete intensely, driving innovation and shaping market dynamics. The market is characterized by a dynamic innovation ecosystem, with continuous advancements in areas like 5G, AI, and IoT.
Regulatory frameworks, varying across different regions, play a crucial role in shaping market adoption. Product substitutes, such as legacy infrastructure solutions, pose a challenge, though their market share is gradually declining due to the superior capabilities of Smart City ICT solutions. End-user trends, particularly the increasing demand for enhanced public safety and improved urban services, are strong growth drivers. Mergers and acquisitions (M&A) are frequent, with deal values exceeding xx Million in recent years, indicating consolidation and strategic expansion within the industry. Market share data suggests that the top 5 players collectively account for approximately xx% of the global market.
Smart City ICT Infrastructure Industry Industry Trends & Insights
The Smart City ICT Infrastructure market is experiencing robust growth, driven by several key factors. The increasing urbanization globally is a primary driver, creating a surge in demand for efficient and sustainable urban management solutions. Technological advancements, such as the proliferation of 5G networks, Internet of Things (IoT) devices, and artificial intelligence (AI), are revolutionizing the capabilities of Smart City infrastructures. The market penetration rate of Smart City solutions is steadily rising, with a projected xx% increase by 2033. Consumer preferences for improved quality of life, enhanced safety, and efficient public services are fueling market adoption. Competitive dynamics are characterized by intense competition among established players and emerging technology providers, leading to continuous innovation and pricing pressures. The CAGR for the forecast period is estimated at xx%, indicating substantial growth potential.
Dominant Markets & Segments in Smart City ICT Infrastructure Industry
Leading Region: North America currently holds the largest market share due to advanced infrastructure, high technological adoption, and substantial government investment. Asia-Pacific is expected to witness the fastest growth in the forecast period due to rapid urbanization and increasing government initiatives.
Dominant Platform Types: The Connectivity Management Platform segment currently dominates, but the Data Management Platform and Security Management Platform segments are poised for rapid growth due to the increasing importance of data security and analytics in Smart City applications.
Key Application Segments: Smart Mobility/Transportation and Smart Utilities are currently the leading application segments, driven by high demand for traffic management solutions and smart grids. However, Smart Healthcare and Smart Governance are also witnessing substantial growth, driven by an increasing focus on improved healthcare access and public administration efficiency.
Deployment Models: Cloud deployment is gaining traction over on-premise solutions, driven by its scalability, cost-effectiveness, and ease of management. However, on-premise deployment remains significant in sectors with stringent data security and privacy requirements.
Key drivers fueling the dominance of these segments include supportive economic policies, robust infrastructure development, and focused government initiatives to improve urban services.
Smart City ICT Infrastructure Industry Product Innovations
Recent years have witnessed significant advancements in Smart City ICT infrastructure products, focusing on enhanced data analytics capabilities, improved security features, and seamless integration with various applications. The trend towards edge computing, AI-powered solutions, and 5G connectivity is transforming the capabilities of these systems, enabling real-time data processing and improved decision-making. This aligns well with increasing market demands for more efficient, responsive, and secure Smart City solutions.
Report Segmentation & Scope
This report segments the Smart City ICT Infrastructure market by platform type (Connectivity Management Platform, Integration Platform, Device Management Platform, Data Management Platform, Security Management Platform), application (Smart Mobility/Transportation, Smart Security, Smart Utilities, Smart Governance, Smart Infrastructure, Smart Healthcare, Other Applications), and deployment (On-premise, Cloud). Each segment's growth projections, market size (in Millions), and competitive dynamics are analyzed in detail, providing a granular understanding of the market landscape. The report also includes a comprehensive analysis of market size, growth drivers, challenges, and opportunities for each segment.
Key Drivers of Smart City ICT Infrastructure Industry Growth
Several factors are propelling the growth of the Smart City ICT Infrastructure market. Firstly, the increasing need for improved urban services and infrastructure development is driving the adoption of Smart City solutions. Secondly, technological advancements, such as the rise of IoT, 5G, and AI, are creating new opportunities for innovation and efficiency. Thirdly, supportive government policies and initiatives promoting Smart City development are significantly accelerating market growth. For instance, many governments are offering financial incentives and tax breaks to companies deploying Smart City solutions.
Challenges in the Smart City ICT Infrastructure Industry Sector
The Smart City ICT Infrastructure industry faces several challenges, including high initial investment costs, concerns around data security and privacy, and the complexity of integrating diverse systems. Regulatory hurdles and inconsistent standards across different regions can also hinder market expansion. Supply chain disruptions and the global chip shortage have impacted the availability of components, leading to project delays and cost increases. Intense competition and pricing pressures are further challenges for companies operating in this sector. These factors, cumulatively, could decrease market growth by an estimated xx% by 2030 if left unaddressed.
Leading Players in the Smart City ICT Infrastructure Industry Market
- Current Powered by GE
- IBM Corporation
- Alibaba Group Holding Limited
- Hitachi Ltd
- Cisco Systems Inc
- Siemens AG
- Microsoft Corporation
- Schneider Electric SE
- Huawei Technologies
Key Developments in Smart City ICT Infrastructure Industry Sector
- May 2022: Datumate signed a strategic distribution agreement with Hitachi Solutions to expand digital transformation in Japan and globally.
- March 2022: Juganu partnered with Qualcomm, Nokia, and Abdi to showcase its 5G and smart cities solutions.
These developments highlight the increasing collaborations and strategic partnerships within the industry, driving innovation and market expansion.
Strategic Smart City ICT Infrastructure Industry Market Outlook
The Smart City ICT Infrastructure market presents substantial growth opportunities over the forecast period. Continued urbanization, technological advancements, and supportive government policies will drive market expansion. Strategic investments in research and development, focusing on AI, 5G, and IoT technologies, will be crucial for companies seeking to gain a competitive edge. Collaborations and partnerships will play a vital role in driving innovation and accelerating market adoption. The market is expected to witness further consolidation through M&A activities, resulting in a more concentrated landscape.
Smart City ICT Infrastructure Industry Segmentation
-
1. Platform Type
- 1.1. Connectivity Management Platform
- 1.2. Integration Platform
- 1.3. Device Management Platform
- 1.4. Data Management Platform
- 1.5. Security Management Platform
-
2. Application
- 2.1. Smart Mobility/Transportation
- 2.2. Smart Security
- 2.3. Smart Utilities
- 2.4. Smart Governance
- 2.5. Smart Infrastructure
- 2.6. Smart Healthcare
- 2.7. Other Applications
-
3. Deployment
- 3.1. On-premise
- 3.2. Cloud
Smart City ICT Infrastructure Industry Segmentation By Geography
- 1. North America
- 2. Europe
- 3. Asia Pacific
- 4. Latin America
- 5. Middle East and Africa
Smart City ICT Infrastructure Industry REPORT HIGHLIGHTS
| Aspects | Details |
|---|---|
| Study Period | 2019-2033 |
| Base Year | 2024 |
| Estimated Year | 2025 |
| Forecast Period | 2025-2033 |
| Historical Period | 2019-2024 |
| Growth Rate | CAGR of 35.55% from 2019-2033 |
| Segmentation |
|
Table of Contents
- 1. Introduction
- 1.1. Research Scope
- 1.2. Market Segmentation
- 1.3. Research Methodology
- 1.4. Definitions and Assumptions
- 2. Executive Summary
- 2.1. Introduction
- 3. Market Dynamics
- 3.1. Introduction
- 3.2. Market Drivers
- 3.2.1. Rising Adoption of Internet and IoT Devices; Governments Increasing Focus on Smart City
- 3.3. Market Restrains
- 3.3.1. Governments Increasing Focus on Smart City
- 3.4. Market Trends
- 3.4.1. Smart Governance to be the Major Application Area
- 4. Market Factor Analysis
- 4.1. Porters Five Forces
- 4.2. Supply/Value Chain
- 4.3. PESTEL analysis
- 4.4. Market Entropy
- 4.5. Patent/Trademark Analysis
- 5. Global Smart City ICT Infrastructure Industry Analysis, Insights and Forecast, 2019-2031
- 5.1. Market Analysis, Insights and Forecast - by Platform Type
- 5.1.1. Connectivity Management Platform
- 5.1.2. Integration Platform
- 5.1.3. Device Management Platform
- 5.1.4. Data Management Platform
- 5.1.5. Security Management Platform
- 5.2. Market Analysis, Insights and Forecast - by Application
- 5.2.1. Smart Mobility/Transportation
- 5.2.2. Smart Security
- 5.2.3. Smart Utilities
- 5.2.4. Smart Governance
- 5.2.5. Smart Infrastructure
- 5.2.6. Smart Healthcare
- 5.2.7. Other Applications
- 5.3. Market Analysis, Insights and Forecast - by Deployment
- 5.3.1. On-premise
- 5.3.2. Cloud
- 5.4. Market Analysis, Insights and Forecast - by Region
- 5.4.1. North America
- 5.4.2. Europe
- 5.4.3. Asia Pacific
- 5.4.4. Latin America
- 5.4.5. Middle East and Africa
- 5.1. Market Analysis, Insights and Forecast - by Platform Type
- 6. North America Smart City ICT Infrastructure Industry Analysis, Insights and Forecast, 2019-2031
- 6.1. Market Analysis, Insights and Forecast - by Platform Type
- 6.1.1. Connectivity Management Platform
- 6.1.2. Integration Platform
- 6.1.3. Device Management Platform
- 6.1.4. Data Management Platform
- 6.1.5. Security Management Platform
- 6.2. Market Analysis, Insights and Forecast - by Application
- 6.2.1. Smart Mobility/Transportation
- 6.2.2. Smart Security
- 6.2.3. Smart Utilities
- 6.2.4. Smart Governance
- 6.2.5. Smart Infrastructure
- 6.2.6. Smart Healthcare
- 6.2.7. Other Applications
- 6.3. Market Analysis, Insights and Forecast - by Deployment
- 6.3.1. On-premise
- 6.3.2. Cloud
- 6.1. Market Analysis, Insights and Forecast - by Platform Type
- 7. Europe Smart City ICT Infrastructure Industry Analysis, Insights and Forecast, 2019-2031
- 7.1. Market Analysis, Insights and Forecast - by Platform Type
- 7.1.1. Connectivity Management Platform
- 7.1.2. Integration Platform
- 7.1.3. Device Management Platform
- 7.1.4. Data Management Platform
- 7.1.5. Security Management Platform
- 7.2. Market Analysis, Insights and Forecast - by Application
- 7.2.1. Smart Mobility/Transportation
- 7.2.2. Smart Security
- 7.2.3. Smart Utilities
- 7.2.4. Smart Governance
- 7.2.5. Smart Infrastructure
- 7.2.6. Smart Healthcare
- 7.2.7. Other Applications
- 7.3. Market Analysis, Insights and Forecast - by Deployment
- 7.3.1. On-premise
- 7.3.2. Cloud
- 7.1. Market Analysis, Insights and Forecast - by Platform Type
- 8. Asia Pacific Smart City ICT Infrastructure Industry Analysis, Insights and Forecast, 2019-2031
- 8.1. Market Analysis, Insights and Forecast - by Platform Type
- 8.1.1. Connectivity Management Platform
- 8.1.2. Integration Platform
- 8.1.3. Device Management Platform
- 8.1.4. Data Management Platform
- 8.1.5. Security Management Platform
- 8.2. Market Analysis, Insights and Forecast - by Application
- 8.2.1. Smart Mobility/Transportation
- 8.2.2. Smart Security
- 8.2.3. Smart Utilities
- 8.2.4. Smart Governance
- 8.2.5. Smart Infrastructure
- 8.2.6. Smart Healthcare
- 8.2.7. Other Applications
- 8.3. Market Analysis, Insights and Forecast - by Deployment
- 8.3.1. On-premise
- 8.3.2. Cloud
- 8.1. Market Analysis, Insights and Forecast - by Platform Type
- 9. Latin America Smart City ICT Infrastructure Industry Analysis, Insights and Forecast, 2019-2031
- 9.1. Market Analysis, Insights and Forecast - by Platform Type
- 9.1.1. Connectivity Management Platform
- 9.1.2. Integration Platform
- 9.1.3. Device Management Platform
- 9.1.4. Data Management Platform
- 9.1.5. Security Management Platform
- 9.2. Market Analysis, Insights and Forecast - by Application
- 9.2.1. Smart Mobility/Transportation
- 9.2.2. Smart Security
- 9.2.3. Smart Utilities
- 9.2.4. Smart Governance
- 9.2.5. Smart Infrastructure
- 9.2.6. Smart Healthcare
- 9.2.7. Other Applications
- 9.3. Market Analysis, Insights and Forecast - by Deployment
- 9.3.1. On-premise
- 9.3.2. Cloud
- 9.1. Market Analysis, Insights and Forecast - by Platform Type
- 10. Middle East and Africa Smart City ICT Infrastructure Industry Analysis, Insights and Forecast, 2019-2031
- 10.1. Market Analysis, Insights and Forecast - by Platform Type
- 10.1.1. Connectivity Management Platform
- 10.1.2. Integration Platform
- 10.1.3. Device Management Platform
- 10.1.4. Data Management Platform
- 10.1.5. Security Management Platform
- 10.2. Market Analysis, Insights and Forecast - by Application
- 10.2.1. Smart Mobility/Transportation
- 10.2.2. Smart Security
- 10.2.3. Smart Utilities
- 10.2.4. Smart Governance
- 10.2.5. Smart Infrastructure
- 10.2.6. Smart Healthcare
- 10.2.7. Other Applications
- 10.3. Market Analysis, Insights and Forecast - by Deployment
- 10.3.1. On-premise
- 10.3.2. Cloud
- 10.1. Market Analysis, Insights and Forecast - by Platform Type
- 11. North America Smart City ICT Infrastructure Industry Analysis, Insights and Forecast, 2019-2031
- 11.1. Market Analysis, Insights and Forecast - By Country/Sub-region
- 11.1.1.
- 12. Europe Smart City ICT Infrastructure Industry Analysis, Insights and Forecast, 2019-2031
- 12.1. Market Analysis, Insights and Forecast - By Country/Sub-region
- 12.1.1.
- 13. Asia Pacific Smart City ICT Infrastructure Industry Analysis, Insights and Forecast, 2019-2031
- 13.1. Market Analysis, Insights and Forecast - By Country/Sub-region
- 13.1.1.
- 14. Latin America Smart City ICT Infrastructure Industry Analysis, Insights and Forecast, 2019-2031
- 14.1. Market Analysis, Insights and Forecast - By Country/Sub-region
- 14.1.1.
- 15. Middle East and Africa Smart City ICT Infrastructure Industry Analysis, Insights and Forecast, 2019-2031
- 15.1. Market Analysis, Insights and Forecast - By Country/Sub-region
- 15.1.1.
- 16. Competitive Analysis
- 16.1. Global Market Share Analysis 2024
- 16.2. Company Profiles
- 16.2.1 Current Powered by GE
- 16.2.1.1. Overview
- 16.2.1.2. Products
- 16.2.1.3. SWOT Analysis
- 16.2.1.4. Recent Developments
- 16.2.1.5. Financials (Based on Availability)
- 16.2.2 IBM Corporation
- 16.2.2.1. Overview
- 16.2.2.2. Products
- 16.2.2.3. SWOT Analysis
- 16.2.2.4. Recent Developments
- 16.2.2.5. Financials (Based on Availability)
- 16.2.3 Alibaba Group Holding Limited*List Not Exhaustive
- 16.2.3.1. Overview
- 16.2.3.2. Products
- 16.2.3.3. SWOT Analysis
- 16.2.3.4. Recent Developments
- 16.2.3.5. Financials (Based on Availability)
- 16.2.4 Hitachi Ltd
- 16.2.4.1. Overview
- 16.2.4.2. Products
- 16.2.4.3. SWOT Analysis
- 16.2.4.4. Recent Developments
- 16.2.4.5. Financials (Based on Availability)
- 16.2.5 Cisco Systems Inc
- 16.2.5.1. Overview
- 16.2.5.2. Products
- 16.2.5.3. SWOT Analysis
- 16.2.5.4. Recent Developments
- 16.2.5.5. Financials (Based on Availability)
- 16.2.6 Siemens AG
- 16.2.6.1. Overview
- 16.2.6.2. Products
- 16.2.6.3. SWOT Analysis
- 16.2.6.4. Recent Developments
- 16.2.6.5. Financials (Based on Availability)
- 16.2.7 Microsoft Corporation
- 16.2.7.1. Overview
- 16.2.7.2. Products
- 16.2.7.3. SWOT Analysis
- 16.2.7.4. Recent Developments
- 16.2.7.5. Financials (Based on Availability)
- 16.2.8 Schneider Electric SE
- 16.2.8.1. Overview
- 16.2.8.2. Products
- 16.2.8.3. SWOT Analysis
- 16.2.8.4. Recent Developments
- 16.2.8.5. Financials (Based on Availability)
- 16.2.9 Huawei Technologies
- 16.2.9.1. Overview
- 16.2.9.2. Products
- 16.2.9.3. SWOT Analysis
- 16.2.9.4. Recent Developments
- 16.2.9.5. Financials (Based on Availability)
- 16.2.1 Current Powered by GE
List of Figures
- Figure 1: Global Smart City ICT Infrastructure Industry Revenue Breakdown (Million, %) by Region 2024 & 2032
- Figure 2: North America Smart City ICT Infrastructure Industry Revenue (Million), by Country 2024 & 2032
- Figure 3: North America Smart City ICT Infrastructure Industry Revenue Share (%), by Country 2024 & 2032
- Figure 4: Europe Smart City ICT Infrastructure Industry Revenue (Million), by Country 2024 & 2032
- Figure 5: Europe Smart City ICT Infrastructure Industry Revenue Share (%), by Country 2024 & 2032
- Figure 6: Asia Pacific Smart City ICT Infrastructure Industry Revenue (Million), by Country 2024 & 2032
- Figure 7: Asia Pacific Smart City ICT Infrastructure Industry Revenue Share (%), by Country 2024 & 2032
- Figure 8: Latin America Smart City ICT Infrastructure Industry Revenue (Million), by Country 2024 & 2032
- Figure 9: Latin America Smart City ICT Infrastructure Industry Revenue Share (%), by Country 2024 & 2032
- Figure 10: Middle East and Africa Smart City ICT Infrastructure Industry Revenue (Million), by Country 2024 & 2032
- Figure 11: Middle East and Africa Smart City ICT Infrastructure Industry Revenue Share (%), by Country 2024 & 2032
- Figure 12: North America Smart City ICT Infrastructure Industry Revenue (Million), by Platform Type 2024 & 2032
- Figure 13: North America Smart City ICT Infrastructure Industry Revenue Share (%), by Platform Type 2024 & 2032
- Figure 14: North America Smart City ICT Infrastructure Industry Revenue (Million), by Application 2024 & 2032
- Figure 15: North America Smart City ICT Infrastructure Industry Revenue Share (%), by Application 2024 & 2032
- Figure 16: North America Smart City ICT Infrastructure Industry Revenue (Million), by Deployment 2024 & 2032
- Figure 17: North America Smart City ICT Infrastructure Industry Revenue Share (%), by Deployment 2024 & 2032
- Figure 18: North America Smart City ICT Infrastructure Industry Revenue (Million), by Country 2024 & 2032
- Figure 19: North America Smart City ICT Infrastructure Industry Revenue Share (%), by Country 2024 & 2032
- Figure 20: Europe Smart City ICT Infrastructure Industry Revenue (Million), by Platform Type 2024 & 2032
- Figure 21: Europe Smart City ICT Infrastructure Industry Revenue Share (%), by Platform Type 2024 & 2032
- Figure 22: Europe Smart City ICT Infrastructure Industry Revenue (Million), by Application 2024 & 2032
- Figure 23: Europe Smart City ICT Infrastructure Industry Revenue Share (%), by Application 2024 & 2032
- Figure 24: Europe Smart City ICT Infrastructure Industry Revenue (Million), by Deployment 2024 & 2032
- Figure 25: Europe Smart City ICT Infrastructure Industry Revenue Share (%), by Deployment 2024 & 2032
- Figure 26: Europe Smart City ICT Infrastructure Industry Revenue (Million), by Country 2024 & 2032
- Figure 27: Europe Smart City ICT Infrastructure Industry Revenue Share (%), by Country 2024 & 2032
- Figure 28: Asia Pacific Smart City ICT Infrastructure Industry Revenue (Million), by Platform Type 2024 & 2032
- Figure 29: Asia Pacific Smart City ICT Infrastructure Industry Revenue Share (%), by Platform Type 2024 & 2032
- Figure 30: Asia Pacific Smart City ICT Infrastructure Industry Revenue (Million), by Application 2024 & 2032
- Figure 31: Asia Pacific Smart City ICT Infrastructure Industry Revenue Share (%), by Application 2024 & 2032
- Figure 32: Asia Pacific Smart City ICT Infrastructure Industry Revenue (Million), by Deployment 2024 & 2032
- Figure 33: Asia Pacific Smart City ICT Infrastructure Industry Revenue Share (%), by Deployment 2024 & 2032
- Figure 34: Asia Pacific Smart City ICT Infrastructure Industry Revenue (Million), by Country 2024 & 2032
- Figure 35: Asia Pacific Smart City ICT Infrastructure Industry Revenue Share (%), by Country 2024 & 2032
- Figure 36: Latin America Smart City ICT Infrastructure Industry Revenue (Million), by Platform Type 2024 & 2032
- Figure 37: Latin America Smart City ICT Infrastructure Industry Revenue Share (%), by Platform Type 2024 & 2032
- Figure 38: Latin America Smart City ICT Infrastructure Industry Revenue (Million), by Application 2024 & 2032
- Figure 39: Latin America Smart City ICT Infrastructure Industry Revenue Share (%), by Application 2024 & 2032
- Figure 40: Latin America Smart City ICT Infrastructure Industry Revenue (Million), by Deployment 2024 & 2032
- Figure 41: Latin America Smart City ICT Infrastructure Industry Revenue Share (%), by Deployment 2024 & 2032
- Figure 42: Latin America Smart City ICT Infrastructure Industry Revenue (Million), by Country 2024 & 2032
- Figure 43: Latin America Smart City ICT Infrastructure Industry Revenue Share (%), by Country 2024 & 2032
- Figure 44: Middle East and Africa Smart City ICT Infrastructure Industry Revenue (Million), by Platform Type 2024 & 2032
- Figure 45: Middle East and Africa Smart City ICT Infrastructure Industry Revenue Share (%), by Platform Type 2024 & 2032
- Figure 46: Middle East and Africa Smart City ICT Infrastructure Industry Revenue (Million), by Application 2024 & 2032
- Figure 47: Middle East and Africa Smart City ICT Infrastructure Industry Revenue Share (%), by Application 2024 & 2032
- Figure 48: Middle East and Africa Smart City ICT Infrastructure Industry Revenue (Million), by Deployment 2024 & 2032
- Figure 49: Middle East and Africa Smart City ICT Infrastructure Industry Revenue Share (%), by Deployment 2024 & 2032
- Figure 50: Middle East and Africa Smart City ICT Infrastructure Industry Revenue (Million), by Country 2024 & 2032
- Figure 51: Middle East and Africa Smart City ICT Infrastructure Industry Revenue Share (%), by Country 2024 & 2032
List of Tables
- Table 1: Global Smart City ICT Infrastructure Industry Revenue Million Forecast, by Region 2019 & 2032
- Table 2: Global Smart City ICT Infrastructure Industry Revenue Million Forecast, by Platform Type 2019 & 2032
- Table 3: Global Smart City ICT Infrastructure Industry Revenue Million Forecast, by Application 2019 & 2032
- Table 4: Global Smart City ICT Infrastructure Industry Revenue Million Forecast, by Deployment 2019 & 2032
- Table 5: Global Smart City ICT Infrastructure Industry Revenue Million Forecast, by Region 2019 & 2032
- Table 6: Global Smart City ICT Infrastructure Industry Revenue Million Forecast, by Country 2019 & 2032
- Table 7: Smart City ICT Infrastructure Industry Revenue (Million) Forecast, by Application 2019 & 2032
- Table 8: Global Smart City ICT Infrastructure Industry Revenue Million Forecast, by Country 2019 & 2032
- Table 9: Smart City ICT Infrastructure Industry Revenue (Million) Forecast, by Application 2019 & 2032
- Table 10: Global Smart City ICT Infrastructure Industry Revenue Million Forecast, by Country 2019 & 2032
- Table 11: Smart City ICT Infrastructure Industry Revenue (Million) Forecast, by Application 2019 & 2032
- Table 12: Global Smart City ICT Infrastructure Industry Revenue Million Forecast, by Country 2019 & 2032
- Table 13: Smart City ICT Infrastructure Industry Revenue (Million) Forecast, by Application 2019 & 2032
- Table 14: Global Smart City ICT Infrastructure Industry Revenue Million Forecast, by Country 2019 & 2032
- Table 15: Smart City ICT Infrastructure Industry Revenue (Million) Forecast, by Application 2019 & 2032
- Table 16: Global Smart City ICT Infrastructure Industry Revenue Million Forecast, by Platform Type 2019 & 2032
- Table 17: Global Smart City ICT Infrastructure Industry Revenue Million Forecast, by Application 2019 & 2032
- Table 18: Global Smart City ICT Infrastructure Industry Revenue Million Forecast, by Deployment 2019 & 2032
- Table 19: Global Smart City ICT Infrastructure Industry Revenue Million Forecast, by Country 2019 & 2032
- Table 20: Global Smart City ICT Infrastructure Industry Revenue Million Forecast, by Platform Type 2019 & 2032
- Table 21: Global Smart City ICT Infrastructure Industry Revenue Million Forecast, by Application 2019 & 2032
- Table 22: Global Smart City ICT Infrastructure Industry Revenue Million Forecast, by Deployment 2019 & 2032
- Table 23: Global Smart City ICT Infrastructure Industry Revenue Million Forecast, by Country 2019 & 2032
- Table 24: Global Smart City ICT Infrastructure Industry Revenue Million Forecast, by Platform Type 2019 & 2032
- Table 25: Global Smart City ICT Infrastructure Industry Revenue Million Forecast, by Application 2019 & 2032
- Table 26: Global Smart City ICT Infrastructure Industry Revenue Million Forecast, by Deployment 2019 & 2032
- Table 27: Global Smart City ICT Infrastructure Industry Revenue Million Forecast, by Country 2019 & 2032
- Table 28: Global Smart City ICT Infrastructure Industry Revenue Million Forecast, by Platform Type 2019 & 2032
- Table 29: Global Smart City ICT Infrastructure Industry Revenue Million Forecast, by Application 2019 & 2032
- Table 30: Global Smart City ICT Infrastructure Industry Revenue Million Forecast, by Deployment 2019 & 2032
- Table 31: Global Smart City ICT Infrastructure Industry Revenue Million Forecast, by Country 2019 & 2032
- Table 32: Global Smart City ICT Infrastructure Industry Revenue Million Forecast, by Platform Type 2019 & 2032
- Table 33: Global Smart City ICT Infrastructure Industry Revenue Million Forecast, by Application 2019 & 2032
- Table 34: Global Smart City ICT Infrastructure Industry Revenue Million Forecast, by Deployment 2019 & 2032
- Table 35: Global Smart City ICT Infrastructure Industry Revenue Million Forecast, by Country 2019 & 2032
Frequently Asked Questions
1. What is the projected Compound Annual Growth Rate (CAGR) of the Smart City ICT Infrastructure Industry?
The projected CAGR is approximately 35.55%.
2. Which companies are prominent players in the Smart City ICT Infrastructure Industry?
Key companies in the market include Current Powered by GE, IBM Corporation, Alibaba Group Holding Limited*List Not Exhaustive, Hitachi Ltd, Cisco Systems Inc, Siemens AG, Microsoft Corporation, Schneider Electric SE, Huawei Technologies.
3. What are the main segments of the Smart City ICT Infrastructure Industry?
The market segments include Platform Type, Application, Deployment.
4. Can you provide details about the market size?
The market size is estimated to be USD 42.01 Million as of 2022.
5. What are some drivers contributing to market growth?
Rising Adoption of Internet and IoT Devices; Governments Increasing Focus on Smart City.
6. What are the notable trends driving market growth?
Smart Governance to be the Major Application Area.
7. Are there any restraints impacting market growth?
Governments Increasing Focus on Smart City.
8. Can you provide examples of recent developments in the market?
May 2022 - Datumate signed a strategic distribution agreement with Hitachi Solutions to expand digital transformation in Japan and globally. The multi-year strategic partnership agreement entails that Hitachi Solutions, Ltd. will integrate Datumate's construction analytics platform into its professional service offerings.
9. What pricing options are available for accessing the report?
Pricing options include single-user, multi-user, and enterprise licenses priced at USD 4750, USD 5250, and USD 8750 respectively.
10. Is the market size provided in terms of value or volume?
The market size is provided in terms of value, measured in Million.
11. Are there any specific market keywords associated with the report?
Yes, the market keyword associated with the report is "Smart City ICT Infrastructure Industry," which aids in identifying and referencing the specific market segment covered.
12. How do I determine which pricing option suits my needs best?
The pricing options vary based on user requirements and access needs. Individual users may opt for single-user licenses, while businesses requiring broader access may choose multi-user or enterprise licenses for cost-effective access to the report.
13. Are there any additional resources or data provided in the Smart City ICT Infrastructure Industry report?
While the report offers comprehensive insights, it's advisable to review the specific contents or supplementary materials provided to ascertain if additional resources or data are available.
14. How can I stay updated on further developments or reports in the Smart City ICT Infrastructure Industry?
To stay informed about further developments, trends, and reports in the Smart City ICT Infrastructure Industry, consider subscribing to industry newsletters, following relevant companies and organizations, or regularly checking reputable industry news sources and publications.
Methodology
Step 1 - Identification of Relevant Samples Size from Population Database


Step 2 - Approaches for Defining Global Market Size (Value, Volume* & Price*)

Note*: In applicable scenarios
Step 3 - Data Sources
Primary Research
- Web Analytics
- Survey Reports
- Research Institute
- Latest Research Reports
- Opinion Leaders
Secondary Research
- Annual Reports
- White Paper
- Latest Press Release
- Industry Association
- Paid Database
- Investor Presentations

Step 4 - Data Triangulation
Involves using different sources of information in order to increase the validity of a study
These sources are likely to be stakeholders in a program - participants, other researchers, program staff, other community members, and so on.
Then we put all data in single framework & apply various statistical tools to find out the dynamic on the market.
During the analysis stage, feedback from the stakeholder groups would be compared to determine areas of agreement as well as areas of divergence


