
Key Insights
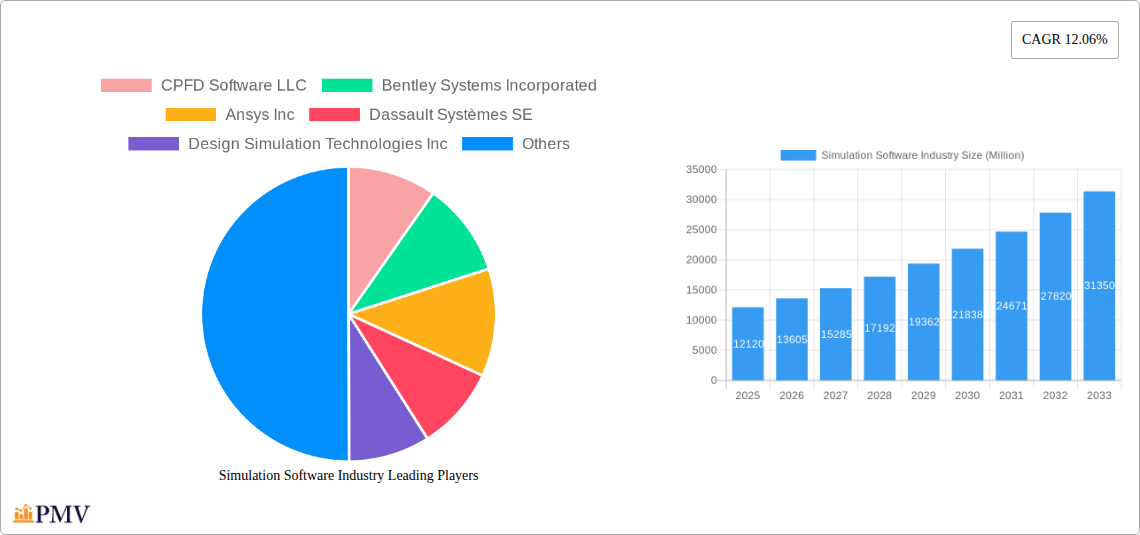
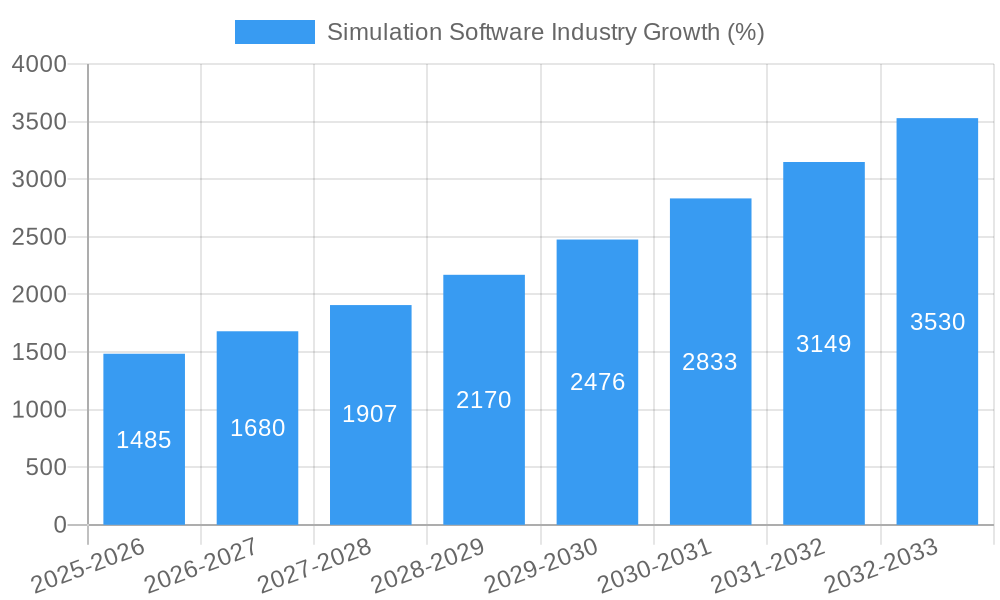
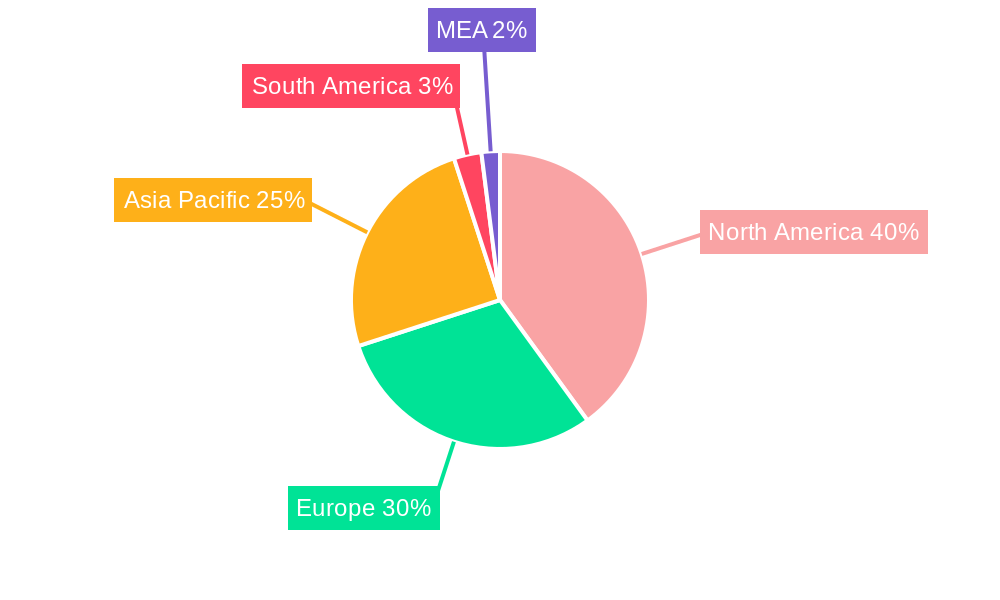
The simulation software market, currently valued at $12.12 billion in 2025, is experiencing robust growth, projected to expand at a compound annual growth rate (CAGR) of 12.06% from 2025 to 2033. This surge is driven by several factors. Increasing demand for efficient product development across diverse industries, particularly automotive, aerospace & defense, and IT & telecommunications, fuels the adoption of simulation software for prototyping, testing, and optimization. Furthermore, the shift towards cloud-based deployment models offers enhanced scalability, accessibility, and cost-effectiveness, further boosting market expansion. Advancements in simulation technologies, including high-fidelity modeling, AI integration, and improved user interfaces, are also contributing to this growth. While the on-premise deployment model still holds a significant share, cloud deployment is rapidly gaining traction, reflecting a broader industry trend towards digital transformation. Geographical growth is anticipated to be strong across North America and Asia-Pacific, fueled by significant investments in R&D and a growing pool of skilled professionals. However, challenges such as high initial investment costs and the need for specialized expertise could potentially restrain market growth to some degree.
The competitive landscape is characterized by a mix of established players and emerging innovative companies. Key players like Ansys, Dassault Systèmes, and Siemens are leveraging their extensive experience and technological capabilities to maintain market leadership. Meanwhile, smaller, specialized firms are focusing on niche applications and emerging technologies to gain market share. The ongoing technological advancements and the increasing integration of simulation software with other digital tools, like CAD and PLM, promise further expansion and sophistication within the simulation software market. The market's future trajectory is thus strongly positive, driven by continuous innovation and increasing adoption across diverse industry sectors. Competition will likely intensify as companies strive to differentiate their offerings through superior functionalities, better user experience, and wider industry-specific solutions.
Simulation Software Industry: A Comprehensive Market Report (2019-2033)
This in-depth report provides a comprehensive analysis of the Simulation Software industry, offering invaluable insights for businesses, investors, and researchers. With a study period spanning 2019-2033, a base year of 2025, and a forecast period of 2025-2033, this report leverages historical data (2019-2024) to predict future market trends and opportunities. The market is valued at xx Million in 2025 and is projected to reach xx Million by 2033, exhibiting a CAGR of xx%.
Simulation Software Industry Market Structure & Competitive Dynamics
The simulation software market is characterized by a moderately concentrated landscape with several major players and numerous niche providers. Market share is distributed among established giants like Ansys Inc, Dassault Systèmes SE, and Siemens AG, alongside specialized firms such as CPFD Software LLC and SIMUL8 Corporation. The level of concentration is influenced by factors such as the high barriers to entry (significant R&D investment, specialized expertise), and the presence of well-established ecosystems. Innovation is driven by continuous advancements in computational power, AI, and machine learning, leading to increasingly sophisticated and user-friendly simulation tools.
Regulatory frameworks, particularly those related to data privacy and security, are increasingly influential. The presence of substitute technologies, such as physical prototyping, impacts market growth, although digital twin technology is increasingly favored due to reduced cost and efficiency gains. End-user trends favor cloud-based solutions, owing to their scalability, accessibility, and cost-effectiveness. Mergers and acquisitions (M&A) activity remains significant, with deal values exceeding xx Million in recent years, as larger companies seek to expand their capabilities and market reach.
- Market Concentration: Moderately concentrated, with several dominant players.
- Innovation Ecosystems: Strong emphasis on AI, machine learning, and cloud computing.
- Regulatory Frameworks: Increasingly important, particularly concerning data privacy and security.
- M&A Activity: Significant, with deal values exceeding xx Million in recent years.
- Market Share: Ansys Inc and Dassault Systèmes SE hold significant market share, xx% and xx% respectively (estimated).
Simulation Software Industry Industry Trends & Insights
The simulation software market is experiencing robust growth, fueled by several key trends. The increasing adoption of digital twin technologies across various industries is a primary driver, allowing for virtual prototyping, predictive maintenance, and optimized product design. The expanding use of cloud computing enables wider access to simulation capabilities, fostering greater adoption among SMEs. Advancements in artificial intelligence (AI) and machine learning are transforming simulation technologies, enabling more accurate predictions and faster processing times. These advancements result in more sophisticated simulation applications across numerous industries.
Consumer preferences increasingly lean towards user-friendly, intuitive interfaces, necessitating significant investment in software design and user experience (UX). The competitive landscape is highly dynamic, with existing players continuously innovating and new entrants emerging. The market is also experiencing a shift towards software-as-a-service (SaaS) models, further driven by the increasing prevalence of cloud-based solutions. Overall, the market exhibits significant growth potential, particularly in emerging economies and sectors characterized by high technological adoption. The CAGR for the forecast period is projected to be xx%, indicating substantial market expansion.
Dominant Markets & Segments in Simulation Software Industry
The North American region currently dominates the simulation software market, driven by high technological adoption, robust R&D investments, and the presence of major industry players. Within deployment types, cloud-based solutions are rapidly gaining traction, surpassing on-premise deployments.
- Leading Region: North America.
- Key Drivers (North America): Strong technological infrastructure, high R&D investment, presence of major players.
- Leading Deployment Type: Cloud, driven by scalability, accessibility, and cost-effectiveness.
- Leading End-User Industries: Automotive, Aerospace & Defense, and IT & Telecommunication represent the largest market segments. Their dominance is attributed to high investment in R&D and the critical role of simulation in design and development. The Automotive industry, for instance, heavily uses simulation for crash testing and aerodynamic optimization, which contributes significantly to the high market share.
The Automotive industry is characterized by a high demand for advanced simulation technologies, including CFD, FEA, and multi-body dynamics simulation. These tools are critical for optimizing vehicle performance, safety, and fuel efficiency.
Simulation Software Industry Product Innovations
Recent innovations in simulation software focus on enhancing accuracy, speed, and user-friendliness. Integration with AI and machine learning is a key trend, enabling automation of complex tasks and improved predictive capabilities. The development of cloud-based platforms enhances accessibility and scalability, lowering the barrier to entry for smaller companies. These innovations are improving market fit by reducing costs, streamlining workflows, and improving the accuracy of simulations across various sectors.
Report Segmentation & Scope
This report segments the simulation software market based on deployment type (on-premise and cloud) and end-user industry (Automotive, IT & Telecommunication, Aerospace & Defense, Energy & Mining, Education & Research, Electrical & Electronics, and Other End-user Industries). Each segment provides detailed analysis of market size, growth projections, and competitive dynamics. The cloud segment is projected to experience faster growth compared to on-premise solutions. The Automotive and Aerospace & Defense industries are expected to maintain their lead in terms of market share due to their high reliance on sophisticated simulation technologies.
Key Drivers of Simulation Software Industry Growth
Several factors drive the growth of the simulation software industry. These include the increasing demand for product innovation across various sectors, the cost-effectiveness of virtual prototyping compared to physical testing, the growing adoption of digital twin technologies and the increasing adoption of cloud-based solutions, providing enhanced accessibility and scalability. Furthermore, government regulations supporting digital transformation further fuel this growth.
Challenges in the Simulation Software Industry Sector
The simulation software industry faces challenges such as the high cost of software licenses and maintenance, the complexity of implementation and integration, and the need for skilled professionals to operate the software. Competition is fierce, necessitating continuous innovation and adaptation to changing market demands. The market is also susceptible to fluctuations in the technology sector, influenced by broader economic trends and disruptions in global supply chains.
Leading Players in the Simulation Software Industry Market
- CPFD Software LLC
- Bentley Systems Incorporated
- Ansys Inc
- Dassault Systèmes SE
- Design Simulation Technologies Inc
- Schneider Electric SE
- SolidWorks Corporation
- SIMUL8 Corporation
- Cybernet Systems Corp
- Simio LLC
- Siemens AG
- Altair Engineering Inc
- CONSELF Srl
- PTC Inc
- The MathWorks Inc
- Autodesk Inc
- Synopsys Inc
- Rockwell Automation Inc
- The COMSOL Group
- Lanner Group Ltd
Key Developments in Simulation Software Industry Sector
- March 2023: Simulations Plus, Inc. announced a cooperative research contract with the Institute of Medical Biology of the Polish Academy of Sciences to develop new compounds using its AI-powered ADMET Predictor software. This highlights the growing integration of AI in drug discovery and development.
- January 2023: Real-Time Innovations (RTI) partnered with Ansys, enabling the simulation of high-performance distributed procedures without physical hardware. This underscores the growing importance of virtual testing and development.
Strategic Simulation Software Industry Market Outlook
The simulation software market is poised for continued strong growth, driven by ongoing technological advancements, increasing adoption across diverse industries, and expanding applications. Strategic opportunities lie in developing innovative solutions leveraging AI, cloud computing, and digital twin technologies. Companies focusing on user experience and seamless integration within existing workflows will be well-positioned to capture significant market share. The future of the simulation software industry is bright, promising substantial returns for companies that can adapt to the evolving market dynamics and technological advancements.
Simulation Software Industry Segmentation
-
1. Deployment Type
- 1.1. On-premise
- 1.2. Cloud
-
2. End-user Industry
- 2.1. Automotive
- 2.2. IT and Telecommunication
- 2.3. Aerospace and Defense
- 2.4. Energy and Mining
- 2.5. Education and Research
- 2.6. Electrical and Electronics
- 2.7. Other End-user Industries
Simulation Software Industry Segmentation By Geography
- 1. North America
- 2. Europe
- 3. Asia
- 4. Australia and New Zealand
- 5. Latin America
- 6. Middle East and Africa
Simulation Software Industry REPORT HIGHLIGHTS
| Aspects | Details |
|---|---|
| Study Period | 2019-2033 |
| Base Year | 2024 |
| Estimated Year | 2025 |
| Forecast Period | 2025-2033 |
| Historical Period | 2019-2024 |
| Growth Rate | CAGR of 12.06% from 2019-2033 |
| Segmentation |
|
Table of Contents
- 1. Introduction
- 1.1. Research Scope
- 1.2. Market Segmentation
- 1.3. Research Methodology
- 1.4. Definitions and Assumptions
- 2. Executive Summary
- 2.1. Introduction
- 3. Market Dynamics
- 3.1. Introduction
- 3.2. Market Drivers
- 3.2.1. Growing Automotive Sector
- 3.3. Market Restrains
- 3.3.1. Fluctuating Market Demands and Customization Issues
- 3.4. Market Trends
- 3.4.1. Automotive Segment is expected grow at a faster pace.
- 4. Market Factor Analysis
- 4.1. Porters Five Forces
- 4.2. Supply/Value Chain
- 4.3. PESTEL analysis
- 4.4. Market Entropy
- 4.5. Patent/Trademark Analysis
- 5. Global Simulation Software Industry Analysis, Insights and Forecast, 2019-2031
- 5.1. Market Analysis, Insights and Forecast - by Deployment Type
- 5.1.1. On-premise
- 5.1.2. Cloud
- 5.2. Market Analysis, Insights and Forecast - by End-user Industry
- 5.2.1. Automotive
- 5.2.2. IT and Telecommunication
- 5.2.3. Aerospace and Defense
- 5.2.4. Energy and Mining
- 5.2.5. Education and Research
- 5.2.6. Electrical and Electronics
- 5.2.7. Other End-user Industries
- 5.3. Market Analysis, Insights and Forecast - by Region
- 5.3.1. North America
- 5.3.2. Europe
- 5.3.3. Asia
- 5.3.4. Australia and New Zealand
- 5.3.5. Latin America
- 5.3.6. Middle East and Africa
- 5.1. Market Analysis, Insights and Forecast - by Deployment Type
- 6. North America Simulation Software Industry Analysis, Insights and Forecast, 2019-2031
- 6.1. Market Analysis, Insights and Forecast - by Deployment Type
- 6.1.1. On-premise
- 6.1.2. Cloud
- 6.2. Market Analysis, Insights and Forecast - by End-user Industry
- 6.2.1. Automotive
- 6.2.2. IT and Telecommunication
- 6.2.3. Aerospace and Defense
- 6.2.4. Energy and Mining
- 6.2.5. Education and Research
- 6.2.6. Electrical and Electronics
- 6.2.7. Other End-user Industries
- 6.1. Market Analysis, Insights and Forecast - by Deployment Type
- 7. Europe Simulation Software Industry Analysis, Insights and Forecast, 2019-2031
- 7.1. Market Analysis, Insights and Forecast - by Deployment Type
- 7.1.1. On-premise
- 7.1.2. Cloud
- 7.2. Market Analysis, Insights and Forecast - by End-user Industry
- 7.2.1. Automotive
- 7.2.2. IT and Telecommunication
- 7.2.3. Aerospace and Defense
- 7.2.4. Energy and Mining
- 7.2.5. Education and Research
- 7.2.6. Electrical and Electronics
- 7.2.7. Other End-user Industries
- 7.1. Market Analysis, Insights and Forecast - by Deployment Type
- 8. Asia Simulation Software Industry Analysis, Insights and Forecast, 2019-2031
- 8.1. Market Analysis, Insights and Forecast - by Deployment Type
- 8.1.1. On-premise
- 8.1.2. Cloud
- 8.2. Market Analysis, Insights and Forecast - by End-user Industry
- 8.2.1. Automotive
- 8.2.2. IT and Telecommunication
- 8.2.3. Aerospace and Defense
- 8.2.4. Energy and Mining
- 8.2.5. Education and Research
- 8.2.6. Electrical and Electronics
- 8.2.7. Other End-user Industries
- 8.1. Market Analysis, Insights and Forecast - by Deployment Type
- 9. Australia and New Zealand Simulation Software Industry Analysis, Insights and Forecast, 2019-2031
- 9.1. Market Analysis, Insights and Forecast - by Deployment Type
- 9.1.1. On-premise
- 9.1.2. Cloud
- 9.2. Market Analysis, Insights and Forecast - by End-user Industry
- 9.2.1. Automotive
- 9.2.2. IT and Telecommunication
- 9.2.3. Aerospace and Defense
- 9.2.4. Energy and Mining
- 9.2.5. Education and Research
- 9.2.6. Electrical and Electronics
- 9.2.7. Other End-user Industries
- 9.1. Market Analysis, Insights and Forecast - by Deployment Type
- 10. Latin America Simulation Software Industry Analysis, Insights and Forecast, 2019-2031
- 10.1. Market Analysis, Insights and Forecast - by Deployment Type
- 10.1.1. On-premise
- 10.1.2. Cloud
- 10.2. Market Analysis, Insights and Forecast - by End-user Industry
- 10.2.1. Automotive
- 10.2.2. IT and Telecommunication
- 10.2.3. Aerospace and Defense
- 10.2.4. Energy and Mining
- 10.2.5. Education and Research
- 10.2.6. Electrical and Electronics
- 10.2.7. Other End-user Industries
- 10.1. Market Analysis, Insights and Forecast - by Deployment Type
- 11. Middle East and Africa Simulation Software Industry Analysis, Insights and Forecast, 2019-2031
- 11.1. Market Analysis, Insights and Forecast - by Deployment Type
- 11.1.1. On-premise
- 11.1.2. Cloud
- 11.2. Market Analysis, Insights and Forecast - by End-user Industry
- 11.2.1. Automotive
- 11.2.2. IT and Telecommunication
- 11.2.3. Aerospace and Defense
- 11.2.4. Energy and Mining
- 11.2.5. Education and Research
- 11.2.6. Electrical and Electronics
- 11.2.7. Other End-user Industries
- 11.1. Market Analysis, Insights and Forecast - by Deployment Type
- 12. North America Simulation Software Industry Analysis, Insights and Forecast, 2019-2031
- 12.1. Market Analysis, Insights and Forecast - By Country/Sub-region
- 12.1.1 United States
- 12.1.2 Canada
- 12.1.3 Mexico
- 13. Europe Simulation Software Industry Analysis, Insights and Forecast, 2019-2031
- 13.1. Market Analysis, Insights and Forecast - By Country/Sub-region
- 13.1.1 Germany
- 13.1.2 United Kingdom
- 13.1.3 France
- 13.1.4 Spain
- 13.1.5 Italy
- 13.1.6 Spain
- 13.1.7 Belgium
- 13.1.8 Netherland
- 13.1.9 Nordics
- 13.1.10 Rest of Europe
- 14. Asia Pacific Simulation Software Industry Analysis, Insights and Forecast, 2019-2031
- 14.1. Market Analysis, Insights and Forecast - By Country/Sub-region
- 14.1.1 China
- 14.1.2 Japan
- 14.1.3 India
- 14.1.4 South Korea
- 14.1.5 Southeast Asia
- 14.1.6 Australia
- 14.1.7 Indonesia
- 14.1.8 Phillipes
- 14.1.9 Singapore
- 14.1.10 Thailandc
- 14.1.11 Rest of Asia Pacific
- 15. South America Simulation Software Industry Analysis, Insights and Forecast, 2019-2031
- 15.1. Market Analysis, Insights and Forecast - By Country/Sub-region
- 15.1.1 Brazil
- 15.1.2 Argentina
- 15.1.3 Peru
- 15.1.4 Chile
- 15.1.5 Colombia
- 15.1.6 Ecuador
- 15.1.7 Venezuela
- 15.1.8 Rest of South America
- 16. North America Simulation Software Industry Analysis, Insights and Forecast, 2019-2031
- 16.1. Market Analysis, Insights and Forecast - By Country/Sub-region
- 16.1.1 United States
- 16.1.2 Canada
- 16.1.3 Mexico
- 17. MEA Simulation Software Industry Analysis, Insights and Forecast, 2019-2031
- 17.1. Market Analysis, Insights and Forecast - By Country/Sub-region
- 17.1.1 United Arab Emirates
- 17.1.2 Saudi Arabia
- 17.1.3 South Africa
- 17.1.4 Rest of Middle East and Africa
- 18. Competitive Analysis
- 18.1. Global Market Share Analysis 2024
- 18.2. Company Profiles
- 18.2.1 CPFD Software LLC
- 18.2.1.1. Overview
- 18.2.1.2. Products
- 18.2.1.3. SWOT Analysis
- 18.2.1.4. Recent Developments
- 18.2.1.5. Financials (Based on Availability)
- 18.2.2 Bentley Systems Incorporated
- 18.2.2.1. Overview
- 18.2.2.2. Products
- 18.2.2.3. SWOT Analysis
- 18.2.2.4. Recent Developments
- 18.2.2.5. Financials (Based on Availability)
- 18.2.3 Ansys Inc
- 18.2.3.1. Overview
- 18.2.3.2. Products
- 18.2.3.3. SWOT Analysis
- 18.2.3.4. Recent Developments
- 18.2.3.5. Financials (Based on Availability)
- 18.2.4 Dassault Systèmes SE
- 18.2.4.1. Overview
- 18.2.4.2. Products
- 18.2.4.3. SWOT Analysis
- 18.2.4.4. Recent Developments
- 18.2.4.5. Financials (Based on Availability)
- 18.2.5 Design Simulation Technologies Inc
- 18.2.5.1. Overview
- 18.2.5.2. Products
- 18.2.5.3. SWOT Analysis
- 18.2.5.4. Recent Developments
- 18.2.5.5. Financials (Based on Availability)
- 18.2.6 Schneider Electric SE
- 18.2.6.1. Overview
- 18.2.6.2. Products
- 18.2.6.3. SWOT Analysis
- 18.2.6.4. Recent Developments
- 18.2.6.5. Financials (Based on Availability)
- 18.2.7 SolidWorks Corporation
- 18.2.7.1. Overview
- 18.2.7.2. Products
- 18.2.7.3. SWOT Analysis
- 18.2.7.4. Recent Developments
- 18.2.7.5. Financials (Based on Availability)
- 18.2.8 SIMUL8 Corporation
- 18.2.8.1. Overview
- 18.2.8.2. Products
- 18.2.8.3. SWOT Analysis
- 18.2.8.4. Recent Developments
- 18.2.8.5. Financials (Based on Availability)
- 18.2.9 Cybernet Systems Corp
- 18.2.9.1. Overview
- 18.2.9.2. Products
- 18.2.9.3. SWOT Analysis
- 18.2.9.4. Recent Developments
- 18.2.9.5. Financials (Based on Availability)
- 18.2.10 Simio LLC
- 18.2.10.1. Overview
- 18.2.10.2. Products
- 18.2.10.3. SWOT Analysis
- 18.2.10.4. Recent Developments
- 18.2.10.5. Financials (Based on Availability)
- 18.2.11 Siemens AG
- 18.2.11.1. Overview
- 18.2.11.2. Products
- 18.2.11.3. SWOT Analysis
- 18.2.11.4. Recent Developments
- 18.2.11.5. Financials (Based on Availability)
- 18.2.12 Altair Engineering Inc
- 18.2.12.1. Overview
- 18.2.12.2. Products
- 18.2.12.3. SWOT Analysis
- 18.2.12.4. Recent Developments
- 18.2.12.5. Financials (Based on Availability)
- 18.2.13 CONSELF Srl
- 18.2.13.1. Overview
- 18.2.13.2. Products
- 18.2.13.3. SWOT Analysis
- 18.2.13.4. Recent Developments
- 18.2.13.5. Financials (Based on Availability)
- 18.2.14 PTC Inc
- 18.2.14.1. Overview
- 18.2.14.2. Products
- 18.2.14.3. SWOT Analysis
- 18.2.14.4. Recent Developments
- 18.2.14.5. Financials (Based on Availability)
- 18.2.15 The MathWorks Inc
- 18.2.15.1. Overview
- 18.2.15.2. Products
- 18.2.15.3. SWOT Analysis
- 18.2.15.4. Recent Developments
- 18.2.15.5. Financials (Based on Availability)
- 18.2.16 Autodesk Inc
- 18.2.16.1. Overview
- 18.2.16.2. Products
- 18.2.16.3. SWOT Analysis
- 18.2.16.4. Recent Developments
- 18.2.16.5. Financials (Based on Availability)
- 18.2.17 Synopsys Inc
- 18.2.17.1. Overview
- 18.2.17.2. Products
- 18.2.17.3. SWOT Analysis
- 18.2.17.4. Recent Developments
- 18.2.17.5. Financials (Based on Availability)
- 18.2.18 Rockwell Automation Inc
- 18.2.18.1. Overview
- 18.2.18.2. Products
- 18.2.18.3. SWOT Analysis
- 18.2.18.4. Recent Developments
- 18.2.18.5. Financials (Based on Availability)
- 18.2.19 The COMSOL Group
- 18.2.19.1. Overview
- 18.2.19.2. Products
- 18.2.19.3. SWOT Analysis
- 18.2.19.4. Recent Developments
- 18.2.19.5. Financials (Based on Availability)
- 18.2.20 Lanner Group Ltd
- 18.2.20.1. Overview
- 18.2.20.2. Products
- 18.2.20.3. SWOT Analysis
- 18.2.20.4. Recent Developments
- 18.2.20.5. Financials (Based on Availability)
- 18.2.1 CPFD Software LLC
List of Figures
- Figure 1: Global Simulation Software Industry Revenue Breakdown (Million, %) by Region 2024 & 2032
- Figure 2: Global Simulation Software Industry Volume Breakdown (K Unit, %) by Region 2024 & 2032
- Figure 3: North America Simulation Software Industry Revenue (Million), by Country 2024 & 2032
- Figure 4: North America Simulation Software Industry Volume (K Unit), by Country 2024 & 2032
- Figure 5: North America Simulation Software Industry Revenue Share (%), by Country 2024 & 2032
- Figure 6: North America Simulation Software Industry Volume Share (%), by Country 2024 & 2032
- Figure 7: Europe Simulation Software Industry Revenue (Million), by Country 2024 & 2032
- Figure 8: Europe Simulation Software Industry Volume (K Unit), by Country 2024 & 2032
- Figure 9: Europe Simulation Software Industry Revenue Share (%), by Country 2024 & 2032
- Figure 10: Europe Simulation Software Industry Volume Share (%), by Country 2024 & 2032
- Figure 11: Asia Pacific Simulation Software Industry Revenue (Million), by Country 2024 & 2032
- Figure 12: Asia Pacific Simulation Software Industry Volume (K Unit), by Country 2024 & 2032
- Figure 13: Asia Pacific Simulation Software Industry Revenue Share (%), by Country 2024 & 2032
- Figure 14: Asia Pacific Simulation Software Industry Volume Share (%), by Country 2024 & 2032
- Figure 15: South America Simulation Software Industry Revenue (Million), by Country 2024 & 2032
- Figure 16: South America Simulation Software Industry Volume (K Unit), by Country 2024 & 2032
- Figure 17: South America Simulation Software Industry Revenue Share (%), by Country 2024 & 2032
- Figure 18: South America Simulation Software Industry Volume Share (%), by Country 2024 & 2032
- Figure 19: North America Simulation Software Industry Revenue (Million), by Country 2024 & 2032
- Figure 20: North America Simulation Software Industry Volume (K Unit), by Country 2024 & 2032
- Figure 21: North America Simulation Software Industry Revenue Share (%), by Country 2024 & 2032
- Figure 22: North America Simulation Software Industry Volume Share (%), by Country 2024 & 2032
- Figure 23: MEA Simulation Software Industry Revenue (Million), by Country 2024 & 2032
- Figure 24: MEA Simulation Software Industry Volume (K Unit), by Country 2024 & 2032
- Figure 25: MEA Simulation Software Industry Revenue Share (%), by Country 2024 & 2032
- Figure 26: MEA Simulation Software Industry Volume Share (%), by Country 2024 & 2032
- Figure 27: North America Simulation Software Industry Revenue (Million), by Deployment Type 2024 & 2032
- Figure 28: North America Simulation Software Industry Volume (K Unit), by Deployment Type 2024 & 2032
- Figure 29: North America Simulation Software Industry Revenue Share (%), by Deployment Type 2024 & 2032
- Figure 30: North America Simulation Software Industry Volume Share (%), by Deployment Type 2024 & 2032
- Figure 31: North America Simulation Software Industry Revenue (Million), by End-user Industry 2024 & 2032
- Figure 32: North America Simulation Software Industry Volume (K Unit), by End-user Industry 2024 & 2032
- Figure 33: North America Simulation Software Industry Revenue Share (%), by End-user Industry 2024 & 2032
- Figure 34: North America Simulation Software Industry Volume Share (%), by End-user Industry 2024 & 2032
- Figure 35: North America Simulation Software Industry Revenue (Million), by Country 2024 & 2032
- Figure 36: North America Simulation Software Industry Volume (K Unit), by Country 2024 & 2032
- Figure 37: North America Simulation Software Industry Revenue Share (%), by Country 2024 & 2032
- Figure 38: North America Simulation Software Industry Volume Share (%), by Country 2024 & 2032
- Figure 39: Europe Simulation Software Industry Revenue (Million), by Deployment Type 2024 & 2032
- Figure 40: Europe Simulation Software Industry Volume (K Unit), by Deployment Type 2024 & 2032
- Figure 41: Europe Simulation Software Industry Revenue Share (%), by Deployment Type 2024 & 2032
- Figure 42: Europe Simulation Software Industry Volume Share (%), by Deployment Type 2024 & 2032
- Figure 43: Europe Simulation Software Industry Revenue (Million), by End-user Industry 2024 & 2032
- Figure 44: Europe Simulation Software Industry Volume (K Unit), by End-user Industry 2024 & 2032
- Figure 45: Europe Simulation Software Industry Revenue Share (%), by End-user Industry 2024 & 2032
- Figure 46: Europe Simulation Software Industry Volume Share (%), by End-user Industry 2024 & 2032
- Figure 47: Europe Simulation Software Industry Revenue (Million), by Country 2024 & 2032
- Figure 48: Europe Simulation Software Industry Volume (K Unit), by Country 2024 & 2032
- Figure 49: Europe Simulation Software Industry Revenue Share (%), by Country 2024 & 2032
- Figure 50: Europe Simulation Software Industry Volume Share (%), by Country 2024 & 2032
- Figure 51: Asia Simulation Software Industry Revenue (Million), by Deployment Type 2024 & 2032
- Figure 52: Asia Simulation Software Industry Volume (K Unit), by Deployment Type 2024 & 2032
- Figure 53: Asia Simulation Software Industry Revenue Share (%), by Deployment Type 2024 & 2032
- Figure 54: Asia Simulation Software Industry Volume Share (%), by Deployment Type 2024 & 2032
- Figure 55: Asia Simulation Software Industry Revenue (Million), by End-user Industry 2024 & 2032
- Figure 56: Asia Simulation Software Industry Volume (K Unit), by End-user Industry 2024 & 2032
- Figure 57: Asia Simulation Software Industry Revenue Share (%), by End-user Industry 2024 & 2032
- Figure 58: Asia Simulation Software Industry Volume Share (%), by End-user Industry 2024 & 2032
- Figure 59: Asia Simulation Software Industry Revenue (Million), by Country 2024 & 2032
- Figure 60: Asia Simulation Software Industry Volume (K Unit), by Country 2024 & 2032
- Figure 61: Asia Simulation Software Industry Revenue Share (%), by Country 2024 & 2032
- Figure 62: Asia Simulation Software Industry Volume Share (%), by Country 2024 & 2032
- Figure 63: Australia and New Zealand Simulation Software Industry Revenue (Million), by Deployment Type 2024 & 2032
- Figure 64: Australia and New Zealand Simulation Software Industry Volume (K Unit), by Deployment Type 2024 & 2032
- Figure 65: Australia and New Zealand Simulation Software Industry Revenue Share (%), by Deployment Type 2024 & 2032
- Figure 66: Australia and New Zealand Simulation Software Industry Volume Share (%), by Deployment Type 2024 & 2032
- Figure 67: Australia and New Zealand Simulation Software Industry Revenue (Million), by End-user Industry 2024 & 2032
- Figure 68: Australia and New Zealand Simulation Software Industry Volume (K Unit), by End-user Industry 2024 & 2032
- Figure 69: Australia and New Zealand Simulation Software Industry Revenue Share (%), by End-user Industry 2024 & 2032
- Figure 70: Australia and New Zealand Simulation Software Industry Volume Share (%), by End-user Industry 2024 & 2032
- Figure 71: Australia and New Zealand Simulation Software Industry Revenue (Million), by Country 2024 & 2032
- Figure 72: Australia and New Zealand Simulation Software Industry Volume (K Unit), by Country 2024 & 2032
- Figure 73: Australia and New Zealand Simulation Software Industry Revenue Share (%), by Country 2024 & 2032
- Figure 74: Australia and New Zealand Simulation Software Industry Volume Share (%), by Country 2024 & 2032
- Figure 75: Latin America Simulation Software Industry Revenue (Million), by Deployment Type 2024 & 2032
- Figure 76: Latin America Simulation Software Industry Volume (K Unit), by Deployment Type 2024 & 2032
- Figure 77: Latin America Simulation Software Industry Revenue Share (%), by Deployment Type 2024 & 2032
- Figure 78: Latin America Simulation Software Industry Volume Share (%), by Deployment Type 2024 & 2032
- Figure 79: Latin America Simulation Software Industry Revenue (Million), by End-user Industry 2024 & 2032
- Figure 80: Latin America Simulation Software Industry Volume (K Unit), by End-user Industry 2024 & 2032
- Figure 81: Latin America Simulation Software Industry Revenue Share (%), by End-user Industry 2024 & 2032
- Figure 82: Latin America Simulation Software Industry Volume Share (%), by End-user Industry 2024 & 2032
- Figure 83: Latin America Simulation Software Industry Revenue (Million), by Country 2024 & 2032
- Figure 84: Latin America Simulation Software Industry Volume (K Unit), by Country 2024 & 2032
- Figure 85: Latin America Simulation Software Industry Revenue Share (%), by Country 2024 & 2032
- Figure 86: Latin America Simulation Software Industry Volume Share (%), by Country 2024 & 2032
- Figure 87: Middle East and Africa Simulation Software Industry Revenue (Million), by Deployment Type 2024 & 2032
- Figure 88: Middle East and Africa Simulation Software Industry Volume (K Unit), by Deployment Type 2024 & 2032
- Figure 89: Middle East and Africa Simulation Software Industry Revenue Share (%), by Deployment Type 2024 & 2032
- Figure 90: Middle East and Africa Simulation Software Industry Volume Share (%), by Deployment Type 2024 & 2032
- Figure 91: Middle East and Africa Simulation Software Industry Revenue (Million), by End-user Industry 2024 & 2032
- Figure 92: Middle East and Africa Simulation Software Industry Volume (K Unit), by End-user Industry 2024 & 2032
- Figure 93: Middle East and Africa Simulation Software Industry Revenue Share (%), by End-user Industry 2024 & 2032
- Figure 94: Middle East and Africa Simulation Software Industry Volume Share (%), by End-user Industry 2024 & 2032
- Figure 95: Middle East and Africa Simulation Software Industry Revenue (Million), by Country 2024 & 2032
- Figure 96: Middle East and Africa Simulation Software Industry Volume (K Unit), by Country 2024 & 2032
- Figure 97: Middle East and Africa Simulation Software Industry Revenue Share (%), by Country 2024 & 2032
- Figure 98: Middle East and Africa Simulation Software Industry Volume Share (%), by Country 2024 & 2032
List of Tables
- Table 1: Global Simulation Software Industry Revenue Million Forecast, by Region 2019 & 2032
- Table 2: Global Simulation Software Industry Volume K Unit Forecast, by Region 2019 & 2032
- Table 3: Global Simulation Software Industry Revenue Million Forecast, by Deployment Type 2019 & 2032
- Table 4: Global Simulation Software Industry Volume K Unit Forecast, by Deployment Type 2019 & 2032
- Table 5: Global Simulation Software Industry Revenue Million Forecast, by End-user Industry 2019 & 2032
- Table 6: Global Simulation Software Industry Volume K Unit Forecast, by End-user Industry 2019 & 2032
- Table 7: Global Simulation Software Industry Revenue Million Forecast, by Region 2019 & 2032
- Table 8: Global Simulation Software Industry Volume K Unit Forecast, by Region 2019 & 2032
- Table 9: Global Simulation Software Industry Revenue Million Forecast, by Country 2019 & 2032
- Table 10: Global Simulation Software Industry Volume K Unit Forecast, by Country 2019 & 2032
- Table 11: United States Simulation Software Industry Revenue (Million) Forecast, by Application 2019 & 2032
- Table 12: United States Simulation Software Industry Volume (K Unit) Forecast, by Application 2019 & 2032
- Table 13: Canada Simulation Software Industry Revenue (Million) Forecast, by Application 2019 & 2032
- Table 14: Canada Simulation Software Industry Volume (K Unit) Forecast, by Application 2019 & 2032
- Table 15: Mexico Simulation Software Industry Revenue (Million) Forecast, by Application 2019 & 2032
- Table 16: Mexico Simulation Software Industry Volume (K Unit) Forecast, by Application 2019 & 2032
- Table 17: Global Simulation Software Industry Revenue Million Forecast, by Country 2019 & 2032
- Table 18: Global Simulation Software Industry Volume K Unit Forecast, by Country 2019 & 2032
- Table 19: Germany Simulation Software Industry Revenue (Million) Forecast, by Application 2019 & 2032
- Table 20: Germany Simulation Software Industry Volume (K Unit) Forecast, by Application 2019 & 2032
- Table 21: United Kingdom Simulation Software Industry Revenue (Million) Forecast, by Application 2019 & 2032
- Table 22: United Kingdom Simulation Software Industry Volume (K Unit) Forecast, by Application 2019 & 2032
- Table 23: France Simulation Software Industry Revenue (Million) Forecast, by Application 2019 & 2032
- Table 24: France Simulation Software Industry Volume (K Unit) Forecast, by Application 2019 & 2032
- Table 25: Spain Simulation Software Industry Revenue (Million) Forecast, by Application 2019 & 2032
- Table 26: Spain Simulation Software Industry Volume (K Unit) Forecast, by Application 2019 & 2032
- Table 27: Italy Simulation Software Industry Revenue (Million) Forecast, by Application 2019 & 2032
- Table 28: Italy Simulation Software Industry Volume (K Unit) Forecast, by Application 2019 & 2032
- Table 29: Spain Simulation Software Industry Revenue (Million) Forecast, by Application 2019 & 2032
- Table 30: Spain Simulation Software Industry Volume (K Unit) Forecast, by Application 2019 & 2032
- Table 31: Belgium Simulation Software Industry Revenue (Million) Forecast, by Application 2019 & 2032
- Table 32: Belgium Simulation Software Industry Volume (K Unit) Forecast, by Application 2019 & 2032
- Table 33: Netherland Simulation Software Industry Revenue (Million) Forecast, by Application 2019 & 2032
- Table 34: Netherland Simulation Software Industry Volume (K Unit) Forecast, by Application 2019 & 2032
- Table 35: Nordics Simulation Software Industry Revenue (Million) Forecast, by Application 2019 & 2032
- Table 36: Nordics Simulation Software Industry Volume (K Unit) Forecast, by Application 2019 & 2032
- Table 37: Rest of Europe Simulation Software Industry Revenue (Million) Forecast, by Application 2019 & 2032
- Table 38: Rest of Europe Simulation Software Industry Volume (K Unit) Forecast, by Application 2019 & 2032
- Table 39: Global Simulation Software Industry Revenue Million Forecast, by Country 2019 & 2032
- Table 40: Global Simulation Software Industry Volume K Unit Forecast, by Country 2019 & 2032
- Table 41: China Simulation Software Industry Revenue (Million) Forecast, by Application 2019 & 2032
- Table 42: China Simulation Software Industry Volume (K Unit) Forecast, by Application 2019 & 2032
- Table 43: Japan Simulation Software Industry Revenue (Million) Forecast, by Application 2019 & 2032
- Table 44: Japan Simulation Software Industry Volume (K Unit) Forecast, by Application 2019 & 2032
- Table 45: India Simulation Software Industry Revenue (Million) Forecast, by Application 2019 & 2032
- Table 46: India Simulation Software Industry Volume (K Unit) Forecast, by Application 2019 & 2032
- Table 47: South Korea Simulation Software Industry Revenue (Million) Forecast, by Application 2019 & 2032
- Table 48: South Korea Simulation Software Industry Volume (K Unit) Forecast, by Application 2019 & 2032
- Table 49: Southeast Asia Simulation Software Industry Revenue (Million) Forecast, by Application 2019 & 2032
- Table 50: Southeast Asia Simulation Software Industry Volume (K Unit) Forecast, by Application 2019 & 2032
- Table 51: Australia Simulation Software Industry Revenue (Million) Forecast, by Application 2019 & 2032
- Table 52: Australia Simulation Software Industry Volume (K Unit) Forecast, by Application 2019 & 2032
- Table 53: Indonesia Simulation Software Industry Revenue (Million) Forecast, by Application 2019 & 2032
- Table 54: Indonesia Simulation Software Industry Volume (K Unit) Forecast, by Application 2019 & 2032
- Table 55: Phillipes Simulation Software Industry Revenue (Million) Forecast, by Application 2019 & 2032
- Table 56: Phillipes Simulation Software Industry Volume (K Unit) Forecast, by Application 2019 & 2032
- Table 57: Singapore Simulation Software Industry Revenue (Million) Forecast, by Application 2019 & 2032
- Table 58: Singapore Simulation Software Industry Volume (K Unit) Forecast, by Application 2019 & 2032
- Table 59: Thailandc Simulation Software Industry Revenue (Million) Forecast, by Application 2019 & 2032
- Table 60: Thailandc Simulation Software Industry Volume (K Unit) Forecast, by Application 2019 & 2032
- Table 61: Rest of Asia Pacific Simulation Software Industry Revenue (Million) Forecast, by Application 2019 & 2032
- Table 62: Rest of Asia Pacific Simulation Software Industry Volume (K Unit) Forecast, by Application 2019 & 2032
- Table 63: Global Simulation Software Industry Revenue Million Forecast, by Country 2019 & 2032
- Table 64: Global Simulation Software Industry Volume K Unit Forecast, by Country 2019 & 2032
- Table 65: Brazil Simulation Software Industry Revenue (Million) Forecast, by Application 2019 & 2032
- Table 66: Brazil Simulation Software Industry Volume (K Unit) Forecast, by Application 2019 & 2032
- Table 67: Argentina Simulation Software Industry Revenue (Million) Forecast, by Application 2019 & 2032
- Table 68: Argentina Simulation Software Industry Volume (K Unit) Forecast, by Application 2019 & 2032
- Table 69: Peru Simulation Software Industry Revenue (Million) Forecast, by Application 2019 & 2032
- Table 70: Peru Simulation Software Industry Volume (K Unit) Forecast, by Application 2019 & 2032
- Table 71: Chile Simulation Software Industry Revenue (Million) Forecast, by Application 2019 & 2032
- Table 72: Chile Simulation Software Industry Volume (K Unit) Forecast, by Application 2019 & 2032
- Table 73: Colombia Simulation Software Industry Revenue (Million) Forecast, by Application 2019 & 2032
- Table 74: Colombia Simulation Software Industry Volume (K Unit) Forecast, by Application 2019 & 2032
- Table 75: Ecuador Simulation Software Industry Revenue (Million) Forecast, by Application 2019 & 2032
- Table 76: Ecuador Simulation Software Industry Volume (K Unit) Forecast, by Application 2019 & 2032
- Table 77: Venezuela Simulation Software Industry Revenue (Million) Forecast, by Application 2019 & 2032
- Table 78: Venezuela Simulation Software Industry Volume (K Unit) Forecast, by Application 2019 & 2032
- Table 79: Rest of South America Simulation Software Industry Revenue (Million) Forecast, by Application 2019 & 2032
- Table 80: Rest of South America Simulation Software Industry Volume (K Unit) Forecast, by Application 2019 & 2032
- Table 81: Global Simulation Software Industry Revenue Million Forecast, by Country 2019 & 2032
- Table 82: Global Simulation Software Industry Volume K Unit Forecast, by Country 2019 & 2032
- Table 83: United States Simulation Software Industry Revenue (Million) Forecast, by Application 2019 & 2032
- Table 84: United States Simulation Software Industry Volume (K Unit) Forecast, by Application 2019 & 2032
- Table 85: Canada Simulation Software Industry Revenue (Million) Forecast, by Application 2019 & 2032
- Table 86: Canada Simulation Software Industry Volume (K Unit) Forecast, by Application 2019 & 2032
- Table 87: Mexico Simulation Software Industry Revenue (Million) Forecast, by Application 2019 & 2032
- Table 88: Mexico Simulation Software Industry Volume (K Unit) Forecast, by Application 2019 & 2032
- Table 89: Global Simulation Software Industry Revenue Million Forecast, by Country 2019 & 2032
- Table 90: Global Simulation Software Industry Volume K Unit Forecast, by Country 2019 & 2032
- Table 91: United Arab Emirates Simulation Software Industry Revenue (Million) Forecast, by Application 2019 & 2032
- Table 92: United Arab Emirates Simulation Software Industry Volume (K Unit) Forecast, by Application 2019 & 2032
- Table 93: Saudi Arabia Simulation Software Industry Revenue (Million) Forecast, by Application 2019 & 2032
- Table 94: Saudi Arabia Simulation Software Industry Volume (K Unit) Forecast, by Application 2019 & 2032
- Table 95: South Africa Simulation Software Industry Revenue (Million) Forecast, by Application 2019 & 2032
- Table 96: South Africa Simulation Software Industry Volume (K Unit) Forecast, by Application 2019 & 2032
- Table 97: Rest of Middle East and Africa Simulation Software Industry Revenue (Million) Forecast, by Application 2019 & 2032
- Table 98: Rest of Middle East and Africa Simulation Software Industry Volume (K Unit) Forecast, by Application 2019 & 2032
- Table 99: Global Simulation Software Industry Revenue Million Forecast, by Deployment Type 2019 & 2032
- Table 100: Global Simulation Software Industry Volume K Unit Forecast, by Deployment Type 2019 & 2032
- Table 101: Global Simulation Software Industry Revenue Million Forecast, by End-user Industry 2019 & 2032
- Table 102: Global Simulation Software Industry Volume K Unit Forecast, by End-user Industry 2019 & 2032
- Table 103: Global Simulation Software Industry Revenue Million Forecast, by Country 2019 & 2032
- Table 104: Global Simulation Software Industry Volume K Unit Forecast, by Country 2019 & 2032
- Table 105: Global Simulation Software Industry Revenue Million Forecast, by Deployment Type 2019 & 2032
- Table 106: Global Simulation Software Industry Volume K Unit Forecast, by Deployment Type 2019 & 2032
- Table 107: Global Simulation Software Industry Revenue Million Forecast, by End-user Industry 2019 & 2032
- Table 108: Global Simulation Software Industry Volume K Unit Forecast, by End-user Industry 2019 & 2032
- Table 109: Global Simulation Software Industry Revenue Million Forecast, by Country 2019 & 2032
- Table 110: Global Simulation Software Industry Volume K Unit Forecast, by Country 2019 & 2032
- Table 111: Global Simulation Software Industry Revenue Million Forecast, by Deployment Type 2019 & 2032
- Table 112: Global Simulation Software Industry Volume K Unit Forecast, by Deployment Type 2019 & 2032
- Table 113: Global Simulation Software Industry Revenue Million Forecast, by End-user Industry 2019 & 2032
- Table 114: Global Simulation Software Industry Volume K Unit Forecast, by End-user Industry 2019 & 2032
- Table 115: Global Simulation Software Industry Revenue Million Forecast, by Country 2019 & 2032
- Table 116: Global Simulation Software Industry Volume K Unit Forecast, by Country 2019 & 2032
- Table 117: Global Simulation Software Industry Revenue Million Forecast, by Deployment Type 2019 & 2032
- Table 118: Global Simulation Software Industry Volume K Unit Forecast, by Deployment Type 2019 & 2032
- Table 119: Global Simulation Software Industry Revenue Million Forecast, by End-user Industry 2019 & 2032
- Table 120: Global Simulation Software Industry Volume K Unit Forecast, by End-user Industry 2019 & 2032
- Table 121: Global Simulation Software Industry Revenue Million Forecast, by Country 2019 & 2032
- Table 122: Global Simulation Software Industry Volume K Unit Forecast, by Country 2019 & 2032
- Table 123: Global Simulation Software Industry Revenue Million Forecast, by Deployment Type 2019 & 2032
- Table 124: Global Simulation Software Industry Volume K Unit Forecast, by Deployment Type 2019 & 2032
- Table 125: Global Simulation Software Industry Revenue Million Forecast, by End-user Industry 2019 & 2032
- Table 126: Global Simulation Software Industry Volume K Unit Forecast, by End-user Industry 2019 & 2032
- Table 127: Global Simulation Software Industry Revenue Million Forecast, by Country 2019 & 2032
- Table 128: Global Simulation Software Industry Volume K Unit Forecast, by Country 2019 & 2032
- Table 129: Global Simulation Software Industry Revenue Million Forecast, by Deployment Type 2019 & 2032
- Table 130: Global Simulation Software Industry Volume K Unit Forecast, by Deployment Type 2019 & 2032
- Table 131: Global Simulation Software Industry Revenue Million Forecast, by End-user Industry 2019 & 2032
- Table 132: Global Simulation Software Industry Volume K Unit Forecast, by End-user Industry 2019 & 2032
- Table 133: Global Simulation Software Industry Revenue Million Forecast, by Country 2019 & 2032
- Table 134: Global Simulation Software Industry Volume K Unit Forecast, by Country 2019 & 2032
Frequently Asked Questions
1. What is the projected Compound Annual Growth Rate (CAGR) of the Simulation Software Industry?
The projected CAGR is approximately 12.06%.
2. Which companies are prominent players in the Simulation Software Industry?
Key companies in the market include CPFD Software LLC, Bentley Systems Incorporated, Ansys Inc, Dassault Systèmes SE, Design Simulation Technologies Inc, Schneider Electric SE, SolidWorks Corporation, SIMUL8 Corporation, Cybernet Systems Corp, Simio LLC, Siemens AG, Altair Engineering Inc, CONSELF Srl, PTC Inc, The MathWorks Inc, Autodesk Inc, Synopsys Inc, Rockwell Automation Inc, The COMSOL Group, Lanner Group Ltd.
3. What are the main segments of the Simulation Software Industry?
The market segments include Deployment Type, End-user Industry.
4. Can you provide details about the market size?
The market size is estimated to be USD 12.12 Million as of 2022.
5. What are some drivers contributing to market growth?
Growing Automotive Sector.
6. What are the notable trends driving market growth?
Automotive Segment is expected grow at a faster pace..
7. Are there any restraints impacting market growth?
Fluctuating Market Demands and Customization Issues.
8. Can you provide examples of recent developments in the market?
In March 2023, Simulations Plus, Inc., a provider of modeling and simulation software and services for pharmaceutical protection and effectiveness, announced that it joined into a cooperative research contract with the Institute of Medical Biology of the Polish Academy of Sciences to develop new compounds for the RORγ/RORγT nuclear receptors using its advanced artificial intelligence machine learning technology in the ADMET Predictor software platform.
9. What pricing options are available for accessing the report?
Pricing options include single-user, multi-user, and enterprise licenses priced at USD 4750, USD 5250, and USD 8750 respectively.
10. Is the market size provided in terms of value or volume?
The market size is provided in terms of value, measured in Million and volume, measured in K Unit.
11. Are there any specific market keywords associated with the report?
Yes, the market keyword associated with the report is "Simulation Software Industry," which aids in identifying and referencing the specific market segment covered.
12. How do I determine which pricing option suits my needs best?
The pricing options vary based on user requirements and access needs. Individual users may opt for single-user licenses, while businesses requiring broader access may choose multi-user or enterprise licenses for cost-effective access to the report.
13. Are there any additional resources or data provided in the Simulation Software Industry report?
While the report offers comprehensive insights, it's advisable to review the specific contents or supplementary materials provided to ascertain if additional resources or data are available.
14. How can I stay updated on further developments or reports in the Simulation Software Industry?
To stay informed about further developments, trends, and reports in the Simulation Software Industry, consider subscribing to industry newsletters, following relevant companies and organizations, or regularly checking reputable industry news sources and publications.
Methodology
Step 1 - Identification of Relevant Samples Size from Population Database


Step 2 - Approaches for Defining Global Market Size (Value, Volume* & Price*)

Note*: In applicable scenarios
Step 3 - Data Sources
Primary Research
- Web Analytics
- Survey Reports
- Research Institute
- Latest Research Reports
- Opinion Leaders
Secondary Research
- Annual Reports
- White Paper
- Latest Press Release
- Industry Association
- Paid Database
- Investor Presentations

Step 4 - Data Triangulation
Involves using different sources of information in order to increase the validity of a study
These sources are likely to be stakeholders in a program - participants, other researchers, program staff, other community members, and so on.
Then we put all data in single framework & apply various statistical tools to find out the dynamic on the market.
During the analysis stage, feedback from the stakeholder groups would be compared to determine areas of agreement as well as areas of divergence


