
Key Insights
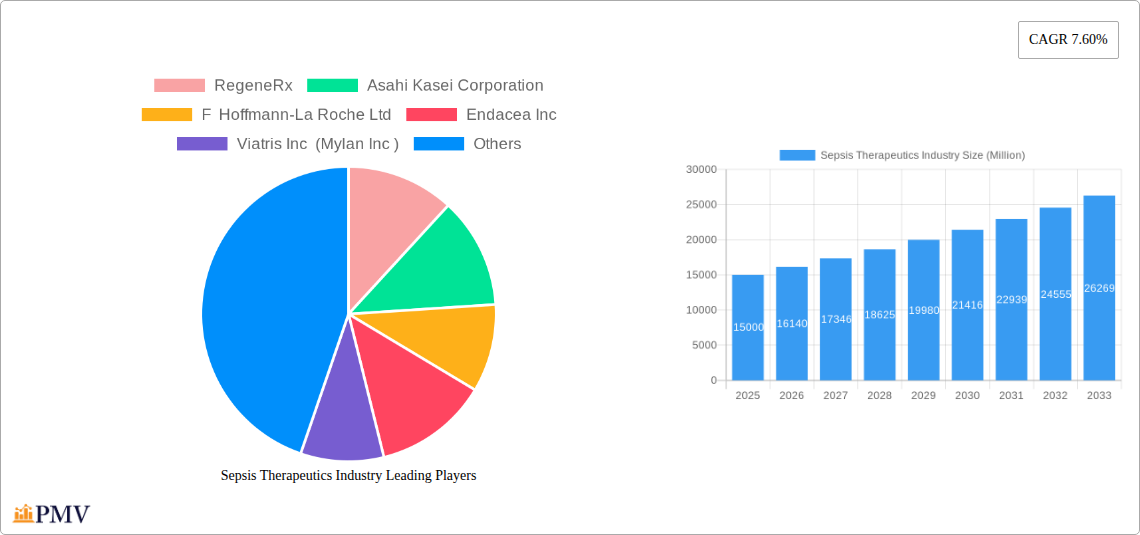
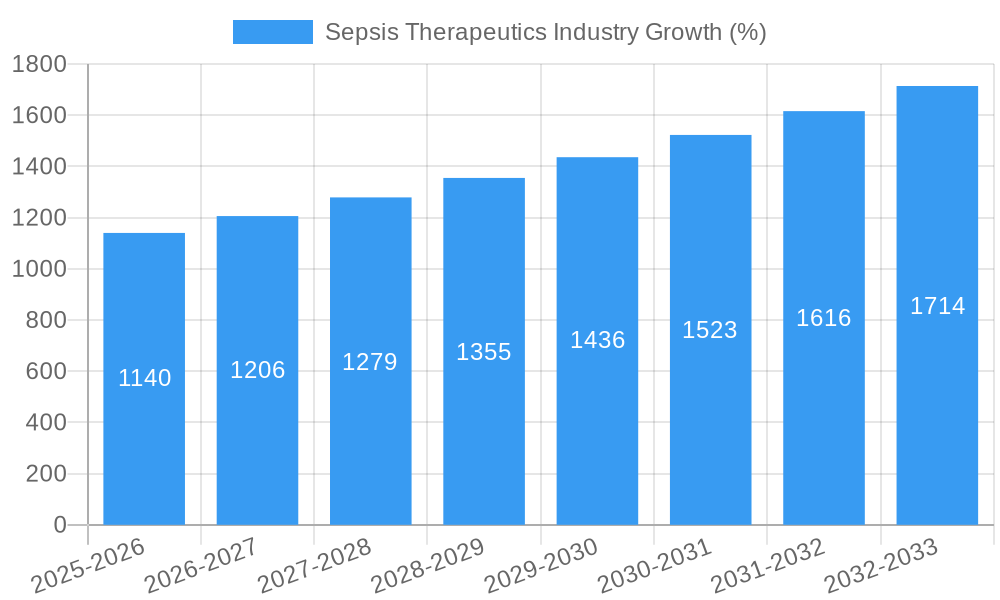
The global sepsis therapeutics market, currently experiencing robust growth, is projected to maintain a significant upward trajectory throughout the forecast period (2025-2033). A 7.60% Compound Annual Growth Rate (CAGR) indicates substantial market expansion, driven by several key factors. The rising prevalence of sepsis, particularly in aging populations and individuals with compromised immune systems, is a primary driver. Advancements in diagnostic technologies leading to earlier and more accurate sepsis detection are also fueling market growth. Furthermore, the development and introduction of novel therapeutic agents, including targeted antibiotics and immunomodulatory therapies, are significantly impacting market dynamics. The market is segmented by drug class (Aminoglycosides, Cephalosporin, Glycopeptide Antibiotics, and Others) and route of administration (Intravenous and Oral), reflecting the diverse treatment approaches employed. Major players like Pfizer, GSK, AbbVie, and Roche are actively engaged in research and development, as well as strategic collaborations, to expand their market share and introduce innovative sepsis treatments. The competitive landscape is characterized by both established pharmaceutical giants and emerging biotech companies vying for a position in this rapidly expanding market.
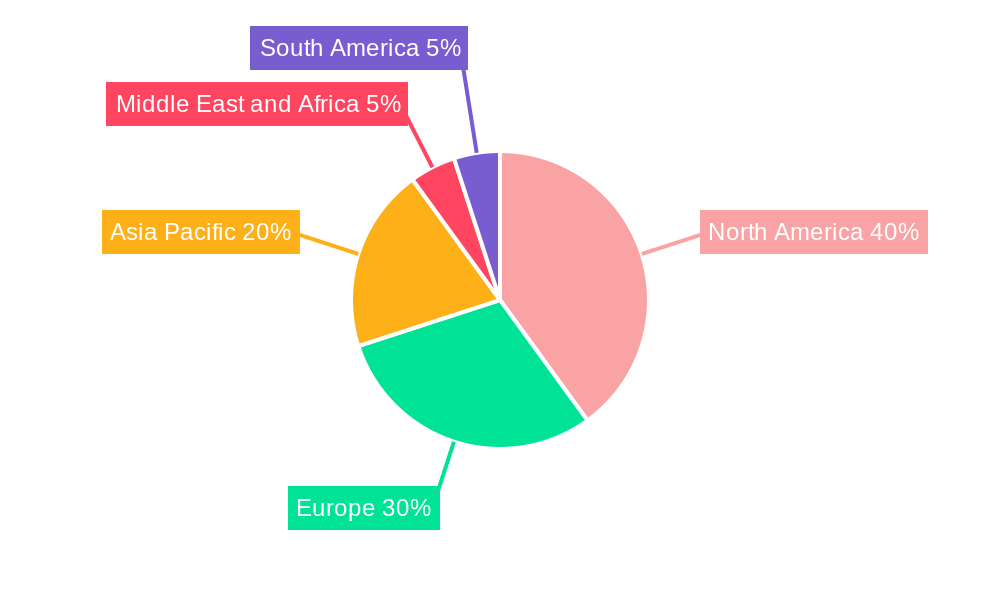
Significant regional variations exist in market size and growth rate. North America, with its advanced healthcare infrastructure and high prevalence of sepsis, currently holds a substantial market share. However, the Asia-Pacific region is expected to experience the fastest growth, driven by increasing healthcare expenditure and rising awareness about sepsis. Europe and other regions are also witnessing significant growth, albeit at a potentially slower pace than Asia-Pacific. Challenges remain, including the emergence of antibiotic resistance, high treatment costs, and the complexity of sepsis management. Addressing these challenges will require collaborative efforts between researchers, healthcare providers, and policymakers to ensure optimal patient outcomes and sustainable market growth. Future market expansion will likely be influenced by the success of ongoing clinical trials focusing on novel therapeutic approaches and the regulatory approvals of innovative drugs. Companies focusing on personalized medicine and addressing unmet needs in specific sepsis subpopulations are likely to gain a competitive advantage.
Sepsis Therapeutics Industry: A Comprehensive Market Report (2019-2033)
This in-depth report provides a comprehensive analysis of the Sepsis Therapeutics industry, offering invaluable insights for stakeholders, investors, and industry professionals. With a detailed study period spanning 2019-2033, a base year of 2025, and a forecast period of 2025-2033, this report offers a robust understanding of current market dynamics and future growth trajectories. The global market size is estimated at xx Million in 2025 and is projected to reach xx Million by 2033, exhibiting a CAGR of xx%.
Sepsis Therapeutics Industry Market Structure & Competitive Dynamics
This section analyzes the competitive landscape of the sepsis therapeutics market, encompassing market concentration, innovation ecosystems, regulatory frameworks, product substitutes, end-user trends, and mergers & acquisitions (M&A) activities. The market is characterized by the presence of both large multinational pharmaceutical companies and smaller, specialized biotech firms. Market concentration is moderate, with several key players holding significant market share, but also with opportunities for smaller companies to innovate and gain traction.
The regulatory landscape, particularly concerning drug approvals (e.g., FDA approvals in the US), significantly influences market dynamics. The high cost of drug development and stringent regulatory requirements create barriers to entry for new players. M&A activity is substantial, driven by companies' efforts to expand their product portfolios and enhance their competitive positions. For example, the past five years have seen approximately xx Million in M&A deals in this sector, with a focus on acquiring companies with promising new therapies.
- Market Share: Pfizer, Roche, and GSK collectively hold approximately xx% of the market share in 2025.
- M&A Deal Values (2019-2024): Approximately xx Million in total deal value, with an average deal size of xx Million.
- Key Innovation Ecosystems: Collaboration between pharmaceutical companies, academic institutions, and research organizations is driving innovation in sepsis therapeutics.
- Product Substitutes: Existing antibiotics and supportive care remain substitutes; however, the demand for more effective and targeted therapies is increasing.
Sepsis Therapeutics Industry Trends & Insights
The sepsis therapeutics market is experiencing robust growth driven by several key factors. The rising prevalence of sepsis globally, coupled with an increasing awareness of the disease's severity, is a significant driver. Technological advancements, such as the development of novel antimicrobial agents and host-directed therapies, are also fueling market expansion. Furthermore, increased investment in research and development (R&D) by pharmaceutical companies is contributing to the introduction of innovative therapies.
Consumer preferences are shifting towards more targeted, effective, and safer treatments with fewer side effects. This demand is shaping the development of personalized medicine approaches in sepsis management. Competitive dynamics are intense, characterized by the ongoing development of innovative therapies and the increasing competition among established players and emerging biotech companies.
The market shows considerable growth, anticipated to reach xx Million by 2033. The historical period (2019-2024) witnessed a CAGR of xx%, while the forecast period (2025-2033) is projected to achieve a CAGR of xx%. Market penetration of new therapies is steadily increasing, with newer generations of antibiotics gaining market share.
Dominant Markets & Segments in Sepsis Therapeutics Industry
The North American region currently dominates the sepsis therapeutics market, driven by factors such as high healthcare expenditure, advanced medical infrastructure, and a relatively high prevalence of sepsis. Within the North American market, the United States holds the largest share.
Key Drivers for Dominance in North America:
- High Healthcare Expenditure: Significant investment in healthcare infrastructure and advanced medical technologies.
- Advanced Medical Infrastructure: Well-developed healthcare systems and access to specialized care facilities.
- High Prevalence of Sepsis: A larger population base and aging population contribute to a higher number of sepsis cases.
- Favorable Regulatory Environment: Supportive regulatory frameworks that facilitate drug development and approval.
By Drug Class: The "Other Drug Classes" segment is experiencing the fastest growth due to the emergence of novel therapies targeting different aspects of the disease's pathogenesis. The aminoglycosides segment holds a significant share due to the long-standing use of these antibiotics in sepsis treatment. The cephalosporin and glycopeptide antibiotics segments also hold substantial market share.
By Route of Administration: The intravenous (IV) route of administration is dominant, reflecting the severity of sepsis and the need for rapid delivery of treatment. However, the oral route is growing in importance for milder cases or as a follow-up treatment.
Sepsis Therapeutics Industry Product Innovations
Recent years have witnessed significant advancements in sepsis therapeutics, with a focus on developing novel antimicrobial agents that overcome antibiotic resistance and host-directed therapies targeting the inflammatory response. Technological trends, like targeted drug delivery and personalized medicine approaches, are transforming the treatment landscape. These innovations aim to improve treatment efficacy, reduce adverse effects, and enhance patient outcomes, leading to a better market fit and higher demand for newer, targeted therapies.
Report Segmentation & Scope
This report segments the sepsis therapeutics market by drug class (Aminoglycosides, Cephalosporin, Glycopeptide Antibiotics, Other Drug Classes) and by route of administration (Intravenous, Oral). Each segment's growth projection, market size, and competitive dynamics are analyzed in detail. The "Other Drug Classes" segment shows the highest growth potential due to the emergence of novel therapies. The intravenous route currently dominates but the oral segment is also witnessing substantial growth.
- Aminoglycosides: This segment is expected to witness moderate growth, driven by its established use and relatively lower cost compared to newer antibiotics. Competition is intense.
- Cephalosporin: This segment maintains a stable market position due to the widespread use of cephalosporin antibiotics in treating various infections, including sepsis.
- Glycopeptide Antibiotics: This segment shows moderate growth potential, driven by their effectiveness against Gram-positive bacteria.
- Other Drug Classes: This segment exhibits the highest growth potential due to the emergence of new therapies targeting different aspects of sepsis pathogenesis.
- Intravenous: This segment is projected to dominate the market due to its rapid effectiveness.
- Oral: This segment is experiencing faster growth due to the increased convenience and reduced hospital stay.
Key Drivers of Sepsis Therapeutics Industry Growth
The sepsis therapeutics market is propelled by several factors:
- Rising Prevalence of Sepsis: The increasing incidence of sepsis globally is a major driver.
- Technological Advancements: Innovations in antimicrobial agents and host-directed therapies are boosting growth.
- Increased R&D Investment: Significant investment by pharmaceutical companies fuels new drug development.
- Favorable Regulatory Environment: Government initiatives supporting sepsis research and drug development create conducive conditions for growth.
Challenges in the Sepsis Therapeutics Industry Sector
The sepsis therapeutics industry faces significant challenges:
- Antibiotic Resistance: The emergence of drug-resistant bacteria poses a substantial threat to treatment efficacy. The impact is a reduced effectiveness of existing therapies and increased treatment costs due to the need for stronger and more targeted drugs. This impact is estimated at approximately xx Million annually in increased treatment costs.
- High Development Costs: The high cost of R&D and regulatory approval processes hinders innovation.
- Supply Chain Disruptions: Global supply chain vulnerabilities can impact drug availability and affordability.
- Intense Competition: Competition among established and emerging companies creates pressure on pricing and profitability.
Leading Players in the Sepsis Therapeutics Industry Market
- RegeneRx
- Asahi Kasei Corporation
- F Hoffmann-La Roche Ltd
- Endacea Inc
- Viatris Inc (Mylan Inc)
- GSK Plc
- Inotrem SA
- Adrenomed AG
- AbbVie Inc (Allergan Pharmaceuticals Private Limited)
- Pfizer Inc
Key Developments in Sepsis Therapeutics Industry Sector
- May 2022: Phathom Pharmaceuticals received FDA approval for VOQUEZNA TRIPLE PAK and DUAL PAK for H. pylori infection. This approval boosts the market for therapies treating bacterial infections, indirectly impacting the sepsis treatment market.
- May 2022: Sepsis Alliance launched the Sepsis Innovation Collaborative (SIC), a public-private partnership aimed at accelerating sepsis research and development. This initiative is expected to significantly stimulate innovation and improve outcomes in sepsis treatment.
Strategic Sepsis Therapeutics Industry Market Outlook
The future of the sepsis therapeutics market holds immense potential. Continued advancements in antimicrobial agents, host-directed therapies, and diagnostic tools will drive growth. Strategic opportunities exist for companies focusing on personalized medicine, innovative drug delivery systems, and addressing antibiotic resistance. The growing awareness of sepsis coupled with increased funding for R&D will further accelerate market expansion. The market is poised for significant expansion, driven by ongoing innovation and unmet medical needs.
Sepsis Therapeutics Industry Segmentation
-
1. Drug Class
- 1.1. Aminoglycosides
- 1.2. Cephalosporin
- 1.3. Glycopeptide Antibiotics
- 1.4. Other Drug Classes
-
2. Route of Administration
- 2.1. Intravenous
- 2.2. Oral
Sepsis Therapeutics Industry Segmentation By Geography
-
1. North America
- 1.1. United States
- 1.2. Canada
- 1.3. Mexico
-
2. Europe
- 2.1. Germany
- 2.2. United Kingdom
- 2.3. France
- 2.4. Italy
- 2.5. Spain
- 2.6. Rest of Europe
-
3. Asia Pacific
- 3.1. China
- 3.2. Japan
- 3.3. India
- 3.4. Australia
- 3.5. South Korea
- 3.6. Rest of Asia Pacific
-
4. Middle East and Africa
- 4.1. GCC
- 4.2. South Africa
- 4.3. Rest of Middle East and Africa
-
5. South America
- 5.1. Brazil
- 5.2. Argentina
- 5.3. Rest of South America
Sepsis Therapeutics Industry REPORT HIGHLIGHTS
| Aspects | Details |
|---|---|
| Study Period | 2019-2033 |
| Base Year | 2024 |
| Estimated Year | 2025 |
| Forecast Period | 2025-2033 |
| Historical Period | 2019-2024 |
| Growth Rate | CAGR of 7.60% from 2019-2033 |
| Segmentation |
|
Table of Contents
- 1. Introduction
- 1.1. Research Scope
- 1.2. Market Segmentation
- 1.3. Research Methodology
- 1.4. Definitions and Assumptions
- 2. Executive Summary
- 2.1. Introduction
- 3. Market Dynamics
- 3.1. Introduction
- 3.2. Market Drivers
- 3.2.1. Increasing Incidence of Sepsis; High Prevalence of Sepsis in Infants; Rise in the Number of Pipeline Products and Upsurge in Research and Development Expenditures
- 3.3. Market Restrains
- 3.3.1. Lack of Initial Diagnostic Test for identifying Sepsis Conditions and Lack of Awareness
- 3.4. Market Trends
- 3.4.1. Cephalosporins Are Expected To Witness Growth Over The Forecast Period
- 4. Market Factor Analysis
- 4.1. Porters Five Forces
- 4.2. Supply/Value Chain
- 4.3. PESTEL analysis
- 4.4. Market Entropy
- 4.5. Patent/Trademark Analysis
- 5. Global Sepsis Therapeutics Industry Analysis, Insights and Forecast, 2019-2031
- 5.1. Market Analysis, Insights and Forecast - by Drug Class
- 5.1.1. Aminoglycosides
- 5.1.2. Cephalosporin
- 5.1.3. Glycopeptide Antibiotics
- 5.1.4. Other Drug Classes
- 5.2. Market Analysis, Insights and Forecast - by Route of Administration
- 5.2.1. Intravenous
- 5.2.2. Oral
- 5.3. Market Analysis, Insights and Forecast - by Region
- 5.3.1. North America
- 5.3.2. Europe
- 5.3.3. Asia Pacific
- 5.3.4. Middle East and Africa
- 5.3.5. South America
- 5.1. Market Analysis, Insights and Forecast - by Drug Class
- 6. North America Sepsis Therapeutics Industry Analysis, Insights and Forecast, 2019-2031
- 6.1. Market Analysis, Insights and Forecast - by Drug Class
- 6.1.1. Aminoglycosides
- 6.1.2. Cephalosporin
- 6.1.3. Glycopeptide Antibiotics
- 6.1.4. Other Drug Classes
- 6.2. Market Analysis, Insights and Forecast - by Route of Administration
- 6.2.1. Intravenous
- 6.2.2. Oral
- 6.1. Market Analysis, Insights and Forecast - by Drug Class
- 7. Europe Sepsis Therapeutics Industry Analysis, Insights and Forecast, 2019-2031
- 7.1. Market Analysis, Insights and Forecast - by Drug Class
- 7.1.1. Aminoglycosides
- 7.1.2. Cephalosporin
- 7.1.3. Glycopeptide Antibiotics
- 7.1.4. Other Drug Classes
- 7.2. Market Analysis, Insights and Forecast - by Route of Administration
- 7.2.1. Intravenous
- 7.2.2. Oral
- 7.1. Market Analysis, Insights and Forecast - by Drug Class
- 8. Asia Pacific Sepsis Therapeutics Industry Analysis, Insights and Forecast, 2019-2031
- 8.1. Market Analysis, Insights and Forecast - by Drug Class
- 8.1.1. Aminoglycosides
- 8.1.2. Cephalosporin
- 8.1.3. Glycopeptide Antibiotics
- 8.1.4. Other Drug Classes
- 8.2. Market Analysis, Insights and Forecast - by Route of Administration
- 8.2.1. Intravenous
- 8.2.2. Oral
- 8.1. Market Analysis, Insights and Forecast - by Drug Class
- 9. Middle East and Africa Sepsis Therapeutics Industry Analysis, Insights and Forecast, 2019-2031
- 9.1. Market Analysis, Insights and Forecast - by Drug Class
- 9.1.1. Aminoglycosides
- 9.1.2. Cephalosporin
- 9.1.3. Glycopeptide Antibiotics
- 9.1.4. Other Drug Classes
- 9.2. Market Analysis, Insights and Forecast - by Route of Administration
- 9.2.1. Intravenous
- 9.2.2. Oral
- 9.1. Market Analysis, Insights and Forecast - by Drug Class
- 10. South America Sepsis Therapeutics Industry Analysis, Insights and Forecast, 2019-2031
- 10.1. Market Analysis, Insights and Forecast - by Drug Class
- 10.1.1. Aminoglycosides
- 10.1.2. Cephalosporin
- 10.1.3. Glycopeptide Antibiotics
- 10.1.4. Other Drug Classes
- 10.2. Market Analysis, Insights and Forecast - by Route of Administration
- 10.2.1. Intravenous
- 10.2.2. Oral
- 10.1. Market Analysis, Insights and Forecast - by Drug Class
- 11. North America Sepsis Therapeutics Industry Analysis, Insights and Forecast, 2019-2031
- 11.1. Market Analysis, Insights and Forecast - By Country/Sub-region
- 11.1.1 United States
- 11.1.2 Canada
- 11.1.3 Mexico
- 12. Europe Sepsis Therapeutics Industry Analysis, Insights and Forecast, 2019-2031
- 12.1. Market Analysis, Insights and Forecast - By Country/Sub-region
- 12.1.1 Germany
- 12.1.2 United Kingdom
- 12.1.3 France
- 12.1.4 Italy
- 12.1.5 Spain
- 12.1.6 Rest of Europe
- 13. Asia Pacific Sepsis Therapeutics Industry Analysis, Insights and Forecast, 2019-2031
- 13.1. Market Analysis, Insights and Forecast - By Country/Sub-region
- 13.1.1 China
- 13.1.2 Japan
- 13.1.3 India
- 13.1.4 Australia
- 13.1.5 South Korea
- 13.1.6 Rest of Asia Pacific
- 14. Middle East and Africa Sepsis Therapeutics Industry Analysis, Insights and Forecast, 2019-2031
- 14.1. Market Analysis, Insights and Forecast - By Country/Sub-region
- 14.1.1 GCC
- 14.1.2 South Africa
- 14.1.3 Rest of Middle East and Africa
- 15. South America Sepsis Therapeutics Industry Analysis, Insights and Forecast, 2019-2031
- 15.1. Market Analysis, Insights and Forecast - By Country/Sub-region
- 15.1.1 Brazil
- 15.1.2 Argentina
- 15.1.3 Rest of South America
- 16. Competitive Analysis
- 16.1. Global Market Share Analysis 2024
- 16.2. Company Profiles
- 16.2.1 RegeneRx
- 16.2.1.1. Overview
- 16.2.1.2. Products
- 16.2.1.3. SWOT Analysis
- 16.2.1.4. Recent Developments
- 16.2.1.5. Financials (Based on Availability)
- 16.2.2 Asahi Kasei Corporation
- 16.2.2.1. Overview
- 16.2.2.2. Products
- 16.2.2.3. SWOT Analysis
- 16.2.2.4. Recent Developments
- 16.2.2.5. Financials (Based on Availability)
- 16.2.3 F Hoffmann-La Roche Ltd
- 16.2.3.1. Overview
- 16.2.3.2. Products
- 16.2.3.3. SWOT Analysis
- 16.2.3.4. Recent Developments
- 16.2.3.5. Financials (Based on Availability)
- 16.2.4 Endacea Inc
- 16.2.4.1. Overview
- 16.2.4.2. Products
- 16.2.4.3. SWOT Analysis
- 16.2.4.4. Recent Developments
- 16.2.4.5. Financials (Based on Availability)
- 16.2.5 Viatris Inc (Mylan Inc )
- 16.2.5.1. Overview
- 16.2.5.2. Products
- 16.2.5.3. SWOT Analysis
- 16.2.5.4. Recent Developments
- 16.2.5.5. Financials (Based on Availability)
- 16.2.6 GSK Plc
- 16.2.6.1. Overview
- 16.2.6.2. Products
- 16.2.6.3. SWOT Analysis
- 16.2.6.4. Recent Developments
- 16.2.6.5. Financials (Based on Availability)
- 16.2.7 Inotrem SA
- 16.2.7.1. Overview
- 16.2.7.2. Products
- 16.2.7.3. SWOT Analysis
- 16.2.7.4. Recent Developments
- 16.2.7.5. Financials (Based on Availability)
- 16.2.8 Adrenomed AG
- 16.2.8.1. Overview
- 16.2.8.2. Products
- 16.2.8.3. SWOT Analysis
- 16.2.8.4. Recent Developments
- 16.2.8.5. Financials (Based on Availability)
- 16.2.9 AbbVie Inc (Allergan Pharmaceuticals Private Limited)
- 16.2.9.1. Overview
- 16.2.9.2. Products
- 16.2.9.3. SWOT Analysis
- 16.2.9.4. Recent Developments
- 16.2.9.5. Financials (Based on Availability)
- 16.2.10 Pfizer Inc
- 16.2.10.1. Overview
- 16.2.10.2. Products
- 16.2.10.3. SWOT Analysis
- 16.2.10.4. Recent Developments
- 16.2.10.5. Financials (Based on Availability)
- 16.2.1 RegeneRx
List of Figures
- Figure 1: Global Sepsis Therapeutics Industry Revenue Breakdown (Million, %) by Region 2024 & 2032
- Figure 2: Global Sepsis Therapeutics Industry Volume Breakdown (K Unit, %) by Region 2024 & 2032
- Figure 3: North America Sepsis Therapeutics Industry Revenue (Million), by Country 2024 & 2032
- Figure 4: North America Sepsis Therapeutics Industry Volume (K Unit), by Country 2024 & 2032
- Figure 5: North America Sepsis Therapeutics Industry Revenue Share (%), by Country 2024 & 2032
- Figure 6: North America Sepsis Therapeutics Industry Volume Share (%), by Country 2024 & 2032
- Figure 7: Europe Sepsis Therapeutics Industry Revenue (Million), by Country 2024 & 2032
- Figure 8: Europe Sepsis Therapeutics Industry Volume (K Unit), by Country 2024 & 2032
- Figure 9: Europe Sepsis Therapeutics Industry Revenue Share (%), by Country 2024 & 2032
- Figure 10: Europe Sepsis Therapeutics Industry Volume Share (%), by Country 2024 & 2032
- Figure 11: Asia Pacific Sepsis Therapeutics Industry Revenue (Million), by Country 2024 & 2032
- Figure 12: Asia Pacific Sepsis Therapeutics Industry Volume (K Unit), by Country 2024 & 2032
- Figure 13: Asia Pacific Sepsis Therapeutics Industry Revenue Share (%), by Country 2024 & 2032
- Figure 14: Asia Pacific Sepsis Therapeutics Industry Volume Share (%), by Country 2024 & 2032
- Figure 15: Middle East and Africa Sepsis Therapeutics Industry Revenue (Million), by Country 2024 & 2032
- Figure 16: Middle East and Africa Sepsis Therapeutics Industry Volume (K Unit), by Country 2024 & 2032
- Figure 17: Middle East and Africa Sepsis Therapeutics Industry Revenue Share (%), by Country 2024 & 2032
- Figure 18: Middle East and Africa Sepsis Therapeutics Industry Volume Share (%), by Country 2024 & 2032
- Figure 19: South America Sepsis Therapeutics Industry Revenue (Million), by Country 2024 & 2032
- Figure 20: South America Sepsis Therapeutics Industry Volume (K Unit), by Country 2024 & 2032
- Figure 21: South America Sepsis Therapeutics Industry Revenue Share (%), by Country 2024 & 2032
- Figure 22: South America Sepsis Therapeutics Industry Volume Share (%), by Country 2024 & 2032
- Figure 23: North America Sepsis Therapeutics Industry Revenue (Million), by Drug Class 2024 & 2032
- Figure 24: North America Sepsis Therapeutics Industry Volume (K Unit), by Drug Class 2024 & 2032
- Figure 25: North America Sepsis Therapeutics Industry Revenue Share (%), by Drug Class 2024 & 2032
- Figure 26: North America Sepsis Therapeutics Industry Volume Share (%), by Drug Class 2024 & 2032
- Figure 27: North America Sepsis Therapeutics Industry Revenue (Million), by Route of Administration 2024 & 2032
- Figure 28: North America Sepsis Therapeutics Industry Volume (K Unit), by Route of Administration 2024 & 2032
- Figure 29: North America Sepsis Therapeutics Industry Revenue Share (%), by Route of Administration 2024 & 2032
- Figure 30: North America Sepsis Therapeutics Industry Volume Share (%), by Route of Administration 2024 & 2032
- Figure 31: North America Sepsis Therapeutics Industry Revenue (Million), by Country 2024 & 2032
- Figure 32: North America Sepsis Therapeutics Industry Volume (K Unit), by Country 2024 & 2032
- Figure 33: North America Sepsis Therapeutics Industry Revenue Share (%), by Country 2024 & 2032
- Figure 34: North America Sepsis Therapeutics Industry Volume Share (%), by Country 2024 & 2032
- Figure 35: Europe Sepsis Therapeutics Industry Revenue (Million), by Drug Class 2024 & 2032
- Figure 36: Europe Sepsis Therapeutics Industry Volume (K Unit), by Drug Class 2024 & 2032
- Figure 37: Europe Sepsis Therapeutics Industry Revenue Share (%), by Drug Class 2024 & 2032
- Figure 38: Europe Sepsis Therapeutics Industry Volume Share (%), by Drug Class 2024 & 2032
- Figure 39: Europe Sepsis Therapeutics Industry Revenue (Million), by Route of Administration 2024 & 2032
- Figure 40: Europe Sepsis Therapeutics Industry Volume (K Unit), by Route of Administration 2024 & 2032
- Figure 41: Europe Sepsis Therapeutics Industry Revenue Share (%), by Route of Administration 2024 & 2032
- Figure 42: Europe Sepsis Therapeutics Industry Volume Share (%), by Route of Administration 2024 & 2032
- Figure 43: Europe Sepsis Therapeutics Industry Revenue (Million), by Country 2024 & 2032
- Figure 44: Europe Sepsis Therapeutics Industry Volume (K Unit), by Country 2024 & 2032
- Figure 45: Europe Sepsis Therapeutics Industry Revenue Share (%), by Country 2024 & 2032
- Figure 46: Europe Sepsis Therapeutics Industry Volume Share (%), by Country 2024 & 2032
- Figure 47: Asia Pacific Sepsis Therapeutics Industry Revenue (Million), by Drug Class 2024 & 2032
- Figure 48: Asia Pacific Sepsis Therapeutics Industry Volume (K Unit), by Drug Class 2024 & 2032
- Figure 49: Asia Pacific Sepsis Therapeutics Industry Revenue Share (%), by Drug Class 2024 & 2032
- Figure 50: Asia Pacific Sepsis Therapeutics Industry Volume Share (%), by Drug Class 2024 & 2032
- Figure 51: Asia Pacific Sepsis Therapeutics Industry Revenue (Million), by Route of Administration 2024 & 2032
- Figure 52: Asia Pacific Sepsis Therapeutics Industry Volume (K Unit), by Route of Administration 2024 & 2032
- Figure 53: Asia Pacific Sepsis Therapeutics Industry Revenue Share (%), by Route of Administration 2024 & 2032
- Figure 54: Asia Pacific Sepsis Therapeutics Industry Volume Share (%), by Route of Administration 2024 & 2032
- Figure 55: Asia Pacific Sepsis Therapeutics Industry Revenue (Million), by Country 2024 & 2032
- Figure 56: Asia Pacific Sepsis Therapeutics Industry Volume (K Unit), by Country 2024 & 2032
- Figure 57: Asia Pacific Sepsis Therapeutics Industry Revenue Share (%), by Country 2024 & 2032
- Figure 58: Asia Pacific Sepsis Therapeutics Industry Volume Share (%), by Country 2024 & 2032
- Figure 59: Middle East and Africa Sepsis Therapeutics Industry Revenue (Million), by Drug Class 2024 & 2032
- Figure 60: Middle East and Africa Sepsis Therapeutics Industry Volume (K Unit), by Drug Class 2024 & 2032
- Figure 61: Middle East and Africa Sepsis Therapeutics Industry Revenue Share (%), by Drug Class 2024 & 2032
- Figure 62: Middle East and Africa Sepsis Therapeutics Industry Volume Share (%), by Drug Class 2024 & 2032
- Figure 63: Middle East and Africa Sepsis Therapeutics Industry Revenue (Million), by Route of Administration 2024 & 2032
- Figure 64: Middle East and Africa Sepsis Therapeutics Industry Volume (K Unit), by Route of Administration 2024 & 2032
- Figure 65: Middle East and Africa Sepsis Therapeutics Industry Revenue Share (%), by Route of Administration 2024 & 2032
- Figure 66: Middle East and Africa Sepsis Therapeutics Industry Volume Share (%), by Route of Administration 2024 & 2032
- Figure 67: Middle East and Africa Sepsis Therapeutics Industry Revenue (Million), by Country 2024 & 2032
- Figure 68: Middle East and Africa Sepsis Therapeutics Industry Volume (K Unit), by Country 2024 & 2032
- Figure 69: Middle East and Africa Sepsis Therapeutics Industry Revenue Share (%), by Country 2024 & 2032
- Figure 70: Middle East and Africa Sepsis Therapeutics Industry Volume Share (%), by Country 2024 & 2032
- Figure 71: South America Sepsis Therapeutics Industry Revenue (Million), by Drug Class 2024 & 2032
- Figure 72: South America Sepsis Therapeutics Industry Volume (K Unit), by Drug Class 2024 & 2032
- Figure 73: South America Sepsis Therapeutics Industry Revenue Share (%), by Drug Class 2024 & 2032
- Figure 74: South America Sepsis Therapeutics Industry Volume Share (%), by Drug Class 2024 & 2032
- Figure 75: South America Sepsis Therapeutics Industry Revenue (Million), by Route of Administration 2024 & 2032
- Figure 76: South America Sepsis Therapeutics Industry Volume (K Unit), by Route of Administration 2024 & 2032
- Figure 77: South America Sepsis Therapeutics Industry Revenue Share (%), by Route of Administration 2024 & 2032
- Figure 78: South America Sepsis Therapeutics Industry Volume Share (%), by Route of Administration 2024 & 2032
- Figure 79: South America Sepsis Therapeutics Industry Revenue (Million), by Country 2024 & 2032
- Figure 80: South America Sepsis Therapeutics Industry Volume (K Unit), by Country 2024 & 2032
- Figure 81: South America Sepsis Therapeutics Industry Revenue Share (%), by Country 2024 & 2032
- Figure 82: South America Sepsis Therapeutics Industry Volume Share (%), by Country 2024 & 2032
List of Tables
- Table 1: Global Sepsis Therapeutics Industry Revenue Million Forecast, by Region 2019 & 2032
- Table 2: Global Sepsis Therapeutics Industry Volume K Unit Forecast, by Region 2019 & 2032
- Table 3: Global Sepsis Therapeutics Industry Revenue Million Forecast, by Drug Class 2019 & 2032
- Table 4: Global Sepsis Therapeutics Industry Volume K Unit Forecast, by Drug Class 2019 & 2032
- Table 5: Global Sepsis Therapeutics Industry Revenue Million Forecast, by Route of Administration 2019 & 2032
- Table 6: Global Sepsis Therapeutics Industry Volume K Unit Forecast, by Route of Administration 2019 & 2032
- Table 7: Global Sepsis Therapeutics Industry Revenue Million Forecast, by Region 2019 & 2032
- Table 8: Global Sepsis Therapeutics Industry Volume K Unit Forecast, by Region 2019 & 2032
- Table 9: Global Sepsis Therapeutics Industry Revenue Million Forecast, by Country 2019 & 2032
- Table 10: Global Sepsis Therapeutics Industry Volume K Unit Forecast, by Country 2019 & 2032
- Table 11: United States Sepsis Therapeutics Industry Revenue (Million) Forecast, by Application 2019 & 2032
- Table 12: United States Sepsis Therapeutics Industry Volume (K Unit) Forecast, by Application 2019 & 2032
- Table 13: Canada Sepsis Therapeutics Industry Revenue (Million) Forecast, by Application 2019 & 2032
- Table 14: Canada Sepsis Therapeutics Industry Volume (K Unit) Forecast, by Application 2019 & 2032
- Table 15: Mexico Sepsis Therapeutics Industry Revenue (Million) Forecast, by Application 2019 & 2032
- Table 16: Mexico Sepsis Therapeutics Industry Volume (K Unit) Forecast, by Application 2019 & 2032
- Table 17: Global Sepsis Therapeutics Industry Revenue Million Forecast, by Country 2019 & 2032
- Table 18: Global Sepsis Therapeutics Industry Volume K Unit Forecast, by Country 2019 & 2032
- Table 19: Germany Sepsis Therapeutics Industry Revenue (Million) Forecast, by Application 2019 & 2032
- Table 20: Germany Sepsis Therapeutics Industry Volume (K Unit) Forecast, by Application 2019 & 2032
- Table 21: United Kingdom Sepsis Therapeutics Industry Revenue (Million) Forecast, by Application 2019 & 2032
- Table 22: United Kingdom Sepsis Therapeutics Industry Volume (K Unit) Forecast, by Application 2019 & 2032
- Table 23: France Sepsis Therapeutics Industry Revenue (Million) Forecast, by Application 2019 & 2032
- Table 24: France Sepsis Therapeutics Industry Volume (K Unit) Forecast, by Application 2019 & 2032
- Table 25: Italy Sepsis Therapeutics Industry Revenue (Million) Forecast, by Application 2019 & 2032
- Table 26: Italy Sepsis Therapeutics Industry Volume (K Unit) Forecast, by Application 2019 & 2032
- Table 27: Spain Sepsis Therapeutics Industry Revenue (Million) Forecast, by Application 2019 & 2032
- Table 28: Spain Sepsis Therapeutics Industry Volume (K Unit) Forecast, by Application 2019 & 2032
- Table 29: Rest of Europe Sepsis Therapeutics Industry Revenue (Million) Forecast, by Application 2019 & 2032
- Table 30: Rest of Europe Sepsis Therapeutics Industry Volume (K Unit) Forecast, by Application 2019 & 2032
- Table 31: Global Sepsis Therapeutics Industry Revenue Million Forecast, by Country 2019 & 2032
- Table 32: Global Sepsis Therapeutics Industry Volume K Unit Forecast, by Country 2019 & 2032
- Table 33: China Sepsis Therapeutics Industry Revenue (Million) Forecast, by Application 2019 & 2032
- Table 34: China Sepsis Therapeutics Industry Volume (K Unit) Forecast, by Application 2019 & 2032
- Table 35: Japan Sepsis Therapeutics Industry Revenue (Million) Forecast, by Application 2019 & 2032
- Table 36: Japan Sepsis Therapeutics Industry Volume (K Unit) Forecast, by Application 2019 & 2032
- Table 37: India Sepsis Therapeutics Industry Revenue (Million) Forecast, by Application 2019 & 2032
- Table 38: India Sepsis Therapeutics Industry Volume (K Unit) Forecast, by Application 2019 & 2032
- Table 39: Australia Sepsis Therapeutics Industry Revenue (Million) Forecast, by Application 2019 & 2032
- Table 40: Australia Sepsis Therapeutics Industry Volume (K Unit) Forecast, by Application 2019 & 2032
- Table 41: South Korea Sepsis Therapeutics Industry Revenue (Million) Forecast, by Application 2019 & 2032
- Table 42: South Korea Sepsis Therapeutics Industry Volume (K Unit) Forecast, by Application 2019 & 2032
- Table 43: Rest of Asia Pacific Sepsis Therapeutics Industry Revenue (Million) Forecast, by Application 2019 & 2032
- Table 44: Rest of Asia Pacific Sepsis Therapeutics Industry Volume (K Unit) Forecast, by Application 2019 & 2032
- Table 45: Global Sepsis Therapeutics Industry Revenue Million Forecast, by Country 2019 & 2032
- Table 46: Global Sepsis Therapeutics Industry Volume K Unit Forecast, by Country 2019 & 2032
- Table 47: GCC Sepsis Therapeutics Industry Revenue (Million) Forecast, by Application 2019 & 2032
- Table 48: GCC Sepsis Therapeutics Industry Volume (K Unit) Forecast, by Application 2019 & 2032
- Table 49: South Africa Sepsis Therapeutics Industry Revenue (Million) Forecast, by Application 2019 & 2032
- Table 50: South Africa Sepsis Therapeutics Industry Volume (K Unit) Forecast, by Application 2019 & 2032
- Table 51: Rest of Middle East and Africa Sepsis Therapeutics Industry Revenue (Million) Forecast, by Application 2019 & 2032
- Table 52: Rest of Middle East and Africa Sepsis Therapeutics Industry Volume (K Unit) Forecast, by Application 2019 & 2032
- Table 53: Global Sepsis Therapeutics Industry Revenue Million Forecast, by Country 2019 & 2032
- Table 54: Global Sepsis Therapeutics Industry Volume K Unit Forecast, by Country 2019 & 2032
- Table 55: Brazil Sepsis Therapeutics Industry Revenue (Million) Forecast, by Application 2019 & 2032
- Table 56: Brazil Sepsis Therapeutics Industry Volume (K Unit) Forecast, by Application 2019 & 2032
- Table 57: Argentina Sepsis Therapeutics Industry Revenue (Million) Forecast, by Application 2019 & 2032
- Table 58: Argentina Sepsis Therapeutics Industry Volume (K Unit) Forecast, by Application 2019 & 2032
- Table 59: Rest of South America Sepsis Therapeutics Industry Revenue (Million) Forecast, by Application 2019 & 2032
- Table 60: Rest of South America Sepsis Therapeutics Industry Volume (K Unit) Forecast, by Application 2019 & 2032
- Table 61: Global Sepsis Therapeutics Industry Revenue Million Forecast, by Drug Class 2019 & 2032
- Table 62: Global Sepsis Therapeutics Industry Volume K Unit Forecast, by Drug Class 2019 & 2032
- Table 63: Global Sepsis Therapeutics Industry Revenue Million Forecast, by Route of Administration 2019 & 2032
- Table 64: Global Sepsis Therapeutics Industry Volume K Unit Forecast, by Route of Administration 2019 & 2032
- Table 65: Global Sepsis Therapeutics Industry Revenue Million Forecast, by Country 2019 & 2032
- Table 66: Global Sepsis Therapeutics Industry Volume K Unit Forecast, by Country 2019 & 2032
- Table 67: United States Sepsis Therapeutics Industry Revenue (Million) Forecast, by Application 2019 & 2032
- Table 68: United States Sepsis Therapeutics Industry Volume (K Unit) Forecast, by Application 2019 & 2032
- Table 69: Canada Sepsis Therapeutics Industry Revenue (Million) Forecast, by Application 2019 & 2032
- Table 70: Canada Sepsis Therapeutics Industry Volume (K Unit) Forecast, by Application 2019 & 2032
- Table 71: Mexico Sepsis Therapeutics Industry Revenue (Million) Forecast, by Application 2019 & 2032
- Table 72: Mexico Sepsis Therapeutics Industry Volume (K Unit) Forecast, by Application 2019 & 2032
- Table 73: Global Sepsis Therapeutics Industry Revenue Million Forecast, by Drug Class 2019 & 2032
- Table 74: Global Sepsis Therapeutics Industry Volume K Unit Forecast, by Drug Class 2019 & 2032
- Table 75: Global Sepsis Therapeutics Industry Revenue Million Forecast, by Route of Administration 2019 & 2032
- Table 76: Global Sepsis Therapeutics Industry Volume K Unit Forecast, by Route of Administration 2019 & 2032
- Table 77: Global Sepsis Therapeutics Industry Revenue Million Forecast, by Country 2019 & 2032
- Table 78: Global Sepsis Therapeutics Industry Volume K Unit Forecast, by Country 2019 & 2032
- Table 79: Germany Sepsis Therapeutics Industry Revenue (Million) Forecast, by Application 2019 & 2032
- Table 80: Germany Sepsis Therapeutics Industry Volume (K Unit) Forecast, by Application 2019 & 2032
- Table 81: United Kingdom Sepsis Therapeutics Industry Revenue (Million) Forecast, by Application 2019 & 2032
- Table 82: United Kingdom Sepsis Therapeutics Industry Volume (K Unit) Forecast, by Application 2019 & 2032
- Table 83: France Sepsis Therapeutics Industry Revenue (Million) Forecast, by Application 2019 & 2032
- Table 84: France Sepsis Therapeutics Industry Volume (K Unit) Forecast, by Application 2019 & 2032
- Table 85: Italy Sepsis Therapeutics Industry Revenue (Million) Forecast, by Application 2019 & 2032
- Table 86: Italy Sepsis Therapeutics Industry Volume (K Unit) Forecast, by Application 2019 & 2032
- Table 87: Spain Sepsis Therapeutics Industry Revenue (Million) Forecast, by Application 2019 & 2032
- Table 88: Spain Sepsis Therapeutics Industry Volume (K Unit) Forecast, by Application 2019 & 2032
- Table 89: Rest of Europe Sepsis Therapeutics Industry Revenue (Million) Forecast, by Application 2019 & 2032
- Table 90: Rest of Europe Sepsis Therapeutics Industry Volume (K Unit) Forecast, by Application 2019 & 2032
- Table 91: Global Sepsis Therapeutics Industry Revenue Million Forecast, by Drug Class 2019 & 2032
- Table 92: Global Sepsis Therapeutics Industry Volume K Unit Forecast, by Drug Class 2019 & 2032
- Table 93: Global Sepsis Therapeutics Industry Revenue Million Forecast, by Route of Administration 2019 & 2032
- Table 94: Global Sepsis Therapeutics Industry Volume K Unit Forecast, by Route of Administration 2019 & 2032
- Table 95: Global Sepsis Therapeutics Industry Revenue Million Forecast, by Country 2019 & 2032
- Table 96: Global Sepsis Therapeutics Industry Volume K Unit Forecast, by Country 2019 & 2032
- Table 97: China Sepsis Therapeutics Industry Revenue (Million) Forecast, by Application 2019 & 2032
- Table 98: China Sepsis Therapeutics Industry Volume (K Unit) Forecast, by Application 2019 & 2032
- Table 99: Japan Sepsis Therapeutics Industry Revenue (Million) Forecast, by Application 2019 & 2032
- Table 100: Japan Sepsis Therapeutics Industry Volume (K Unit) Forecast, by Application 2019 & 2032
- Table 101: India Sepsis Therapeutics Industry Revenue (Million) Forecast, by Application 2019 & 2032
- Table 102: India Sepsis Therapeutics Industry Volume (K Unit) Forecast, by Application 2019 & 2032
- Table 103: Australia Sepsis Therapeutics Industry Revenue (Million) Forecast, by Application 2019 & 2032
- Table 104: Australia Sepsis Therapeutics Industry Volume (K Unit) Forecast, by Application 2019 & 2032
- Table 105: South Korea Sepsis Therapeutics Industry Revenue (Million) Forecast, by Application 2019 & 2032
- Table 106: South Korea Sepsis Therapeutics Industry Volume (K Unit) Forecast, by Application 2019 & 2032
- Table 107: Rest of Asia Pacific Sepsis Therapeutics Industry Revenue (Million) Forecast, by Application 2019 & 2032
- Table 108: Rest of Asia Pacific Sepsis Therapeutics Industry Volume (K Unit) Forecast, by Application 2019 & 2032
- Table 109: Global Sepsis Therapeutics Industry Revenue Million Forecast, by Drug Class 2019 & 2032
- Table 110: Global Sepsis Therapeutics Industry Volume K Unit Forecast, by Drug Class 2019 & 2032
- Table 111: Global Sepsis Therapeutics Industry Revenue Million Forecast, by Route of Administration 2019 & 2032
- Table 112: Global Sepsis Therapeutics Industry Volume K Unit Forecast, by Route of Administration 2019 & 2032
- Table 113: Global Sepsis Therapeutics Industry Revenue Million Forecast, by Country 2019 & 2032
- Table 114: Global Sepsis Therapeutics Industry Volume K Unit Forecast, by Country 2019 & 2032
- Table 115: GCC Sepsis Therapeutics Industry Revenue (Million) Forecast, by Application 2019 & 2032
- Table 116: GCC Sepsis Therapeutics Industry Volume (K Unit) Forecast, by Application 2019 & 2032
- Table 117: South Africa Sepsis Therapeutics Industry Revenue (Million) Forecast, by Application 2019 & 2032
- Table 118: South Africa Sepsis Therapeutics Industry Volume (K Unit) Forecast, by Application 2019 & 2032
- Table 119: Rest of Middle East and Africa Sepsis Therapeutics Industry Revenue (Million) Forecast, by Application 2019 & 2032
- Table 120: Rest of Middle East and Africa Sepsis Therapeutics Industry Volume (K Unit) Forecast, by Application 2019 & 2032
- Table 121: Global Sepsis Therapeutics Industry Revenue Million Forecast, by Drug Class 2019 & 2032
- Table 122: Global Sepsis Therapeutics Industry Volume K Unit Forecast, by Drug Class 2019 & 2032
- Table 123: Global Sepsis Therapeutics Industry Revenue Million Forecast, by Route of Administration 2019 & 2032
- Table 124: Global Sepsis Therapeutics Industry Volume K Unit Forecast, by Route of Administration 2019 & 2032
- Table 125: Global Sepsis Therapeutics Industry Revenue Million Forecast, by Country 2019 & 2032
- Table 126: Global Sepsis Therapeutics Industry Volume K Unit Forecast, by Country 2019 & 2032
- Table 127: Brazil Sepsis Therapeutics Industry Revenue (Million) Forecast, by Application 2019 & 2032
- Table 128: Brazil Sepsis Therapeutics Industry Volume (K Unit) Forecast, by Application 2019 & 2032
- Table 129: Argentina Sepsis Therapeutics Industry Revenue (Million) Forecast, by Application 2019 & 2032
- Table 130: Argentina Sepsis Therapeutics Industry Volume (K Unit) Forecast, by Application 2019 & 2032
- Table 131: Rest of South America Sepsis Therapeutics Industry Revenue (Million) Forecast, by Application 2019 & 2032
- Table 132: Rest of South America Sepsis Therapeutics Industry Volume (K Unit) Forecast, by Application 2019 & 2032
Frequently Asked Questions
1. What is the projected Compound Annual Growth Rate (CAGR) of the Sepsis Therapeutics Industry?
The projected CAGR is approximately 7.60%.
2. Which companies are prominent players in the Sepsis Therapeutics Industry?
Key companies in the market include RegeneRx, Asahi Kasei Corporation, F Hoffmann-La Roche Ltd, Endacea Inc, Viatris Inc (Mylan Inc ), GSK Plc, Inotrem SA, Adrenomed AG, AbbVie Inc (Allergan Pharmaceuticals Private Limited), Pfizer Inc.
3. What are the main segments of the Sepsis Therapeutics Industry?
The market segments include Drug Class, Route of Administration.
4. Can you provide details about the market size?
The market size is estimated to be USD XX Million as of 2022.
5. What are some drivers contributing to market growth?
Increasing Incidence of Sepsis; High Prevalence of Sepsis in Infants; Rise in the Number of Pipeline Products and Upsurge in Research and Development Expenditures.
6. What are the notable trends driving market growth?
Cephalosporins Are Expected To Witness Growth Over The Forecast Period.
7. Are there any restraints impacting market growth?
Lack of Initial Diagnostic Test for identifying Sepsis Conditions and Lack of Awareness.
8. Can you provide examples of recent developments in the market?
In May 2022, Phathom Pharmaceuticals, Inc. received the United States Food and Drug Administration (FDA) approval for VOQUEZNA TRIPLE PAK (vonoprazan tablets, amoxicillin capsules, clarithromycin tablets) and VOQUEZNA DUAL PAK (vonoprazan tablets, amoxicillin capsules), for the treatment of Helicobacter pylori (H. pylori) infection in adults. The two New Drug Applications for these products were previously granted as qualified infectious disease products (QIDP).
9. What pricing options are available for accessing the report?
Pricing options include single-user, multi-user, and enterprise licenses priced at USD 4750, USD 5250, and USD 8750 respectively.
10. Is the market size provided in terms of value or volume?
The market size is provided in terms of value, measured in Million and volume, measured in K Unit.
11. Are there any specific market keywords associated with the report?
Yes, the market keyword associated with the report is "Sepsis Therapeutics Industry," which aids in identifying and referencing the specific market segment covered.
12. How do I determine which pricing option suits my needs best?
The pricing options vary based on user requirements and access needs. Individual users may opt for single-user licenses, while businesses requiring broader access may choose multi-user or enterprise licenses for cost-effective access to the report.
13. Are there any additional resources or data provided in the Sepsis Therapeutics Industry report?
While the report offers comprehensive insights, it's advisable to review the specific contents or supplementary materials provided to ascertain if additional resources or data are available.
14. How can I stay updated on further developments or reports in the Sepsis Therapeutics Industry?
To stay informed about further developments, trends, and reports in the Sepsis Therapeutics Industry, consider subscribing to industry newsletters, following relevant companies and organizations, or regularly checking reputable industry news sources and publications.
Methodology
Step 1 - Identification of Relevant Samples Size from Population Database


Step 2 - Approaches for Defining Global Market Size (Value, Volume* & Price*)

Note*: In applicable scenarios
Step 3 - Data Sources
Primary Research
- Web Analytics
- Survey Reports
- Research Institute
- Latest Research Reports
- Opinion Leaders
Secondary Research
- Annual Reports
- White Paper
- Latest Press Release
- Industry Association
- Paid Database
- Investor Presentations

Step 4 - Data Triangulation
Involves using different sources of information in order to increase the validity of a study
These sources are likely to be stakeholders in a program - participants, other researchers, program staff, other community members, and so on.
Then we put all data in single framework & apply various statistical tools to find out the dynamic on the market.
During the analysis stage, feedback from the stakeholder groups would be compared to determine areas of agreement as well as areas of divergence


