
Key Insights
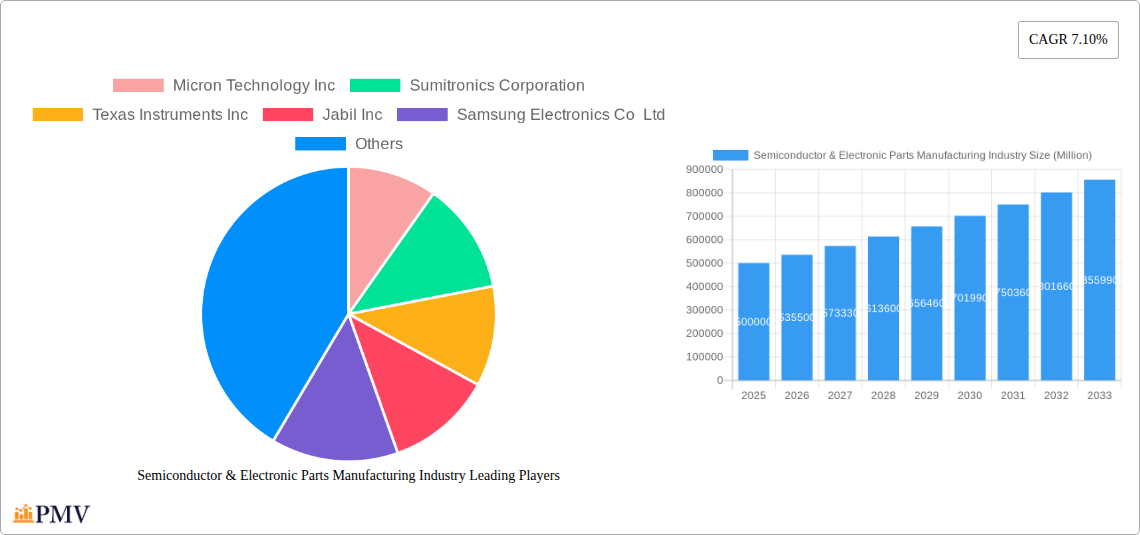
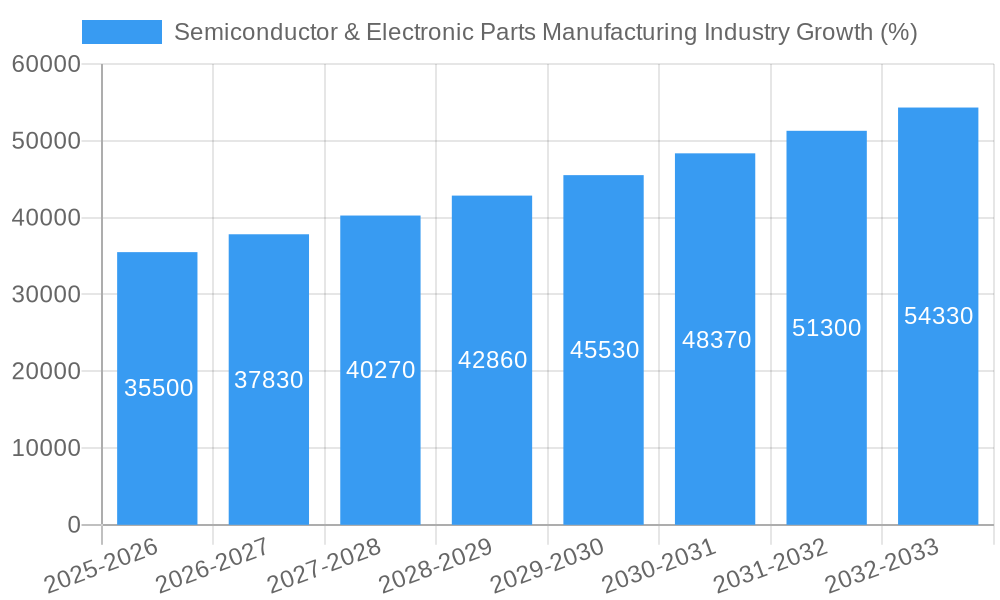
The Semiconductor & Electronic Parts Manufacturing industry is experiencing robust growth, projected to maintain a Compound Annual Growth Rate (CAGR) of 7.10% from 2025 to 2033. This expansion is fueled by several key drivers. The escalating demand for advanced electronics across diverse sectors like communications and networking, transportation (autonomous vehicles, electric vehicles), and consumer electronics (smartphones, wearables) is a primary catalyst. Furthermore, ongoing technological advancements, particularly in miniaturization, increased processing power, and energy efficiency, are driving innovation and expanding market opportunities. The industry's segmentation by component (equipment, software, and services) and application reflects this diverse landscape, with equipment, especially back-end equipment encompassing assembly, packaging, dicing, metrology, bonding, and wafer testing, representing a significant portion of the market. Major players like Micron Technology, Samsung Electronics, Texas Instruments, and Intel are actively investing in research and development, strengthening their market positions and contributing to overall industry growth.
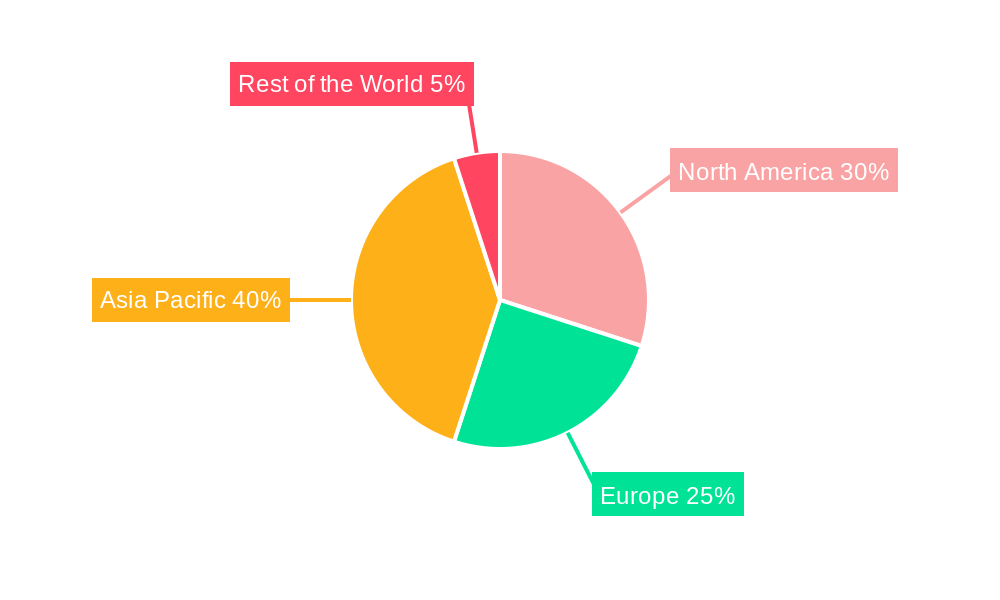
However, the industry also faces challenges. Supply chain disruptions, geopolitical uncertainties, and the increasing complexity of semiconductor manufacturing processes pose potential restraints. Fluctuations in raw material prices and the need for substantial capital investments in advanced manufacturing facilities also impact profitability. Despite these headwinds, the long-term outlook remains positive, driven by the pervasive integration of electronics into all facets of modern life. The ongoing shift towards 5G networks, the growth of the Internet of Things (IoT), and the increasing demand for high-performance computing are likely to further accelerate industry expansion throughout the forecast period. Regional growth will likely be driven by Asia-Pacific, specifically China, South Korea, and India, due to their strong manufacturing base and burgeoning electronics markets. North America and Europe will also contribute significantly due to their robust technological innovation and high consumption of electronic products.
This detailed report provides a comprehensive analysis of the Semiconductor & Electronic Parts Manufacturing industry, covering market size, growth drivers, competitive landscape, and future outlook. The study period spans from 2019 to 2033, with 2025 as the base and estimated year. The report offers actionable insights for businesses operating within this dynamic sector. With a focus on key players like Micron Technology Inc, Texas Instruments Inc, Samsung Electronics Co Ltd, and Taiwan Semiconductor Manufacturing Company Limited, this report is an essential resource for strategic decision-making. The report's detailed segmentation by component (Equipment, Back-End Equipment, Software, Services) and application (Communications, Transportation, Consumer Electronics, Other) provides granular market insights.
Semiconductor & Electronic Parts Manufacturing Industry Market Structure & Competitive Dynamics
The Semiconductor & Electronic Parts Manufacturing industry is characterized by high market concentration, with a few dominant players commanding significant market share. The industry's innovative ecosystem is vibrant, fueled by continuous technological advancements and substantial R&D investments. Stringent regulatory frameworks, particularly concerning environmental compliance and data security, shape industry practices. The presence of product substitutes, like alternative materials and technologies, keeps competitive pressure high. End-user trends, driven by the increasing demand for advanced electronics across various sectors, influence industry growth. Mergers and acquisitions (M&A) are frequent, reflecting consolidation efforts and strategic expansions. For example, the USD 7 Billion acquisition of Intel's SSD and NAND business by SK Hynix significantly altered the competitive landscape. The xx% market share held by the top 5 players demonstrates the oligopolistic nature of the market. The total value of M&A deals in the period 2019-2024 exceeded USD xx Million, indicating robust industry consolidation.
- Market Concentration: High, with a few major players dominating.
- Innovation: Continuous technological advancements drive growth.
- Regulation: Stringent environmental and data security regulations.
- Substitutes: Presence of alternative materials and technologies.
- End-User Trends: Growing demand for advanced electronics.
- M&A Activity: Frequent mergers and acquisitions for consolidation and expansion.
Semiconductor & Electronic Parts Manufacturing Industry Industry Trends & Insights
The Semiconductor & Electronic Parts Manufacturing industry exhibits robust growth, driven by factors such as the proliferation of smart devices, the rise of the Internet of Things (IoT), and the increasing adoption of automation and artificial intelligence (AI) across industries. Technological disruptions, including advancements in semiconductor materials and manufacturing processes (e.g., EUV lithography), continually reshape the market. Consumer preferences increasingly lean towards smaller, faster, and more energy-efficient devices, driving innovation in miniaturization and power management. Intense competition necessitates continuous product innovation and cost optimization. The industry's Compound Annual Growth Rate (CAGR) is projected to be xx% during the forecast period (2025-2033), with market penetration in key segments, such as 5G infrastructure and electric vehicles, expected to increase significantly. The market is witnessing a shift towards specialized chips tailored for specific applications, further driving segmentation. The increasing demand for high-performance computing and data centers also contributes significantly to market growth. Furthermore, government initiatives promoting domestic semiconductor manufacturing in various regions are bolstering investment and expansion.
Dominant Markets & Segments in Semiconductor & Electronic Parts Manufacturing Industry
The Asia-Pacific region, particularly countries like Taiwan, South Korea, and China, holds a dominant position in the Semiconductor & Electronic Parts Manufacturing industry. This dominance is attributable to:
- Established Manufacturing Bases: Presence of large-scale manufacturing facilities and a skilled workforce.
- Government Support: Supportive government policies and incentives for the semiconductor industry.
- Strong Supply Chains: Well-developed supply chains that facilitate efficient production.
- Technological Advancements: Significant investment in R&D leading to technological leadership.
The "Equipment" segment within the "By Component" category demonstrates significant growth potential due to the continuous need for advanced manufacturing equipment to meet increasing demand. Similarly, within the "By Application" category, the "Communications and Network Equipment" segment is experiencing high demand fueled by 5G deployment and data center expansion.
- Key Drivers for Asia-Pacific Dominance:
- Robust government support and investment.
- Highly skilled and cost-effective workforce.
- Well-established supply chains and infrastructure.
Semiconductor & Electronic Parts Manufacturing Industry Product Innovations
Recent product innovations include advancements in memory technologies (e.g., 3D NAND flash), high-performance computing chips tailored for AI and machine learning applications, and energy-efficient power management integrated circuits (PMICs). These innovations enhance performance, reduce power consumption, and improve overall efficiency, addressing key market demands for miniaturization and increased computing power. These advanced chips are gaining traction in high-growth applications, providing competitive advantages to manufacturers offering superior performance and features.
Report Segmentation & Scope
This report segments the Semiconductor & Electronic Parts Manufacturing industry in two key ways:
By Component:
- Equipment: Covers manufacturing equipment used in semiconductor production, showing strong growth due to capacity expansion. Market size is estimated at USD xx Million in 2025, projected to reach USD xx Million by 2033.
- Back-End Equipment: Includes assembly, packaging, dicing, metrology, bonding, and wafer testing equipment. This segment is experiencing steady growth driven by increasing chip complexity.
- Software: Encompasses design software, process control software, and data analytics tools. Growth is driven by the need for efficient and precise manufacturing.
- Services: Covers testing, maintenance, and other services related to semiconductor manufacturing and supply.
By Application:
- Communications and Network Equipment: A rapidly expanding segment driven by 5G deployment and data center expansion. Market size is projected to reach USD xx Million by 2033.
- Transportation: Growing demand from electric vehicles and autonomous driving systems.
- Consumer Electronics: Steady growth driven by the continued demand for smartphones, laptops, and other consumer electronics.
- Other Applications: Includes industrial automation, medical devices, and other emerging applications.
Key Drivers of Semiconductor & Electronic Parts Manufacturing Industry Growth
The Semiconductor & Electronic Parts Manufacturing industry's growth is propelled by several key factors:
- Technological Advancements: Continuous innovation in semiconductor technology drives demand for newer, faster, and more efficient devices.
- Increasing Demand for Electronics: The pervasive use of electronics across various sectors fuels industry growth.
- Government Initiatives: Government support and investment in semiconductor manufacturing stimulate industry expansion.
- Automation and AI: The rising adoption of automation and AI in various industries increases demand for advanced semiconductors.
Challenges in the Semiconductor & Electronic Parts Manufacturing Industry Sector
The industry faces significant challenges:
- Geopolitical Instability: Trade disputes and sanctions impact supply chains and investment decisions.
- Supply Chain Disruptions: Global supply chain vulnerabilities lead to material shortages and production delays.
- Talent Shortages: A lack of skilled engineers and technicians hinders industry growth.
- High Capital Expenditures: The high cost of setting up and maintaining semiconductor manufacturing facilities restricts entry and expansion.
Leading Players in the Semiconductor & Electronic Parts Manufacturing Industry Market
- Micron Technology Inc
- Sumitronics Corporation
- Texas Instruments Inc
- Jabil Inc
- Samsung Electronics Co Ltd
- Broadcom Inc
- Nortech Systems Incorporated
- SIIX Corporation
- SK Hynix Inc
- Qualcomm Technologies Inc
- Flex Ltd
- Taiwan Semiconductor Manufacturing Company Limited
- Intel Corporation
Key Developments in Semiconductor & Electronic Parts Manufacturing Industry Sector
- April 2022: Kyocera Corporation announced plans to build its largest manufacturing facility in Japan, expanding production capacity for organic semiconductor and crystal device packages.
- April 2022: SK Hynix announced a USD 7 Billion payment for the acquisition of Intel's SSD and NAND business.
- June 2022: Jabil Circuit announced a USD 400 Million investment in its Guadalajara, Mexico design center.
Strategic Semiconductor & Electronic Parts Manufacturing Industry Market Outlook
The Semiconductor & Electronic Parts Manufacturing industry is poised for continued strong growth, driven by technological advancements, increasing demand for electronics, and government support. Strategic opportunities exist in specialized semiconductor manufacturing, leveraging AI and machine learning for improved efficiency, and expanding into new applications. Companies focusing on sustainability and supply chain resilience will be best positioned for success in this dynamic market. The long-term outlook remains positive, with significant growth potential across various segments and regions.
Semiconductor & Electronic Parts Manufacturing Industry Segmentation
-
1. Component
-
1.1. Equipment
- 1.1.1. Front-En
- 1.1.2. Back-End
- 1.2. Software
-
1.3. Services
- 1.3.1. Electronics Design and Engineering
- 1.3.2. Electronics Assembly
- 1.3.3. Electronics Manufacturing
- 1.3.4. Other Service Types
-
1.1. Equipment
-
2. Application
- 2.1. Communications and Network Equipment
- 2.2. Transportation
- 2.3. Consumer Electronics
- 2.4. Other Applications
Semiconductor & Electronic Parts Manufacturing Industry Segmentation By Geography
-
1. North America
- 1.1. United States
- 1.2. Canada
-
2. Europe
- 2.1. United Kingdom
- 2.2. Italy
- 2.3. Germany
- 2.4. France
- 2.5. Rest of Europe
-
3. Asia Pacific
- 3.1. China
- 3.2. Japan
- 3.3. South Korea
- 3.4. India
- 3.5. Rest of Asia Pacific
- 4. Rest of the World
Semiconductor & Electronic Parts Manufacturing Industry REPORT HIGHLIGHTS
| Aspects | Details |
|---|---|
| Study Period | 2019-2033 |
| Base Year | 2024 |
| Estimated Year | 2025 |
| Forecast Period | 2025-2033 |
| Historical Period | 2019-2024 |
| Growth Rate | CAGR of 7.10% from 2019-2033 |
| Segmentation |
|
Table of Contents
- 1. Introduction
- 1.1. Research Scope
- 1.2. Market Segmentation
- 1.3. Research Methodology
- 1.4. Definitions and Assumptions
- 2. Executive Summary
- 2.1. Introduction
- 3. Market Dynamics
- 3.1. Introduction
- 3.2. Market Drivers
- 3.2.1 Growing Miniaturization; Adoption of Emerging Technologies in IIoT
- 3.2.2 Blockchain
- 3.2.3 and Enhanced Communication
- 3.3. Market Restrains
- 3.3.1. Increasing complexity due to miniaturization of components; Strict requirements to comply with legislations
- 3.4. Market Trends
- 3.4.1. Consumer Electronics to Hold a Significant Share
- 4. Market Factor Analysis
- 4.1. Porters Five Forces
- 4.2. Supply/Value Chain
- 4.3. PESTEL analysis
- 4.4. Market Entropy
- 4.5. Patent/Trademark Analysis
- 5. Global Semiconductor & Electronic Parts Manufacturing Industry Analysis, Insights and Forecast, 2019-2031
- 5.1. Market Analysis, Insights and Forecast - by Component
- 5.1.1. Equipment
- 5.1.1.1. Front-En
- 5.1.1.2. Back-End
- 5.1.2. Software
- 5.1.3. Services
- 5.1.3.1. Electronics Design and Engineering
- 5.1.3.2. Electronics Assembly
- 5.1.3.3. Electronics Manufacturing
- 5.1.3.4. Other Service Types
- 5.1.1. Equipment
- 5.2. Market Analysis, Insights and Forecast - by Application
- 5.2.1. Communications and Network Equipment
- 5.2.2. Transportation
- 5.2.3. Consumer Electronics
- 5.2.4. Other Applications
- 5.3. Market Analysis, Insights and Forecast - by Region
- 5.3.1. North America
- 5.3.2. Europe
- 5.3.3. Asia Pacific
- 5.3.4. Rest of the World
- 5.1. Market Analysis, Insights and Forecast - by Component
- 6. North America Semiconductor & Electronic Parts Manufacturing Industry Analysis, Insights and Forecast, 2019-2031
- 6.1. Market Analysis, Insights and Forecast - by Component
- 6.1.1. Equipment
- 6.1.1.1. Front-En
- 6.1.1.2. Back-End
- 6.1.2. Software
- 6.1.3. Services
- 6.1.3.1. Electronics Design and Engineering
- 6.1.3.2. Electronics Assembly
- 6.1.3.3. Electronics Manufacturing
- 6.1.3.4. Other Service Types
- 6.1.1. Equipment
- 6.2. Market Analysis, Insights and Forecast - by Application
- 6.2.1. Communications and Network Equipment
- 6.2.2. Transportation
- 6.2.3. Consumer Electronics
- 6.2.4. Other Applications
- 6.1. Market Analysis, Insights and Forecast - by Component
- 7. Europe Semiconductor & Electronic Parts Manufacturing Industry Analysis, Insights and Forecast, 2019-2031
- 7.1. Market Analysis, Insights and Forecast - by Component
- 7.1.1. Equipment
- 7.1.1.1. Front-En
- 7.1.1.2. Back-End
- 7.1.2. Software
- 7.1.3. Services
- 7.1.3.1. Electronics Design and Engineering
- 7.1.3.2. Electronics Assembly
- 7.1.3.3. Electronics Manufacturing
- 7.1.3.4. Other Service Types
- 7.1.1. Equipment
- 7.2. Market Analysis, Insights and Forecast - by Application
- 7.2.1. Communications and Network Equipment
- 7.2.2. Transportation
- 7.2.3. Consumer Electronics
- 7.2.4. Other Applications
- 7.1. Market Analysis, Insights and Forecast - by Component
- 8. Asia Pacific Semiconductor & Electronic Parts Manufacturing Industry Analysis, Insights and Forecast, 2019-2031
- 8.1. Market Analysis, Insights and Forecast - by Component
- 8.1.1. Equipment
- 8.1.1.1. Front-En
- 8.1.1.2. Back-End
- 8.1.2. Software
- 8.1.3. Services
- 8.1.3.1. Electronics Design and Engineering
- 8.1.3.2. Electronics Assembly
- 8.1.3.3. Electronics Manufacturing
- 8.1.3.4. Other Service Types
- 8.1.1. Equipment
- 8.2. Market Analysis, Insights and Forecast - by Application
- 8.2.1. Communications and Network Equipment
- 8.2.2. Transportation
- 8.2.3. Consumer Electronics
- 8.2.4. Other Applications
- 8.1. Market Analysis, Insights and Forecast - by Component
- 9. Rest of the World Semiconductor & Electronic Parts Manufacturing Industry Analysis, Insights and Forecast, 2019-2031
- 9.1. Market Analysis, Insights and Forecast - by Component
- 9.1.1. Equipment
- 9.1.1.1. Front-En
- 9.1.1.2. Back-End
- 9.1.2. Software
- 9.1.3. Services
- 9.1.3.1. Electronics Design and Engineering
- 9.1.3.2. Electronics Assembly
- 9.1.3.3. Electronics Manufacturing
- 9.1.3.4. Other Service Types
- 9.1.1. Equipment
- 9.2. Market Analysis, Insights and Forecast - by Application
- 9.2.1. Communications and Network Equipment
- 9.2.2. Transportation
- 9.2.3. Consumer Electronics
- 9.2.4. Other Applications
- 9.1. Market Analysis, Insights and Forecast - by Component
- 10. North America Semiconductor & Electronic Parts Manufacturing Industry Analysis, Insights and Forecast, 2019-2031
- 10.1. Market Analysis, Insights and Forecast - By Country/Sub-region
- 10.1.1 United States
- 10.1.2 Canada
- 11. Europe Semiconductor & Electronic Parts Manufacturing Industry Analysis, Insights and Forecast, 2019-2031
- 11.1. Market Analysis, Insights and Forecast - By Country/Sub-region
- 11.1.1 United Kingdom
- 11.1.2 Italy
- 11.1.3 Germany
- 11.1.4 France
- 11.1.5 Rest of Europe
- 12. Asia Pacific Semiconductor & Electronic Parts Manufacturing Industry Analysis, Insights and Forecast, 2019-2031
- 12.1. Market Analysis, Insights and Forecast - By Country/Sub-region
- 12.1.1 China
- 12.1.2 Japan
- 12.1.3 South Korea
- 12.1.4 India
- 12.1.5 Rest of Asia Pacific
- 13. Rest of the World Semiconductor & Electronic Parts Manufacturing Industry Analysis, Insights and Forecast, 2019-2031
- 13.1. Market Analysis, Insights and Forecast - By Country/Sub-region
- 13.1.1.
- 14. Competitive Analysis
- 14.1. Global Market Share Analysis 2024
- 14.2. Company Profiles
- 14.2.1 Micron Technology Inc
- 14.2.1.1. Overview
- 14.2.1.2. Products
- 14.2.1.3. SWOT Analysis
- 14.2.1.4. Recent Developments
- 14.2.1.5. Financials (Based on Availability)
- 14.2.2 Sumitronics Corporation
- 14.2.2.1. Overview
- 14.2.2.2. Products
- 14.2.2.3. SWOT Analysis
- 14.2.2.4. Recent Developments
- 14.2.2.5. Financials (Based on Availability)
- 14.2.3 Texas Instruments Inc
- 14.2.3.1. Overview
- 14.2.3.2. Products
- 14.2.3.3. SWOT Analysis
- 14.2.3.4. Recent Developments
- 14.2.3.5. Financials (Based on Availability)
- 14.2.4 Jabil Inc
- 14.2.4.1. Overview
- 14.2.4.2. Products
- 14.2.4.3. SWOT Analysis
- 14.2.4.4. Recent Developments
- 14.2.4.5. Financials (Based on Availability)
- 14.2.5 Samsung Electronics Co Ltd
- 14.2.5.1. Overview
- 14.2.5.2. Products
- 14.2.5.3. SWOT Analysis
- 14.2.5.4. Recent Developments
- 14.2.5.5. Financials (Based on Availability)
- 14.2.6 Broadcom Inc
- 14.2.6.1. Overview
- 14.2.6.2. Products
- 14.2.6.3. SWOT Analysis
- 14.2.6.4. Recent Developments
- 14.2.6.5. Financials (Based on Availability)
- 14.2.7 Nortech Systems Incorporated*List Not Exhaustive
- 14.2.7.1. Overview
- 14.2.7.2. Products
- 14.2.7.3. SWOT Analysis
- 14.2.7.4. Recent Developments
- 14.2.7.5. Financials (Based on Availability)
- 14.2.8 SIIX Corporation
- 14.2.8.1. Overview
- 14.2.8.2. Products
- 14.2.8.3. SWOT Analysis
- 14.2.8.4. Recent Developments
- 14.2.8.5. Financials (Based on Availability)
- 14.2.9 SK Hynix Inc
- 14.2.9.1. Overview
- 14.2.9.2. Products
- 14.2.9.3. SWOT Analysis
- 14.2.9.4. Recent Developments
- 14.2.9.5. Financials (Based on Availability)
- 14.2.10 Qualcomm Technologies Inc
- 14.2.10.1. Overview
- 14.2.10.2. Products
- 14.2.10.3. SWOT Analysis
- 14.2.10.4. Recent Developments
- 14.2.10.5. Financials (Based on Availability)
- 14.2.11 Flex Ltd
- 14.2.11.1. Overview
- 14.2.11.2. Products
- 14.2.11.3. SWOT Analysis
- 14.2.11.4. Recent Developments
- 14.2.11.5. Financials (Based on Availability)
- 14.2.12 Taiwan Semiconductor Manufacturing Company Limited
- 14.2.12.1. Overview
- 14.2.12.2. Products
- 14.2.12.3. SWOT Analysis
- 14.2.12.4. Recent Developments
- 14.2.12.5. Financials (Based on Availability)
- 14.2.13 Intel Corporation
- 14.2.13.1. Overview
- 14.2.13.2. Products
- 14.2.13.3. SWOT Analysis
- 14.2.13.4. Recent Developments
- 14.2.13.5. Financials (Based on Availability)
- 14.2.1 Micron Technology Inc
List of Figures
- Figure 1: Global Semiconductor & Electronic Parts Manufacturing Industry Revenue Breakdown (Million, %) by Region 2024 & 2032
- Figure 2: North America Semiconductor & Electronic Parts Manufacturing Industry Revenue (Million), by Country 2024 & 2032
- Figure 3: North America Semiconductor & Electronic Parts Manufacturing Industry Revenue Share (%), by Country 2024 & 2032
- Figure 4: Europe Semiconductor & Electronic Parts Manufacturing Industry Revenue (Million), by Country 2024 & 2032
- Figure 5: Europe Semiconductor & Electronic Parts Manufacturing Industry Revenue Share (%), by Country 2024 & 2032
- Figure 6: Asia Pacific Semiconductor & Electronic Parts Manufacturing Industry Revenue (Million), by Country 2024 & 2032
- Figure 7: Asia Pacific Semiconductor & Electronic Parts Manufacturing Industry Revenue Share (%), by Country 2024 & 2032
- Figure 8: Rest of the World Semiconductor & Electronic Parts Manufacturing Industry Revenue (Million), by Country 2024 & 2032
- Figure 9: Rest of the World Semiconductor & Electronic Parts Manufacturing Industry Revenue Share (%), by Country 2024 & 2032
- Figure 10: North America Semiconductor & Electronic Parts Manufacturing Industry Revenue (Million), by Component 2024 & 2032
- Figure 11: North America Semiconductor & Electronic Parts Manufacturing Industry Revenue Share (%), by Component 2024 & 2032
- Figure 12: North America Semiconductor & Electronic Parts Manufacturing Industry Revenue (Million), by Application 2024 & 2032
- Figure 13: North America Semiconductor & Electronic Parts Manufacturing Industry Revenue Share (%), by Application 2024 & 2032
- Figure 14: North America Semiconductor & Electronic Parts Manufacturing Industry Revenue (Million), by Country 2024 & 2032
- Figure 15: North America Semiconductor & Electronic Parts Manufacturing Industry Revenue Share (%), by Country 2024 & 2032
- Figure 16: Europe Semiconductor & Electronic Parts Manufacturing Industry Revenue (Million), by Component 2024 & 2032
- Figure 17: Europe Semiconductor & Electronic Parts Manufacturing Industry Revenue Share (%), by Component 2024 & 2032
- Figure 18: Europe Semiconductor & Electronic Parts Manufacturing Industry Revenue (Million), by Application 2024 & 2032
- Figure 19: Europe Semiconductor & Electronic Parts Manufacturing Industry Revenue Share (%), by Application 2024 & 2032
- Figure 20: Europe Semiconductor & Electronic Parts Manufacturing Industry Revenue (Million), by Country 2024 & 2032
- Figure 21: Europe Semiconductor & Electronic Parts Manufacturing Industry Revenue Share (%), by Country 2024 & 2032
- Figure 22: Asia Pacific Semiconductor & Electronic Parts Manufacturing Industry Revenue (Million), by Component 2024 & 2032
- Figure 23: Asia Pacific Semiconductor & Electronic Parts Manufacturing Industry Revenue Share (%), by Component 2024 & 2032
- Figure 24: Asia Pacific Semiconductor & Electronic Parts Manufacturing Industry Revenue (Million), by Application 2024 & 2032
- Figure 25: Asia Pacific Semiconductor & Electronic Parts Manufacturing Industry Revenue Share (%), by Application 2024 & 2032
- Figure 26: Asia Pacific Semiconductor & Electronic Parts Manufacturing Industry Revenue (Million), by Country 2024 & 2032
- Figure 27: Asia Pacific Semiconductor & Electronic Parts Manufacturing Industry Revenue Share (%), by Country 2024 & 2032
- Figure 28: Rest of the World Semiconductor & Electronic Parts Manufacturing Industry Revenue (Million), by Component 2024 & 2032
- Figure 29: Rest of the World Semiconductor & Electronic Parts Manufacturing Industry Revenue Share (%), by Component 2024 & 2032
- Figure 30: Rest of the World Semiconductor & Electronic Parts Manufacturing Industry Revenue (Million), by Application 2024 & 2032
- Figure 31: Rest of the World Semiconductor & Electronic Parts Manufacturing Industry Revenue Share (%), by Application 2024 & 2032
- Figure 32: Rest of the World Semiconductor & Electronic Parts Manufacturing Industry Revenue (Million), by Country 2024 & 2032
- Figure 33: Rest of the World Semiconductor & Electronic Parts Manufacturing Industry Revenue Share (%), by Country 2024 & 2032
List of Tables
- Table 1: Global Semiconductor & Electronic Parts Manufacturing Industry Revenue Million Forecast, by Region 2019 & 2032
- Table 2: Global Semiconductor & Electronic Parts Manufacturing Industry Revenue Million Forecast, by Component 2019 & 2032
- Table 3: Global Semiconductor & Electronic Parts Manufacturing Industry Revenue Million Forecast, by Application 2019 & 2032
- Table 4: Global Semiconductor & Electronic Parts Manufacturing Industry Revenue Million Forecast, by Region 2019 & 2032
- Table 5: Global Semiconductor & Electronic Parts Manufacturing Industry Revenue Million Forecast, by Country 2019 & 2032
- Table 6: United States Semiconductor & Electronic Parts Manufacturing Industry Revenue (Million) Forecast, by Application 2019 & 2032
- Table 7: Canada Semiconductor & Electronic Parts Manufacturing Industry Revenue (Million) Forecast, by Application 2019 & 2032
- Table 8: Global Semiconductor & Electronic Parts Manufacturing Industry Revenue Million Forecast, by Country 2019 & 2032
- Table 9: United Kingdom Semiconductor & Electronic Parts Manufacturing Industry Revenue (Million) Forecast, by Application 2019 & 2032
- Table 10: Italy Semiconductor & Electronic Parts Manufacturing Industry Revenue (Million) Forecast, by Application 2019 & 2032
- Table 11: Germany Semiconductor & Electronic Parts Manufacturing Industry Revenue (Million) Forecast, by Application 2019 & 2032
- Table 12: France Semiconductor & Electronic Parts Manufacturing Industry Revenue (Million) Forecast, by Application 2019 & 2032
- Table 13: Rest of Europe Semiconductor & Electronic Parts Manufacturing Industry Revenue (Million) Forecast, by Application 2019 & 2032
- Table 14: Global Semiconductor & Electronic Parts Manufacturing Industry Revenue Million Forecast, by Country 2019 & 2032
- Table 15: China Semiconductor & Electronic Parts Manufacturing Industry Revenue (Million) Forecast, by Application 2019 & 2032
- Table 16: Japan Semiconductor & Electronic Parts Manufacturing Industry Revenue (Million) Forecast, by Application 2019 & 2032
- Table 17: South Korea Semiconductor & Electronic Parts Manufacturing Industry Revenue (Million) Forecast, by Application 2019 & 2032
- Table 18: India Semiconductor & Electronic Parts Manufacturing Industry Revenue (Million) Forecast, by Application 2019 & 2032
- Table 19: Rest of Asia Pacific Semiconductor & Electronic Parts Manufacturing Industry Revenue (Million) Forecast, by Application 2019 & 2032
- Table 20: Global Semiconductor & Electronic Parts Manufacturing Industry Revenue Million Forecast, by Country 2019 & 2032
- Table 21: Semiconductor & Electronic Parts Manufacturing Industry Revenue (Million) Forecast, by Application 2019 & 2032
- Table 22: Global Semiconductor & Electronic Parts Manufacturing Industry Revenue Million Forecast, by Component 2019 & 2032
- Table 23: Global Semiconductor & Electronic Parts Manufacturing Industry Revenue Million Forecast, by Application 2019 & 2032
- Table 24: Global Semiconductor & Electronic Parts Manufacturing Industry Revenue Million Forecast, by Country 2019 & 2032
- Table 25: United States Semiconductor & Electronic Parts Manufacturing Industry Revenue (Million) Forecast, by Application 2019 & 2032
- Table 26: Canada Semiconductor & Electronic Parts Manufacturing Industry Revenue (Million) Forecast, by Application 2019 & 2032
- Table 27: Global Semiconductor & Electronic Parts Manufacturing Industry Revenue Million Forecast, by Component 2019 & 2032
- Table 28: Global Semiconductor & Electronic Parts Manufacturing Industry Revenue Million Forecast, by Application 2019 & 2032
- Table 29: Global Semiconductor & Electronic Parts Manufacturing Industry Revenue Million Forecast, by Country 2019 & 2032
- Table 30: United Kingdom Semiconductor & Electronic Parts Manufacturing Industry Revenue (Million) Forecast, by Application 2019 & 2032
- Table 31: Italy Semiconductor & Electronic Parts Manufacturing Industry Revenue (Million) Forecast, by Application 2019 & 2032
- Table 32: Germany Semiconductor & Electronic Parts Manufacturing Industry Revenue (Million) Forecast, by Application 2019 & 2032
- Table 33: France Semiconductor & Electronic Parts Manufacturing Industry Revenue (Million) Forecast, by Application 2019 & 2032
- Table 34: Rest of Europe Semiconductor & Electronic Parts Manufacturing Industry Revenue (Million) Forecast, by Application 2019 & 2032
- Table 35: Global Semiconductor & Electronic Parts Manufacturing Industry Revenue Million Forecast, by Component 2019 & 2032
- Table 36: Global Semiconductor & Electronic Parts Manufacturing Industry Revenue Million Forecast, by Application 2019 & 2032
- Table 37: Global Semiconductor & Electronic Parts Manufacturing Industry Revenue Million Forecast, by Country 2019 & 2032
- Table 38: China Semiconductor & Electronic Parts Manufacturing Industry Revenue (Million) Forecast, by Application 2019 & 2032
- Table 39: Japan Semiconductor & Electronic Parts Manufacturing Industry Revenue (Million) Forecast, by Application 2019 & 2032
- Table 40: South Korea Semiconductor & Electronic Parts Manufacturing Industry Revenue (Million) Forecast, by Application 2019 & 2032
- Table 41: India Semiconductor & Electronic Parts Manufacturing Industry Revenue (Million) Forecast, by Application 2019 & 2032
- Table 42: Rest of Asia Pacific Semiconductor & Electronic Parts Manufacturing Industry Revenue (Million) Forecast, by Application 2019 & 2032
- Table 43: Global Semiconductor & Electronic Parts Manufacturing Industry Revenue Million Forecast, by Component 2019 & 2032
- Table 44: Global Semiconductor & Electronic Parts Manufacturing Industry Revenue Million Forecast, by Application 2019 & 2032
- Table 45: Global Semiconductor & Electronic Parts Manufacturing Industry Revenue Million Forecast, by Country 2019 & 2032
Frequently Asked Questions
1. What is the projected Compound Annual Growth Rate (CAGR) of the Semiconductor & Electronic Parts Manufacturing Industry?
The projected CAGR is approximately 7.10%.
2. Which companies are prominent players in the Semiconductor & Electronic Parts Manufacturing Industry?
Key companies in the market include Micron Technology Inc, Sumitronics Corporation, Texas Instruments Inc, Jabil Inc, Samsung Electronics Co Ltd, Broadcom Inc, Nortech Systems Incorporated*List Not Exhaustive, SIIX Corporation, SK Hynix Inc, Qualcomm Technologies Inc, Flex Ltd, Taiwan Semiconductor Manufacturing Company Limited, Intel Corporation.
3. What are the main segments of the Semiconductor & Electronic Parts Manufacturing Industry?
The market segments include Component, Application.
4. Can you provide details about the market size?
The market size is estimated to be USD XX Million as of 2022.
5. What are some drivers contributing to market growth?
Growing Miniaturization; Adoption of Emerging Technologies in IIoT. Blockchain. and Enhanced Communication.
6. What are the notable trends driving market growth?
Consumer Electronics to Hold a Significant Share.
7. Are there any restraints impacting market growth?
Increasing complexity due to miniaturization of components; Strict requirements to comply with legislations.
8. Can you provide examples of recent developments in the market?
June 2022 - Jabil Circuit, a technology company, headquartered in the United States, announced an investment of USD 400 million in Jalisco. This investment was made for the Guadalajara-based Design Center, which is among the most important design centers in Latin America. The investment is expected to help the company expand its regional presence.
9. What pricing options are available for accessing the report?
Pricing options include single-user, multi-user, and enterprise licenses priced at USD 4750, USD 5250, and USD 8750 respectively.
10. Is the market size provided in terms of value or volume?
The market size is provided in terms of value, measured in Million.
11. Are there any specific market keywords associated with the report?
Yes, the market keyword associated with the report is "Semiconductor & Electronic Parts Manufacturing Industry," which aids in identifying and referencing the specific market segment covered.
12. How do I determine which pricing option suits my needs best?
The pricing options vary based on user requirements and access needs. Individual users may opt for single-user licenses, while businesses requiring broader access may choose multi-user or enterprise licenses for cost-effective access to the report.
13. Are there any additional resources or data provided in the Semiconductor & Electronic Parts Manufacturing Industry report?
While the report offers comprehensive insights, it's advisable to review the specific contents or supplementary materials provided to ascertain if additional resources or data are available.
14. How can I stay updated on further developments or reports in the Semiconductor & Electronic Parts Manufacturing Industry?
To stay informed about further developments, trends, and reports in the Semiconductor & Electronic Parts Manufacturing Industry, consider subscribing to industry newsletters, following relevant companies and organizations, or regularly checking reputable industry news sources and publications.
Methodology
Step 1 - Identification of Relevant Samples Size from Population Database


Step 2 - Approaches for Defining Global Market Size (Value, Volume* & Price*)

Note*: In applicable scenarios
Step 3 - Data Sources
Primary Research
- Web Analytics
- Survey Reports
- Research Institute
- Latest Research Reports
- Opinion Leaders
Secondary Research
- Annual Reports
- White Paper
- Latest Press Release
- Industry Association
- Paid Database
- Investor Presentations

Step 4 - Data Triangulation
Involves using different sources of information in order to increase the validity of a study
These sources are likely to be stakeholders in a program - participants, other researchers, program staff, other community members, and so on.
Then we put all data in single framework & apply various statistical tools to find out the dynamic on the market.
During the analysis stage, feedback from the stakeholder groups would be compared to determine areas of agreement as well as areas of divergence


