
Key Insights
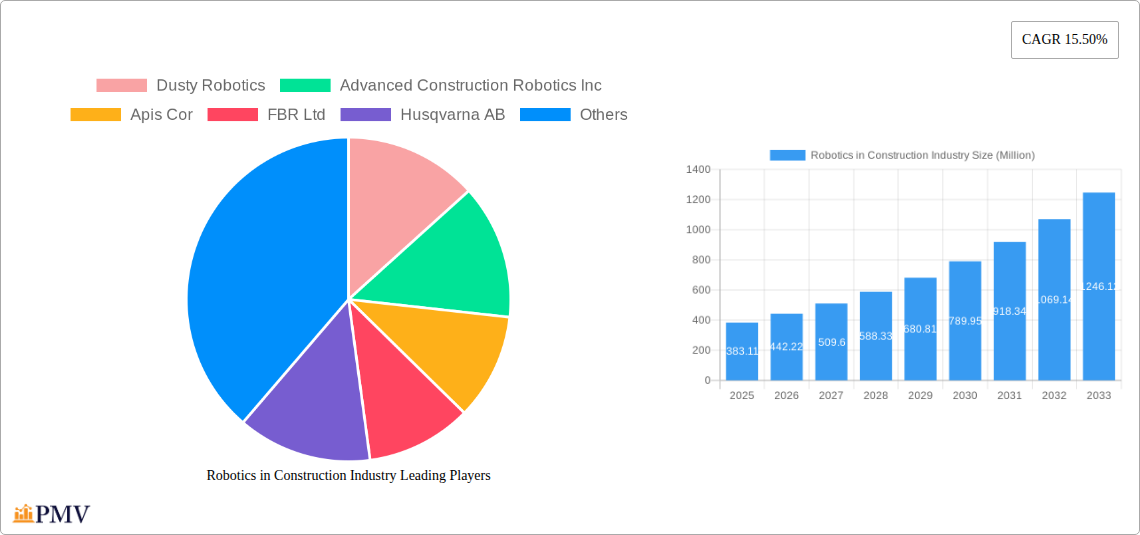
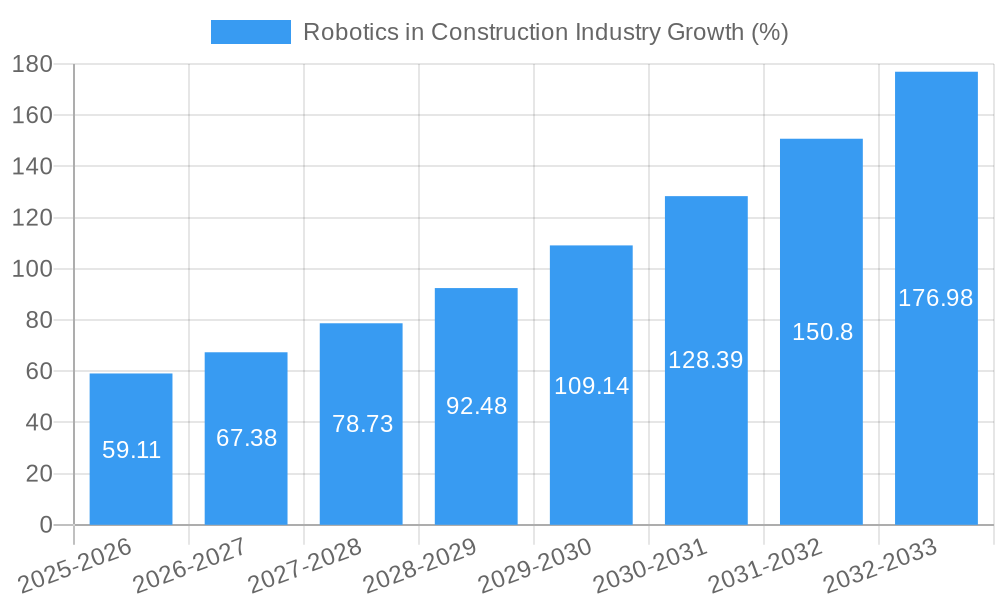
The global Robotics in Construction industry is experiencing robust growth, projected to reach a market size of $383.11 million in 2025, expanding at a Compound Annual Growth Rate (CAGR) of 15.50%. This surge is driven by several key factors. Firstly, the increasing demand for improved efficiency and productivity within the construction sector is fueling the adoption of robotic solutions. Automation through robotics addresses labor shortages, reduces human error, and accelerates project completion times, making it increasingly attractive to construction companies of all sizes. Secondly, advancements in robotics technology, particularly in areas like 3D printing, autonomous vehicles, and AI-powered construction management systems, are expanding the capabilities and applications of robotics within the industry. Finally, supportive government regulations and initiatives aimed at promoting technological advancements in construction are creating a favorable environment for market expansion. The market is segmented by type (Demolition, Bricklaying, 3D Printing, and Other) and application (Public Infrastructure, Commercial & Residential Buildings, and Other), with significant opportunities across all segments. The rapid expansion of smart cities and infrastructure projects, particularly in developing economies of Asia-Pacific and North America, is further boosting the demand for robotic solutions in the construction industry.
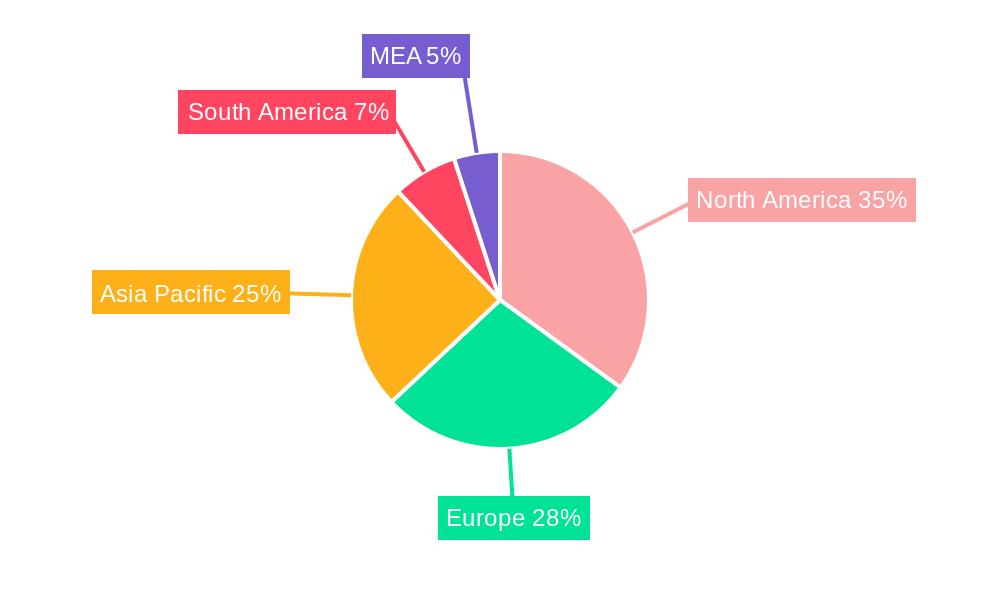
While the industry enjoys significant momentum, challenges remain. High initial investment costs associated with robotic systems and the need for skilled professionals to operate and maintain this technology can act as restraints. Furthermore, concerns regarding job displacement due to automation and the integration of robotic systems into existing workflows also require careful consideration. However, the long-term benefits of increased efficiency, safety, and reduced costs are expected to outweigh these challenges, leading to continued market expansion throughout the forecast period (2025-2033). Key players like Dusty Robotics, Advanced Construction Robotics Inc., and COBOD International AS are actively shaping the market landscape through innovation and strategic partnerships, further accelerating growth. The regional distribution of the market reflects global construction activity, with North America and Asia-Pacific anticipated to hold substantial market shares.
Robotics in Construction Industry: A Comprehensive Market Report (2019-2033)
This detailed report provides a comprehensive analysis of the Robotics in Construction Industry market, offering invaluable insights for investors, industry professionals, and strategic decision-makers. With a study period spanning 2019-2033, a base year of 2025, and a forecast period of 2025-2033, this report leverages rigorous data analysis to illuminate current market dynamics and project future growth trajectories. The market is valued at $XX Million in 2025 and is projected to reach $XX Million by 2033, exhibiting a CAGR of XX%.
Robotics in Construction Industry Market Structure & Competitive Dynamics
This section analyzes the competitive landscape of the Robotics in Construction Industry, exploring market concentration, innovation ecosystems, regulatory frameworks, and key industry trends. The market is characterized by a mix of established players and emerging startups, leading to a dynamic competitive environment. Market share is currently fragmented, with the top five companies holding an estimated XX% collective market share in 2025. However, the industry is witnessing significant consolidation through mergers and acquisitions (M&A), with deal values exceeding $XX Million in recent years. This surge in M&A activity underscores the increasing strategic importance of robotics in construction.
- Market Concentration: Moderately fragmented, with ongoing consolidation.
- Innovation Ecosystems: Strong presence of startups and research institutions fostering innovation.
- Regulatory Frameworks: Varying regulations across geographies impacting adoption rates.
- Product Substitutes: Limited direct substitutes, but traditional methods remain competitive.
- End-User Trends: Growing demand for increased efficiency, safety, and reduced labor costs.
- M&A Activities: Significant increase in M&A activity, indicating industry consolidation and strategic investments. Examples include the recent strategic agreement between FBR Ltd. and M&G Investment Management.
Robotics in Construction Industry Industry Trends & Insights
The Robotics in Construction Industry is experiencing rapid growth, driven by several key factors. Technological advancements, such as improved sensor technology, AI-powered automation, and advancements in 3D printing, are significantly enhancing the capabilities and efficiency of construction robots. This is further fueled by increasing labor costs, a growing need to improve worker safety, and the demand for faster project completion times. Consumer preference for sustainable and high-quality construction is also bolstering adoption. The market is witnessing significant penetration of robotics in various construction applications, with a projected market penetration rate of XX% by 2033. The market’s CAGR is estimated to be XX% during the forecast period.
Dominant Markets & Segments in Robotics in Construction Industry
The North American region currently dominates the Robotics in Construction Industry, driven by factors such as substantial investments in infrastructure projects, favorable government policies promoting technological adoption, and a higher concentration of key players. However, the Asia-Pacific region is projected to experience the fastest growth rate over the forecast period.
By Type:
- Demolition: High demand due to the hazardous nature of demolition work and the need for increased efficiency.
- Bricklaying: Significant advancements in automated bricklaying systems are driving market growth.
- 3D Printing: Rapid growth anticipated due to the potential for faster construction and reduced material waste.
- Other Types: This segment includes welding, painting, and other automated tasks experiencing moderate growth.
By Application:
- Public Infrastructure: Government investments in infrastructure projects are a major driver.
- Commercial and Residential Buildings: Growing demand for efficient and cost-effective construction methods.
- Other Applications: This segment includes specialized applications like tunneling and mining, demonstrating steady growth.
Key Drivers:
- Strong government support for infrastructure development
- Rising labor costs and skilled labor shortages
- Demand for improved safety and efficiency
Robotics in Construction Industry Product Innovations
Recent innovations include the launch of IronBOT by Advanced Construction Robotics Inc., a rebar-handling robot, and the continued development of Hadrian X by FBR Ltd., showcasing advancements in bricklaying automation. These innovations offer significant advantages in terms of speed, precision, and safety, enhancing the overall efficiency and cost-effectiveness of construction projects. The focus is shifting towards integrated robotic systems capable of performing multiple tasks, creating synergistic efficiency gains.
Report Segmentation & Scope
This report segments the Robotics in Construction Industry market by type (Demolition, Bricklaying, 3D Printing, Other Types) and by application (Public Infrastructure, Commercial and Residential Buildings, Other Applications). Each segment is analyzed in detail, providing insights into market size, growth projections, and competitive dynamics. For example, the 3D printing segment is expected to experience significant growth due to its potential to revolutionize the construction process, while the demolition segment is driven by safety concerns and labor shortages.
Key Drivers of Robotics in Construction Industry Growth
Several factors are driving the growth of the Robotics in Construction Industry. Technological advancements are leading to more efficient and reliable robots. Economic factors, such as increasing labor costs and the need to reduce project timelines, are also fueling adoption. Furthermore, supportive government regulations and initiatives aimed at promoting technological innovation are contributing to market expansion.
Challenges in the Robotics in Construction Industry Sector
Despite the significant growth potential, the Robotics in Construction Industry faces several challenges. High initial investment costs, integration complexities with existing construction workflows, and concerns regarding job displacement are among the major obstacles. Furthermore, the lack of standardized safety regulations and the need for skilled labor to operate and maintain the robots pose significant hurdles.
Leading Players in the Robotics in Construction Industry Market
- Dusty Robotics
- Advanced Construction Robotics Inc
- Apis Cor
- FBR Ltd
- Husqvarna AB
- Construction Robotics LLC
- BROKK AB (Lifco publ AB)
- Ekso Bionics
- COBOD International AS
Key Developments in Robotics in Construction Industry Sector
- March 2023: FBR Ltd. announced a strategic agreement with M&G Investment Management to fund the production and deployment of three additional Hadrian X robots in the United States, expanding its "Wall as a Service" offering.
- March 2023: Advanced Construction Robotics Inc. launched IronBOT, a rebar-handling robot, enhancing rebar placement efficiency and worker safety.
Strategic Robotics in Construction Industry Market Outlook
The Robotics in Construction Industry presents significant growth opportunities. Continued technological advancements, coupled with increasing demand for efficient and safe construction practices, are poised to drive market expansion. Strategic partnerships, investments in research and development, and the development of integrated robotic systems will play crucial roles in shaping the future of this dynamic market. Focus on addressing challenges related to cost, integration, and workforce adaptation will unlock further growth potential.
Robotics in Construction Industry Segmentation
-
1. Type
- 1.1. Demolition
- 1.2. Bricklaying
- 1.3. 3D Printing
- 1.4. Other Types
-
2. Application
- 2.1. Public Infrastructure
- 2.2. Commercial and Residential Buildings
- 2.3. Other Applications
Robotics in Construction Industry Segmentation By Geography
- 1. North America
- 2. Europe
- 3. Asia Pacific
- 4. Rest of the World
Robotics in Construction Industry REPORT HIGHLIGHTS
| Aspects | Details |
|---|---|
| Study Period | 2019-2033 |
| Base Year | 2024 |
| Estimated Year | 2025 |
| Forecast Period | 2025-2033 |
| Historical Period | 2019-2024 |
| Growth Rate | CAGR of 15.50% from 2019-2033 |
| Segmentation |
|
Table of Contents
- 1. Introduction
- 1.1. Research Scope
- 1.2. Market Segmentation
- 1.3. Research Methodology
- 1.4. Definitions and Assumptions
- 2. Executive Summary
- 2.1. Introduction
- 3. Market Dynamics
- 3.1. Introduction
- 3.2. Market Drivers
- 3.2.1. Rapid Urbanization; Stringent Government Regulations for Worker's Safety
- 3.3. Market Restrains
- 3.3.1. High Equipment and Setup Costs
- 3.4. Market Trends
- 3.4.1. Commercial and Residential Buildings to be the Largest Application for Construction Robots
- 4. Market Factor Analysis
- 4.1. Porters Five Forces
- 4.2. Supply/Value Chain
- 4.3. PESTEL analysis
- 4.4. Market Entropy
- 4.5. Patent/Trademark Analysis
- 5. Global Robotics in Construction Industry Analysis, Insights and Forecast, 2019-2031
- 5.1. Market Analysis, Insights and Forecast - by Type
- 5.1.1. Demolition
- 5.1.2. Bricklaying
- 5.1.3. 3D Printing
- 5.1.4. Other Types
- 5.2. Market Analysis, Insights and Forecast - by Application
- 5.2.1. Public Infrastructure
- 5.2.2. Commercial and Residential Buildings
- 5.2.3. Other Applications
- 5.3. Market Analysis, Insights and Forecast - by Region
- 5.3.1. North America
- 5.3.2. Europe
- 5.3.3. Asia Pacific
- 5.3.4. Rest of the World
- 5.1. Market Analysis, Insights and Forecast - by Type
- 6. North America Robotics in Construction Industry Analysis, Insights and Forecast, 2019-2031
- 6.1. Market Analysis, Insights and Forecast - by Type
- 6.1.1. Demolition
- 6.1.2. Bricklaying
- 6.1.3. 3D Printing
- 6.1.4. Other Types
- 6.2. Market Analysis, Insights and Forecast - by Application
- 6.2.1. Public Infrastructure
- 6.2.2. Commercial and Residential Buildings
- 6.2.3. Other Applications
- 6.1. Market Analysis, Insights and Forecast - by Type
- 7. Europe Robotics in Construction Industry Analysis, Insights and Forecast, 2019-2031
- 7.1. Market Analysis, Insights and Forecast - by Type
- 7.1.1. Demolition
- 7.1.2. Bricklaying
- 7.1.3. 3D Printing
- 7.1.4. Other Types
- 7.2. Market Analysis, Insights and Forecast - by Application
- 7.2.1. Public Infrastructure
- 7.2.2. Commercial and Residential Buildings
- 7.2.3. Other Applications
- 7.1. Market Analysis, Insights and Forecast - by Type
- 8. Asia Pacific Robotics in Construction Industry Analysis, Insights and Forecast, 2019-2031
- 8.1. Market Analysis, Insights and Forecast - by Type
- 8.1.1. Demolition
- 8.1.2. Bricklaying
- 8.1.3. 3D Printing
- 8.1.4. Other Types
- 8.2. Market Analysis, Insights and Forecast - by Application
- 8.2.1. Public Infrastructure
- 8.2.2. Commercial and Residential Buildings
- 8.2.3. Other Applications
- 8.1. Market Analysis, Insights and Forecast - by Type
- 9. Rest of the World Robotics in Construction Industry Analysis, Insights and Forecast, 2019-2031
- 9.1. Market Analysis, Insights and Forecast - by Type
- 9.1.1. Demolition
- 9.1.2. Bricklaying
- 9.1.3. 3D Printing
- 9.1.4. Other Types
- 9.2. Market Analysis, Insights and Forecast - by Application
- 9.2.1. Public Infrastructure
- 9.2.2. Commercial and Residential Buildings
- 9.2.3. Other Applications
- 9.1. Market Analysis, Insights and Forecast - by Type
- 10. North America Robotics in Construction Industry Analysis, Insights and Forecast, 2019-2031
- 10.1. Market Analysis, Insights and Forecast - By Country/Sub-region
- 10.1.1 United States
- 10.1.2 Canada
- 10.1.3 Mexico
- 11. Europe Robotics in Construction Industry Analysis, Insights and Forecast, 2019-2031
- 11.1. Market Analysis, Insights and Forecast - By Country/Sub-region
- 11.1.1 Germany
- 11.1.2 United Kingdom
- 11.1.3 France
- 11.1.4 Spain
- 11.1.5 Italy
- 11.1.6 Spain
- 11.1.7 Belgium
- 11.1.8 Netherland
- 11.1.9 Nordics
- 11.1.10 Rest of Europe
- 12. Asia Pacific Robotics in Construction Industry Analysis, Insights and Forecast, 2019-2031
- 12.1. Market Analysis, Insights and Forecast - By Country/Sub-region
- 12.1.1 China
- 12.1.2 Japan
- 12.1.3 India
- 12.1.4 South Korea
- 12.1.5 Southeast Asia
- 12.1.6 Australia
- 12.1.7 Indonesia
- 12.1.8 Phillipes
- 12.1.9 Singapore
- 12.1.10 Thailandc
- 12.1.11 Rest of Asia Pacific
- 13. South America Robotics in Construction Industry Analysis, Insights and Forecast, 2019-2031
- 13.1. Market Analysis, Insights and Forecast - By Country/Sub-region
- 13.1.1 Brazil
- 13.1.2 Argentina
- 13.1.3 Peru
- 13.1.4 Chile
- 13.1.5 Colombia
- 13.1.6 Ecuador
- 13.1.7 Venezuela
- 13.1.8 Rest of South America
- 14. North America Robotics in Construction Industry Analysis, Insights and Forecast, 2019-2031
- 14.1. Market Analysis, Insights and Forecast - By Country/Sub-region
- 14.1.1 United States
- 14.1.2 Canada
- 14.1.3 Mexico
- 15. MEA Robotics in Construction Industry Analysis, Insights and Forecast, 2019-2031
- 15.1. Market Analysis, Insights and Forecast - By Country/Sub-region
- 15.1.1 United Arab Emirates
- 15.1.2 Saudi Arabia
- 15.1.3 South Africa
- 15.1.4 Rest of Middle East and Africa
- 16. Competitive Analysis
- 16.1. Global Market Share Analysis 2024
- 16.2. Company Profiles
- 16.2.1 Dusty Robotics
- 16.2.1.1. Overview
- 16.2.1.2. Products
- 16.2.1.3. SWOT Analysis
- 16.2.1.4. Recent Developments
- 16.2.1.5. Financials (Based on Availability)
- 16.2.2 Advanced Construction Robotics Inc
- 16.2.2.1. Overview
- 16.2.2.2. Products
- 16.2.2.3. SWOT Analysis
- 16.2.2.4. Recent Developments
- 16.2.2.5. Financials (Based on Availability)
- 16.2.3 Apis Cor
- 16.2.3.1. Overview
- 16.2.3.2. Products
- 16.2.3.3. SWOT Analysis
- 16.2.3.4. Recent Developments
- 16.2.3.5. Financials (Based on Availability)
- 16.2.4 FBR Ltd
- 16.2.4.1. Overview
- 16.2.4.2. Products
- 16.2.4.3. SWOT Analysis
- 16.2.4.4. Recent Developments
- 16.2.4.5. Financials (Based on Availability)
- 16.2.5 Husqvarna AB
- 16.2.5.1. Overview
- 16.2.5.2. Products
- 16.2.5.3. SWOT Analysis
- 16.2.5.4. Recent Developments
- 16.2.5.5. Financials (Based on Availability)
- 16.2.6 Construction Robotics LLC
- 16.2.6.1. Overview
- 16.2.6.2. Products
- 16.2.6.3. SWOT Analysis
- 16.2.6.4. Recent Developments
- 16.2.6.5. Financials (Based on Availability)
- 16.2.7 BROKK AB (Lifco publ AB)
- 16.2.7.1. Overview
- 16.2.7.2. Products
- 16.2.7.3. SWOT Analysis
- 16.2.7.4. Recent Developments
- 16.2.7.5. Financials (Based on Availability)
- 16.2.8 Ekso Bionics
- 16.2.8.1. Overview
- 16.2.8.2. Products
- 16.2.8.3. SWOT Analysis
- 16.2.8.4. Recent Developments
- 16.2.8.5. Financials (Based on Availability)
- 16.2.9 COBOD International AS
- 16.2.9.1. Overview
- 16.2.9.2. Products
- 16.2.9.3. SWOT Analysis
- 16.2.9.4. Recent Developments
- 16.2.9.5. Financials (Based on Availability)
- 16.2.1 Dusty Robotics
List of Figures
- Figure 1: Global Robotics in Construction Industry Revenue Breakdown (Million, %) by Region 2024 & 2032
- Figure 2: Global Robotics in Construction Industry Volume Breakdown (cubic meters, %) by Region 2024 & 2032
- Figure 3: North America Robotics in Construction Industry Revenue (Million), by Country 2024 & 2032
- Figure 4: North America Robotics in Construction Industry Volume (cubic meters), by Country 2024 & 2032
- Figure 5: North America Robotics in Construction Industry Revenue Share (%), by Country 2024 & 2032
- Figure 6: North America Robotics in Construction Industry Volume Share (%), by Country 2024 & 2032
- Figure 7: Europe Robotics in Construction Industry Revenue (Million), by Country 2024 & 2032
- Figure 8: Europe Robotics in Construction Industry Volume (cubic meters), by Country 2024 & 2032
- Figure 9: Europe Robotics in Construction Industry Revenue Share (%), by Country 2024 & 2032
- Figure 10: Europe Robotics in Construction Industry Volume Share (%), by Country 2024 & 2032
- Figure 11: Asia Pacific Robotics in Construction Industry Revenue (Million), by Country 2024 & 2032
- Figure 12: Asia Pacific Robotics in Construction Industry Volume (cubic meters), by Country 2024 & 2032
- Figure 13: Asia Pacific Robotics in Construction Industry Revenue Share (%), by Country 2024 & 2032
- Figure 14: Asia Pacific Robotics in Construction Industry Volume Share (%), by Country 2024 & 2032
- Figure 15: South America Robotics in Construction Industry Revenue (Million), by Country 2024 & 2032
- Figure 16: South America Robotics in Construction Industry Volume (cubic meters), by Country 2024 & 2032
- Figure 17: South America Robotics in Construction Industry Revenue Share (%), by Country 2024 & 2032
- Figure 18: South America Robotics in Construction Industry Volume Share (%), by Country 2024 & 2032
- Figure 19: North America Robotics in Construction Industry Revenue (Million), by Country 2024 & 2032
- Figure 20: North America Robotics in Construction Industry Volume (cubic meters), by Country 2024 & 2032
- Figure 21: North America Robotics in Construction Industry Revenue Share (%), by Country 2024 & 2032
- Figure 22: North America Robotics in Construction Industry Volume Share (%), by Country 2024 & 2032
- Figure 23: MEA Robotics in Construction Industry Revenue (Million), by Country 2024 & 2032
- Figure 24: MEA Robotics in Construction Industry Volume (cubic meters), by Country 2024 & 2032
- Figure 25: MEA Robotics in Construction Industry Revenue Share (%), by Country 2024 & 2032
- Figure 26: MEA Robotics in Construction Industry Volume Share (%), by Country 2024 & 2032
- Figure 27: North America Robotics in Construction Industry Revenue (Million), by Type 2024 & 2032
- Figure 28: North America Robotics in Construction Industry Volume (cubic meters), by Type 2024 & 2032
- Figure 29: North America Robotics in Construction Industry Revenue Share (%), by Type 2024 & 2032
- Figure 30: North America Robotics in Construction Industry Volume Share (%), by Type 2024 & 2032
- Figure 31: North America Robotics in Construction Industry Revenue (Million), by Application 2024 & 2032
- Figure 32: North America Robotics in Construction Industry Volume (cubic meters), by Application 2024 & 2032
- Figure 33: North America Robotics in Construction Industry Revenue Share (%), by Application 2024 & 2032
- Figure 34: North America Robotics in Construction Industry Volume Share (%), by Application 2024 & 2032
- Figure 35: North America Robotics in Construction Industry Revenue (Million), by Country 2024 & 2032
- Figure 36: North America Robotics in Construction Industry Volume (cubic meters), by Country 2024 & 2032
- Figure 37: North America Robotics in Construction Industry Revenue Share (%), by Country 2024 & 2032
- Figure 38: North America Robotics in Construction Industry Volume Share (%), by Country 2024 & 2032
- Figure 39: Europe Robotics in Construction Industry Revenue (Million), by Type 2024 & 2032
- Figure 40: Europe Robotics in Construction Industry Volume (cubic meters), by Type 2024 & 2032
- Figure 41: Europe Robotics in Construction Industry Revenue Share (%), by Type 2024 & 2032
- Figure 42: Europe Robotics in Construction Industry Volume Share (%), by Type 2024 & 2032
- Figure 43: Europe Robotics in Construction Industry Revenue (Million), by Application 2024 & 2032
- Figure 44: Europe Robotics in Construction Industry Volume (cubic meters), by Application 2024 & 2032
- Figure 45: Europe Robotics in Construction Industry Revenue Share (%), by Application 2024 & 2032
- Figure 46: Europe Robotics in Construction Industry Volume Share (%), by Application 2024 & 2032
- Figure 47: Europe Robotics in Construction Industry Revenue (Million), by Country 2024 & 2032
- Figure 48: Europe Robotics in Construction Industry Volume (cubic meters), by Country 2024 & 2032
- Figure 49: Europe Robotics in Construction Industry Revenue Share (%), by Country 2024 & 2032
- Figure 50: Europe Robotics in Construction Industry Volume Share (%), by Country 2024 & 2032
- Figure 51: Asia Pacific Robotics in Construction Industry Revenue (Million), by Type 2024 & 2032
- Figure 52: Asia Pacific Robotics in Construction Industry Volume (cubic meters), by Type 2024 & 2032
- Figure 53: Asia Pacific Robotics in Construction Industry Revenue Share (%), by Type 2024 & 2032
- Figure 54: Asia Pacific Robotics in Construction Industry Volume Share (%), by Type 2024 & 2032
- Figure 55: Asia Pacific Robotics in Construction Industry Revenue (Million), by Application 2024 & 2032
- Figure 56: Asia Pacific Robotics in Construction Industry Volume (cubic meters), by Application 2024 & 2032
- Figure 57: Asia Pacific Robotics in Construction Industry Revenue Share (%), by Application 2024 & 2032
- Figure 58: Asia Pacific Robotics in Construction Industry Volume Share (%), by Application 2024 & 2032
- Figure 59: Asia Pacific Robotics in Construction Industry Revenue (Million), by Country 2024 & 2032
- Figure 60: Asia Pacific Robotics in Construction Industry Volume (cubic meters), by Country 2024 & 2032
- Figure 61: Asia Pacific Robotics in Construction Industry Revenue Share (%), by Country 2024 & 2032
- Figure 62: Asia Pacific Robotics in Construction Industry Volume Share (%), by Country 2024 & 2032
- Figure 63: Rest of the World Robotics in Construction Industry Revenue (Million), by Type 2024 & 2032
- Figure 64: Rest of the World Robotics in Construction Industry Volume (cubic meters), by Type 2024 & 2032
- Figure 65: Rest of the World Robotics in Construction Industry Revenue Share (%), by Type 2024 & 2032
- Figure 66: Rest of the World Robotics in Construction Industry Volume Share (%), by Type 2024 & 2032
- Figure 67: Rest of the World Robotics in Construction Industry Revenue (Million), by Application 2024 & 2032
- Figure 68: Rest of the World Robotics in Construction Industry Volume (cubic meters), by Application 2024 & 2032
- Figure 69: Rest of the World Robotics in Construction Industry Revenue Share (%), by Application 2024 & 2032
- Figure 70: Rest of the World Robotics in Construction Industry Volume Share (%), by Application 2024 & 2032
- Figure 71: Rest of the World Robotics in Construction Industry Revenue (Million), by Country 2024 & 2032
- Figure 72: Rest of the World Robotics in Construction Industry Volume (cubic meters), by Country 2024 & 2032
- Figure 73: Rest of the World Robotics in Construction Industry Revenue Share (%), by Country 2024 & 2032
- Figure 74: Rest of the World Robotics in Construction Industry Volume Share (%), by Country 2024 & 2032
List of Tables
- Table 1: Global Robotics in Construction Industry Revenue Million Forecast, by Region 2019 & 2032
- Table 2: Global Robotics in Construction Industry Volume cubic meters Forecast, by Region 2019 & 2032
- Table 3: Global Robotics in Construction Industry Revenue Million Forecast, by Type 2019 & 2032
- Table 4: Global Robotics in Construction Industry Volume cubic meters Forecast, by Type 2019 & 2032
- Table 5: Global Robotics in Construction Industry Revenue Million Forecast, by Application 2019 & 2032
- Table 6: Global Robotics in Construction Industry Volume cubic meters Forecast, by Application 2019 & 2032
- Table 7: Global Robotics in Construction Industry Revenue Million Forecast, by Region 2019 & 2032
- Table 8: Global Robotics in Construction Industry Volume cubic meters Forecast, by Region 2019 & 2032
- Table 9: Global Robotics in Construction Industry Revenue Million Forecast, by Country 2019 & 2032
- Table 10: Global Robotics in Construction Industry Volume cubic meters Forecast, by Country 2019 & 2032
- Table 11: United States Robotics in Construction Industry Revenue (Million) Forecast, by Application 2019 & 2032
- Table 12: United States Robotics in Construction Industry Volume (cubic meters) Forecast, by Application 2019 & 2032
- Table 13: Canada Robotics in Construction Industry Revenue (Million) Forecast, by Application 2019 & 2032
- Table 14: Canada Robotics in Construction Industry Volume (cubic meters) Forecast, by Application 2019 & 2032
- Table 15: Mexico Robotics in Construction Industry Revenue (Million) Forecast, by Application 2019 & 2032
- Table 16: Mexico Robotics in Construction Industry Volume (cubic meters) Forecast, by Application 2019 & 2032
- Table 17: Global Robotics in Construction Industry Revenue Million Forecast, by Country 2019 & 2032
- Table 18: Global Robotics in Construction Industry Volume cubic meters Forecast, by Country 2019 & 2032
- Table 19: Germany Robotics in Construction Industry Revenue (Million) Forecast, by Application 2019 & 2032
- Table 20: Germany Robotics in Construction Industry Volume (cubic meters) Forecast, by Application 2019 & 2032
- Table 21: United Kingdom Robotics in Construction Industry Revenue (Million) Forecast, by Application 2019 & 2032
- Table 22: United Kingdom Robotics in Construction Industry Volume (cubic meters) Forecast, by Application 2019 & 2032
- Table 23: France Robotics in Construction Industry Revenue (Million) Forecast, by Application 2019 & 2032
- Table 24: France Robotics in Construction Industry Volume (cubic meters) Forecast, by Application 2019 & 2032
- Table 25: Spain Robotics in Construction Industry Revenue (Million) Forecast, by Application 2019 & 2032
- Table 26: Spain Robotics in Construction Industry Volume (cubic meters) Forecast, by Application 2019 & 2032
- Table 27: Italy Robotics in Construction Industry Revenue (Million) Forecast, by Application 2019 & 2032
- Table 28: Italy Robotics in Construction Industry Volume (cubic meters) Forecast, by Application 2019 & 2032
- Table 29: Spain Robotics in Construction Industry Revenue (Million) Forecast, by Application 2019 & 2032
- Table 30: Spain Robotics in Construction Industry Volume (cubic meters) Forecast, by Application 2019 & 2032
- Table 31: Belgium Robotics in Construction Industry Revenue (Million) Forecast, by Application 2019 & 2032
- Table 32: Belgium Robotics in Construction Industry Volume (cubic meters) Forecast, by Application 2019 & 2032
- Table 33: Netherland Robotics in Construction Industry Revenue (Million) Forecast, by Application 2019 & 2032
- Table 34: Netherland Robotics in Construction Industry Volume (cubic meters) Forecast, by Application 2019 & 2032
- Table 35: Nordics Robotics in Construction Industry Revenue (Million) Forecast, by Application 2019 & 2032
- Table 36: Nordics Robotics in Construction Industry Volume (cubic meters) Forecast, by Application 2019 & 2032
- Table 37: Rest of Europe Robotics in Construction Industry Revenue (Million) Forecast, by Application 2019 & 2032
- Table 38: Rest of Europe Robotics in Construction Industry Volume (cubic meters) Forecast, by Application 2019 & 2032
- Table 39: Global Robotics in Construction Industry Revenue Million Forecast, by Country 2019 & 2032
- Table 40: Global Robotics in Construction Industry Volume cubic meters Forecast, by Country 2019 & 2032
- Table 41: China Robotics in Construction Industry Revenue (Million) Forecast, by Application 2019 & 2032
- Table 42: China Robotics in Construction Industry Volume (cubic meters) Forecast, by Application 2019 & 2032
- Table 43: Japan Robotics in Construction Industry Revenue (Million) Forecast, by Application 2019 & 2032
- Table 44: Japan Robotics in Construction Industry Volume (cubic meters) Forecast, by Application 2019 & 2032
- Table 45: India Robotics in Construction Industry Revenue (Million) Forecast, by Application 2019 & 2032
- Table 46: India Robotics in Construction Industry Volume (cubic meters) Forecast, by Application 2019 & 2032
- Table 47: South Korea Robotics in Construction Industry Revenue (Million) Forecast, by Application 2019 & 2032
- Table 48: South Korea Robotics in Construction Industry Volume (cubic meters) Forecast, by Application 2019 & 2032
- Table 49: Southeast Asia Robotics in Construction Industry Revenue (Million) Forecast, by Application 2019 & 2032
- Table 50: Southeast Asia Robotics in Construction Industry Volume (cubic meters) Forecast, by Application 2019 & 2032
- Table 51: Australia Robotics in Construction Industry Revenue (Million) Forecast, by Application 2019 & 2032
- Table 52: Australia Robotics in Construction Industry Volume (cubic meters) Forecast, by Application 2019 & 2032
- Table 53: Indonesia Robotics in Construction Industry Revenue (Million) Forecast, by Application 2019 & 2032
- Table 54: Indonesia Robotics in Construction Industry Volume (cubic meters) Forecast, by Application 2019 & 2032
- Table 55: Phillipes Robotics in Construction Industry Revenue (Million) Forecast, by Application 2019 & 2032
- Table 56: Phillipes Robotics in Construction Industry Volume (cubic meters) Forecast, by Application 2019 & 2032
- Table 57: Singapore Robotics in Construction Industry Revenue (Million) Forecast, by Application 2019 & 2032
- Table 58: Singapore Robotics in Construction Industry Volume (cubic meters) Forecast, by Application 2019 & 2032
- Table 59: Thailandc Robotics in Construction Industry Revenue (Million) Forecast, by Application 2019 & 2032
- Table 60: Thailandc Robotics in Construction Industry Volume (cubic meters) Forecast, by Application 2019 & 2032
- Table 61: Rest of Asia Pacific Robotics in Construction Industry Revenue (Million) Forecast, by Application 2019 & 2032
- Table 62: Rest of Asia Pacific Robotics in Construction Industry Volume (cubic meters) Forecast, by Application 2019 & 2032
- Table 63: Global Robotics in Construction Industry Revenue Million Forecast, by Country 2019 & 2032
- Table 64: Global Robotics in Construction Industry Volume cubic meters Forecast, by Country 2019 & 2032
- Table 65: Brazil Robotics in Construction Industry Revenue (Million) Forecast, by Application 2019 & 2032
- Table 66: Brazil Robotics in Construction Industry Volume (cubic meters) Forecast, by Application 2019 & 2032
- Table 67: Argentina Robotics in Construction Industry Revenue (Million) Forecast, by Application 2019 & 2032
- Table 68: Argentina Robotics in Construction Industry Volume (cubic meters) Forecast, by Application 2019 & 2032
- Table 69: Peru Robotics in Construction Industry Revenue (Million) Forecast, by Application 2019 & 2032
- Table 70: Peru Robotics in Construction Industry Volume (cubic meters) Forecast, by Application 2019 & 2032
- Table 71: Chile Robotics in Construction Industry Revenue (Million) Forecast, by Application 2019 & 2032
- Table 72: Chile Robotics in Construction Industry Volume (cubic meters) Forecast, by Application 2019 & 2032
- Table 73: Colombia Robotics in Construction Industry Revenue (Million) Forecast, by Application 2019 & 2032
- Table 74: Colombia Robotics in Construction Industry Volume (cubic meters) Forecast, by Application 2019 & 2032
- Table 75: Ecuador Robotics in Construction Industry Revenue (Million) Forecast, by Application 2019 & 2032
- Table 76: Ecuador Robotics in Construction Industry Volume (cubic meters) Forecast, by Application 2019 & 2032
- Table 77: Venezuela Robotics in Construction Industry Revenue (Million) Forecast, by Application 2019 & 2032
- Table 78: Venezuela Robotics in Construction Industry Volume (cubic meters) Forecast, by Application 2019 & 2032
- Table 79: Rest of South America Robotics in Construction Industry Revenue (Million) Forecast, by Application 2019 & 2032
- Table 80: Rest of South America Robotics in Construction Industry Volume (cubic meters) Forecast, by Application 2019 & 2032
- Table 81: Global Robotics in Construction Industry Revenue Million Forecast, by Country 2019 & 2032
- Table 82: Global Robotics in Construction Industry Volume cubic meters Forecast, by Country 2019 & 2032
- Table 83: United States Robotics in Construction Industry Revenue (Million) Forecast, by Application 2019 & 2032
- Table 84: United States Robotics in Construction Industry Volume (cubic meters) Forecast, by Application 2019 & 2032
- Table 85: Canada Robotics in Construction Industry Revenue (Million) Forecast, by Application 2019 & 2032
- Table 86: Canada Robotics in Construction Industry Volume (cubic meters) Forecast, by Application 2019 & 2032
- Table 87: Mexico Robotics in Construction Industry Revenue (Million) Forecast, by Application 2019 & 2032
- Table 88: Mexico Robotics in Construction Industry Volume (cubic meters) Forecast, by Application 2019 & 2032
- Table 89: Global Robotics in Construction Industry Revenue Million Forecast, by Country 2019 & 2032
- Table 90: Global Robotics in Construction Industry Volume cubic meters Forecast, by Country 2019 & 2032
- Table 91: United Arab Emirates Robotics in Construction Industry Revenue (Million) Forecast, by Application 2019 & 2032
- Table 92: United Arab Emirates Robotics in Construction Industry Volume (cubic meters) Forecast, by Application 2019 & 2032
- Table 93: Saudi Arabia Robotics in Construction Industry Revenue (Million) Forecast, by Application 2019 & 2032
- Table 94: Saudi Arabia Robotics in Construction Industry Volume (cubic meters) Forecast, by Application 2019 & 2032
- Table 95: South Africa Robotics in Construction Industry Revenue (Million) Forecast, by Application 2019 & 2032
- Table 96: South Africa Robotics in Construction Industry Volume (cubic meters) Forecast, by Application 2019 & 2032
- Table 97: Rest of Middle East and Africa Robotics in Construction Industry Revenue (Million) Forecast, by Application 2019 & 2032
- Table 98: Rest of Middle East and Africa Robotics in Construction Industry Volume (cubic meters) Forecast, by Application 2019 & 2032
- Table 99: Global Robotics in Construction Industry Revenue Million Forecast, by Type 2019 & 2032
- Table 100: Global Robotics in Construction Industry Volume cubic meters Forecast, by Type 2019 & 2032
- Table 101: Global Robotics in Construction Industry Revenue Million Forecast, by Application 2019 & 2032
- Table 102: Global Robotics in Construction Industry Volume cubic meters Forecast, by Application 2019 & 2032
- Table 103: Global Robotics in Construction Industry Revenue Million Forecast, by Country 2019 & 2032
- Table 104: Global Robotics in Construction Industry Volume cubic meters Forecast, by Country 2019 & 2032
- Table 105: Global Robotics in Construction Industry Revenue Million Forecast, by Type 2019 & 2032
- Table 106: Global Robotics in Construction Industry Volume cubic meters Forecast, by Type 2019 & 2032
- Table 107: Global Robotics in Construction Industry Revenue Million Forecast, by Application 2019 & 2032
- Table 108: Global Robotics in Construction Industry Volume cubic meters Forecast, by Application 2019 & 2032
- Table 109: Global Robotics in Construction Industry Revenue Million Forecast, by Country 2019 & 2032
- Table 110: Global Robotics in Construction Industry Volume cubic meters Forecast, by Country 2019 & 2032
- Table 111: Global Robotics in Construction Industry Revenue Million Forecast, by Type 2019 & 2032
- Table 112: Global Robotics in Construction Industry Volume cubic meters Forecast, by Type 2019 & 2032
- Table 113: Global Robotics in Construction Industry Revenue Million Forecast, by Application 2019 & 2032
- Table 114: Global Robotics in Construction Industry Volume cubic meters Forecast, by Application 2019 & 2032
- Table 115: Global Robotics in Construction Industry Revenue Million Forecast, by Country 2019 & 2032
- Table 116: Global Robotics in Construction Industry Volume cubic meters Forecast, by Country 2019 & 2032
- Table 117: Global Robotics in Construction Industry Revenue Million Forecast, by Type 2019 & 2032
- Table 118: Global Robotics in Construction Industry Volume cubic meters Forecast, by Type 2019 & 2032
- Table 119: Global Robotics in Construction Industry Revenue Million Forecast, by Application 2019 & 2032
- Table 120: Global Robotics in Construction Industry Volume cubic meters Forecast, by Application 2019 & 2032
- Table 121: Global Robotics in Construction Industry Revenue Million Forecast, by Country 2019 & 2032
- Table 122: Global Robotics in Construction Industry Volume cubic meters Forecast, by Country 2019 & 2032
Frequently Asked Questions
1. What is the projected Compound Annual Growth Rate (CAGR) of the Robotics in Construction Industry?
The projected CAGR is approximately 15.50%.
2. Which companies are prominent players in the Robotics in Construction Industry?
Key companies in the market include Dusty Robotics, Advanced Construction Robotics Inc, Apis Cor, FBR Ltd, Husqvarna AB, Construction Robotics LLC, BROKK AB (Lifco publ AB), Ekso Bionics, COBOD International AS.
3. What are the main segments of the Robotics in Construction Industry?
The market segments include Type, Application.
4. Can you provide details about the market size?
The market size is estimated to be USD 383.11 Million as of 2022.
5. What are some drivers contributing to market growth?
Rapid Urbanization; Stringent Government Regulations for Worker's Safety.
6. What are the notable trends driving market growth?
Commercial and Residential Buildings to be the Largest Application for Construction Robots.
7. Are there any restraints impacting market growth?
High Equipment and Setup Costs.
8. Can you provide examples of recent developments in the market?
March 2023: FBR Ltd. announced a strategic agreement with M&G Investment Management, a UK-based shareholder, to fund the production and deployment of three additional next-generation Hadrian X robots for use in the United States. The three new Hadrian X robots are expected to be built on truck bases in the United States before deployment to provide 'Wall as a Service' bricklaying services through the Perth firm's FastbrickAmericas joint venture.
9. What pricing options are available for accessing the report?
Pricing options include single-user, multi-user, and enterprise licenses priced at USD 4750, USD 5250, and USD 8750 respectively.
10. Is the market size provided in terms of value or volume?
The market size is provided in terms of value, measured in Million and volume, measured in cubic meters.
11. Are there any specific market keywords associated with the report?
Yes, the market keyword associated with the report is "Robotics in Construction Industry," which aids in identifying and referencing the specific market segment covered.
12. How do I determine which pricing option suits my needs best?
The pricing options vary based on user requirements and access needs. Individual users may opt for single-user licenses, while businesses requiring broader access may choose multi-user or enterprise licenses for cost-effective access to the report.
13. Are there any additional resources or data provided in the Robotics in Construction Industry report?
While the report offers comprehensive insights, it's advisable to review the specific contents or supplementary materials provided to ascertain if additional resources or data are available.
14. How can I stay updated on further developments or reports in the Robotics in Construction Industry?
To stay informed about further developments, trends, and reports in the Robotics in Construction Industry, consider subscribing to industry newsletters, following relevant companies and organizations, or regularly checking reputable industry news sources and publications.
Methodology
Step 1 - Identification of Relevant Samples Size from Population Database


Step 2 - Approaches for Defining Global Market Size (Value, Volume* & Price*)

Note*: In applicable scenarios
Step 3 - Data Sources
Primary Research
- Web Analytics
- Survey Reports
- Research Institute
- Latest Research Reports
- Opinion Leaders
Secondary Research
- Annual Reports
- White Paper
- Latest Press Release
- Industry Association
- Paid Database
- Investor Presentations

Step 4 - Data Triangulation
Involves using different sources of information in order to increase the validity of a study
These sources are likely to be stakeholders in a program - participants, other researchers, program staff, other community members, and so on.
Then we put all data in single framework & apply various statistical tools to find out the dynamic on the market.
During the analysis stage, feedback from the stakeholder groups would be compared to determine areas of agreement as well as areas of divergence


