
Key Insights
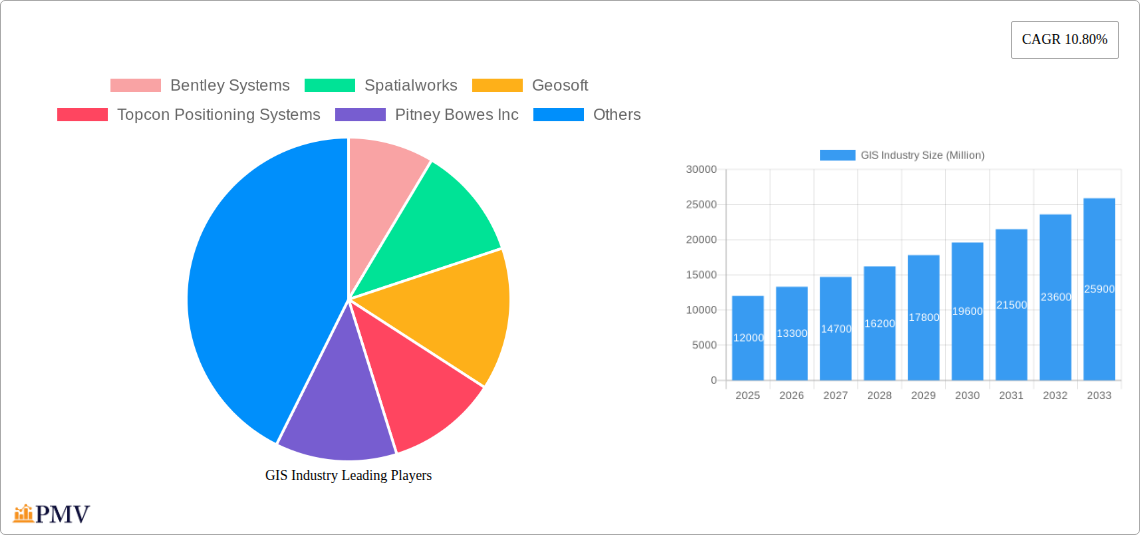
The Geographic Information System (GIS) market is experiencing robust growth, driven by increasing adoption across diverse sectors like agriculture, utilities, and transportation. The market's compound annual growth rate (CAGR) of 10.80% from 2019 to 2024 suggests a significant expansion, projected to continue through 2033. Key drivers include the rising need for precise location intelligence, enhanced data visualization capabilities, and the growing integration of GIS with other technologies like IoT and AI for applications such as precision farming, smart city development, and improved infrastructure management. The market is segmented by components (hardware and software), function (mapping, surveying, telematics and navigation, location-based services), and end-user industry. While hardware remains a significant segment, the software component, especially cloud-based GIS solutions, is experiencing faster growth due to its scalability and accessibility. The increasing availability of high-resolution satellite imagery and drone technology further fuels market expansion. Leading players like Esri, Trimble, and Hexagon AB are investing heavily in R&D and strategic acquisitions to strengthen their market positions and offer innovative solutions. However, high implementation costs and the need for skilled professionals can act as restraints, especially for smaller organizations in developing regions. The Asia-Pacific region is anticipated to show strong growth due to rapid urbanization and infrastructure development.
The competitive landscape is characterized by both established players and emerging technology providers. Established vendors focus on expanding their product portfolios and strengthening their customer base through strategic partnerships. Emerging players leverage innovative technologies and focus on niche markets to gain traction. The forecast period (2025-2033) will likely see continued market consolidation as larger companies acquire smaller, specialized GIS firms. Future growth will depend on advancements in data analytics, artificial intelligence integration within GIS platforms, and the development of user-friendly, accessible solutions catering to a wider range of users and applications beyond traditional surveying and mapping. The market is expected to reach significant scale by 2033, surpassing current estimates considerably given the persistent growth drivers. Continued technological advancements and expanding application areas will ensure sustained growth and adoption of GIS technology in the coming years.
This comprehensive report provides an in-depth analysis of the global Geographic Information System (GIS) industry, covering the period 2019-2033. With a focus on market structure, competitive dynamics, technological advancements, and key growth drivers, this report offers actionable insights for businesses, investors, and policymakers operating within this dynamic sector. The report values are in Millions (USD) unless otherwise specified.
GIS Industry Market Structure & Competitive Dynamics
The GIS industry exhibits a moderately concentrated market structure, with a few major players holding significant market share. Key competitors include Bentley Systems, Spatialworks, Geosoft, Topcon Positioning Systems, Pitney Bowes Inc, Hexagon AB, ESRI Inc, Trimble Inc, Autodesk Inc, and Caliper Corporation. These companies compete based on factors such as technological innovation, software capabilities, customer support, and pricing. The industry witnesses significant M&A activity, with deal values exceeding $xx Million annually in recent years (2019-2024).
- Market Concentration: The top 5 players account for approximately xx% of the global market share in 2025.
- Innovation Ecosystems: Collaboration between established players and start-ups fosters innovation in areas like AI-powered analytics and cloud-based GIS platforms.
- Regulatory Frameworks: Government regulations regarding data privacy and geospatial data accessibility influence market dynamics.
- Product Substitutes: Open-source GIS software and alternative mapping tools exert competitive pressure.
- End-User Trends: Increasing adoption of GIS across diverse sectors (Agriculture, Utilities, Mining, Construction, Transportation, Oil & Gas) drives market growth.
- M&A Activities: Consolidation is a key trend, with larger companies acquiring smaller firms to enhance their product portfolios and market reach. The average M&A deal value in 2024 was estimated at $xx Million.
GIS Industry Industry Trends & Insights
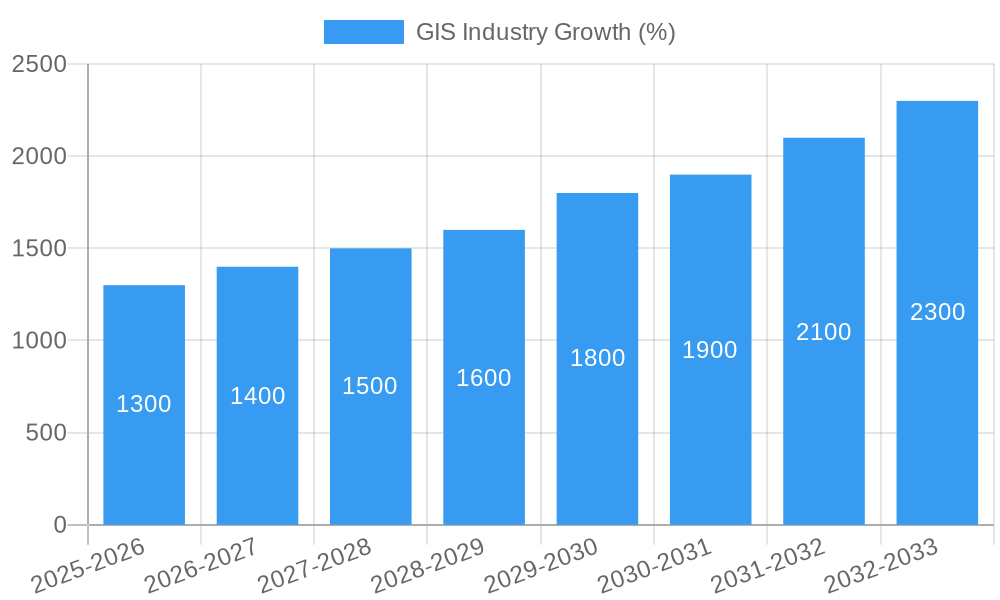
The GIS industry is experiencing robust growth, driven by the increasing availability of geospatial data, advancements in cloud computing and AI, and rising demand for location-based services. The market is expected to witness a Compound Annual Growth Rate (CAGR) of xx% during the forecast period (2025-2033). This growth is fueled by several key factors:
- Technological Disruptions: The integration of AI, machine learning, and IoT technologies enhances GIS capabilities, leading to improved decision-making and automation.
- Market Growth Drivers: The rising need for precise location intelligence across various industries is a primary driver. Government initiatives to improve infrastructure planning and management also contribute.
- Consumer Preferences: Demand for user-friendly, mobile-accessible GIS solutions is steadily increasing. The preference for cloud-based solutions is growing as well.
- Competitive Dynamics: Continuous product innovation, strategic partnerships, and aggressive marketing strategies shape the competitive landscape. Market penetration of cloud-based GIS solutions is projected to reach xx% by 2033.
Dominant Markets & Segments in GIS Industry
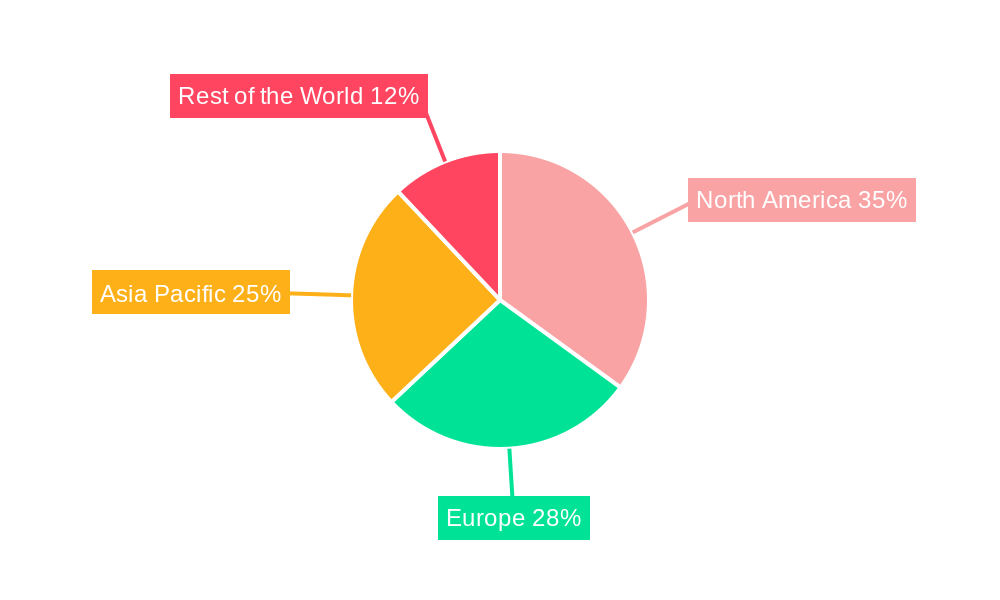
The North American region dominates the global GIS market, followed by Europe and Asia-Pacific. Within the segments:
- Component: The software segment holds the largest market share, driven by increasing demand for sophisticated GIS software solutions. Hardware is a smaller but essential component, with growing demand for high-precision GPS devices and sensors.
- Function: Mapping and surveying remain the dominant functions, with location-based services (LBS) experiencing rapid growth. Telematics and navigation are increasingly integrated into various sectors.
- End User: The utilities, transportation, and construction sectors are major consumers of GIS technology, followed by the oil and gas, mining, and agriculture industries.
Key Drivers for Dominant Segments:
- Utilities: Smart grid management, asset tracking, and network optimization.
- Transportation: Route planning, traffic management, and infrastructure development.
- Construction: Site planning, project management, and asset tracking.
- Oil & Gas: Exploration, production, and pipeline management.
- Agriculture: Precision farming, yield monitoring, and resource optimization.
GIS Industry Product Innovations
Recent innovations include advancements in 3D GIS, AI-powered spatial analytics, and integration with IoT devices. Cloud-based GIS platforms are gaining significant traction, providing enhanced accessibility and scalability. These innovations enable more efficient data management, analysis, and visualization, creating competitive advantages for GIS providers and offering valuable solutions across various industries.
Report Segmentation & Scope
This report segments the GIS market by component (hardware, software), function (mapping, surveying, telematics and navigation, location-based services), and end-user (agriculture, utilities, mining, construction, transportation, oil and gas). Each segment's market size, growth projections, and competitive landscape are analyzed in detail for the study period (2019-2033), base year (2025) and forecast period (2025-2033).
Key Drivers of GIS Industry Growth
Technological advancements, particularly in AI and cloud computing, are major growth catalysts. The increasing demand for location-based services across various industries and government initiatives promoting smart cities and infrastructure development further accelerate market expansion. Favorable economic conditions and supportive regulatory frameworks in certain regions also contribute to growth.
Challenges in the GIS Industry Sector
Challenges include integrating diverse data sources, ensuring data accuracy and interoperability, addressing data security concerns, and managing the complexity of implementing and maintaining GIS systems. Supply chain disruptions and intense competition among GIS providers also pose significant challenges.
Leading Players in the GIS Industry Market
- Bentley Systems
- Spatialworks
- Geosoft
- Topcon Positioning Systems
- Pitney Bowes Inc
- Hexagon AB
- ESRI Inc
- Trimble Inc
- Autodesk Inc
- Caliper Corporation
Key Developments in GIS Industry Sector
- November 2022: Launch of a new Geodata Portal and broadband maps in Connecticut, USA, showcasing the practical applications of GIS.
- November 2022: Implementation of a GIS-based system in Jammu and Kashmir, India, highlighting the technology's role in addressing regional challenges.
Strategic GIS Industry Market Outlook
The GIS industry is poised for continued expansion driven by technological innovation and increasing demand across diverse sectors. Strategic opportunities exist in developing AI-powered solutions, expanding cloud-based offerings, and focusing on niche applications. The market presents significant potential for growth and innovation in the coming years.
GIS Industry Segmentation
-
1. Component
- 1.1. Hardware
- 1.2. Software
-
2. Function
- 2.1. Mapping
- 2.2. Surveying
- 2.3. Telematics and Navigation
- 2.4. Location-based Services
-
3. End User
- 3.1. Agriculture
- 3.2. Utilities
- 3.3. Mining
- 3.4. Construction
- 3.5. Transportation
- 3.6. Oil and Gas
GIS Industry Segmentation By Geography
- 1. North America
- 2. Europe
- 3. Asia
- 4. Australia and New Zealand
- 5. Latin America
- 6. Middle East and Africa
GIS Industry REPORT HIGHLIGHTS
| Aspects | Details |
|---|---|
| Study Period | 2019-2033 |
| Base Year | 2024 |
| Estimated Year | 2025 |
| Forecast Period | 2025-2033 |
| Historical Period | 2019-2024 |
| Growth Rate | CAGR of 10.80% from 2019-2033 |
| Segmentation |
|
Table of Contents
- 1. Introduction
- 1.1. Research Scope
- 1.2. Market Segmentation
- 1.3. Research Methodology
- 1.4. Definitions and Assumptions
- 2. Executive Summary
- 2.1. Introduction
- 3. Market Dynamics
- 3.1. Introduction
- 3.2. Market Drivers
- 3.2.1. Growing role of GIS in smart cities ecosystem; Integration of location-based mapping systems with business intelligence systems
- 3.3. Market Restrains
- 3.3.1. Integration issues with traditional systems; Data quality and accuracy issues
- 3.4. Market Trends
- 3.4.1. The Rising Smart Cities Development and Urban Planning to Drive the Market Growth
- 4. Market Factor Analysis
- 4.1. Porters Five Forces
- 4.2. Supply/Value Chain
- 4.3. PESTEL analysis
- 4.4. Market Entropy
- 4.5. Patent/Trademark Analysis
- 5. Global GIS Industry Analysis, Insights and Forecast, 2019-2031
- 5.1. Market Analysis, Insights and Forecast - by Component
- 5.1.1. Hardware
- 5.1.2. Software
- 5.2. Market Analysis, Insights and Forecast - by Function
- 5.2.1. Mapping
- 5.2.2. Surveying
- 5.2.3. Telematics and Navigation
- 5.2.4. Location-based Services
- 5.3. Market Analysis, Insights and Forecast - by End User
- 5.3.1. Agriculture
- 5.3.2. Utilities
- 5.3.3. Mining
- 5.3.4. Construction
- 5.3.5. Transportation
- 5.3.6. Oil and Gas
- 5.4. Market Analysis, Insights and Forecast - by Region
- 5.4.1. North America
- 5.4.2. Europe
- 5.4.3. Asia
- 5.4.4. Australia and New Zealand
- 5.4.5. Latin America
- 5.4.6. Middle East and Africa
- 5.1. Market Analysis, Insights and Forecast - by Component
- 6. North America GIS Industry Analysis, Insights and Forecast, 2019-2031
- 6.1. Market Analysis, Insights and Forecast - by Component
- 6.1.1. Hardware
- 6.1.2. Software
- 6.2. Market Analysis, Insights and Forecast - by Function
- 6.2.1. Mapping
- 6.2.2. Surveying
- 6.2.3. Telematics and Navigation
- 6.2.4. Location-based Services
- 6.3. Market Analysis, Insights and Forecast - by End User
- 6.3.1. Agriculture
- 6.3.2. Utilities
- 6.3.3. Mining
- 6.3.4. Construction
- 6.3.5. Transportation
- 6.3.6. Oil and Gas
- 6.1. Market Analysis, Insights and Forecast - by Component
- 7. Europe GIS Industry Analysis, Insights and Forecast, 2019-2031
- 7.1. Market Analysis, Insights and Forecast - by Component
- 7.1.1. Hardware
- 7.1.2. Software
- 7.2. Market Analysis, Insights and Forecast - by Function
- 7.2.1. Mapping
- 7.2.2. Surveying
- 7.2.3. Telematics and Navigation
- 7.2.4. Location-based Services
- 7.3. Market Analysis, Insights and Forecast - by End User
- 7.3.1. Agriculture
- 7.3.2. Utilities
- 7.3.3. Mining
- 7.3.4. Construction
- 7.3.5. Transportation
- 7.3.6. Oil and Gas
- 7.1. Market Analysis, Insights and Forecast - by Component
- 8. Asia GIS Industry Analysis, Insights and Forecast, 2019-2031
- 8.1. Market Analysis, Insights and Forecast - by Component
- 8.1.1. Hardware
- 8.1.2. Software
- 8.2. Market Analysis, Insights and Forecast - by Function
- 8.2.1. Mapping
- 8.2.2. Surveying
- 8.2.3. Telematics and Navigation
- 8.2.4. Location-based Services
- 8.3. Market Analysis, Insights and Forecast - by End User
- 8.3.1. Agriculture
- 8.3.2. Utilities
- 8.3.3. Mining
- 8.3.4. Construction
- 8.3.5. Transportation
- 8.3.6. Oil and Gas
- 8.1. Market Analysis, Insights and Forecast - by Component
- 9. Australia and New Zealand GIS Industry Analysis, Insights and Forecast, 2019-2031
- 9.1. Market Analysis, Insights and Forecast - by Component
- 9.1.1. Hardware
- 9.1.2. Software
- 9.2. Market Analysis, Insights and Forecast - by Function
- 9.2.1. Mapping
- 9.2.2. Surveying
- 9.2.3. Telematics and Navigation
- 9.2.4. Location-based Services
- 9.3. Market Analysis, Insights and Forecast - by End User
- 9.3.1. Agriculture
- 9.3.2. Utilities
- 9.3.3. Mining
- 9.3.4. Construction
- 9.3.5. Transportation
- 9.3.6. Oil and Gas
- 9.1. Market Analysis, Insights and Forecast - by Component
- 10. Latin America GIS Industry Analysis, Insights and Forecast, 2019-2031
- 10.1. Market Analysis, Insights and Forecast - by Component
- 10.1.1. Hardware
- 10.1.2. Software
- 10.2. Market Analysis, Insights and Forecast - by Function
- 10.2.1. Mapping
- 10.2.2. Surveying
- 10.2.3. Telematics and Navigation
- 10.2.4. Location-based Services
- 10.3. Market Analysis, Insights and Forecast - by End User
- 10.3.1. Agriculture
- 10.3.2. Utilities
- 10.3.3. Mining
- 10.3.4. Construction
- 10.3.5. Transportation
- 10.3.6. Oil and Gas
- 10.1. Market Analysis, Insights and Forecast - by Component
- 11. Middle East and Africa GIS Industry Analysis, Insights and Forecast, 2019-2031
- 11.1. Market Analysis, Insights and Forecast - by Component
- 11.1.1. Hardware
- 11.1.2. Software
- 11.2. Market Analysis, Insights and Forecast - by Function
- 11.2.1. Mapping
- 11.2.2. Surveying
- 11.2.3. Telematics and Navigation
- 11.2.4. Location-based Services
- 11.3. Market Analysis, Insights and Forecast - by End User
- 11.3.1. Agriculture
- 11.3.2. Utilities
- 11.3.3. Mining
- 11.3.4. Construction
- 11.3.5. Transportation
- 11.3.6. Oil and Gas
- 11.1. Market Analysis, Insights and Forecast - by Component
- 12. North America GIS Industry Analysis, Insights and Forecast, 2019-2031
- 12.1. Market Analysis, Insights and Forecast - By Country/Sub-region
- 12.1.1.
- 13. Europe GIS Industry Analysis, Insights and Forecast, 2019-2031
- 13.1. Market Analysis, Insights and Forecast - By Country/Sub-region
- 13.1.1.
- 14. Asia Pacific GIS Industry Analysis, Insights and Forecast, 2019-2031
- 14.1. Market Analysis, Insights and Forecast - By Country/Sub-region
- 14.1.1.
- 15. Rest of the World GIS Industry Analysis, Insights and Forecast, 2019-2031
- 15.1. Market Analysis, Insights and Forecast - By Country/Sub-region
- 15.1.1.
- 16. Competitive Analysis
- 16.1. Global Market Share Analysis 2024
- 16.2. Company Profiles
- 16.2.1 Bentley Systems
- 16.2.1.1. Overview
- 16.2.1.2. Products
- 16.2.1.3. SWOT Analysis
- 16.2.1.4. Recent Developments
- 16.2.1.5. Financials (Based on Availability)
- 16.2.2 Spatialworks
- 16.2.2.1. Overview
- 16.2.2.2. Products
- 16.2.2.3. SWOT Analysis
- 16.2.2.4. Recent Developments
- 16.2.2.5. Financials (Based on Availability)
- 16.2.3 Geosoft
- 16.2.3.1. Overview
- 16.2.3.2. Products
- 16.2.3.3. SWOT Analysis
- 16.2.3.4. Recent Developments
- 16.2.3.5. Financials (Based on Availability)
- 16.2.4 Topcon Positioning Systems
- 16.2.4.1. Overview
- 16.2.4.2. Products
- 16.2.4.3. SWOT Analysis
- 16.2.4.4. Recent Developments
- 16.2.4.5. Financials (Based on Availability)
- 16.2.5 Pitney Bowes Inc
- 16.2.5.1. Overview
- 16.2.5.2. Products
- 16.2.5.3. SWOT Analysis
- 16.2.5.4. Recent Developments
- 16.2.5.5. Financials (Based on Availability)
- 16.2.6 Hexagon AB
- 16.2.6.1. Overview
- 16.2.6.2. Products
- 16.2.6.3. SWOT Analysis
- 16.2.6.4. Recent Developments
- 16.2.6.5. Financials (Based on Availability)
- 16.2.7 ESRI Inc
- 16.2.7.1. Overview
- 16.2.7.2. Products
- 16.2.7.3. SWOT Analysis
- 16.2.7.4. Recent Developments
- 16.2.7.5. Financials (Based on Availability)
- 16.2.8 Trimble Inc
- 16.2.8.1. Overview
- 16.2.8.2. Products
- 16.2.8.3. SWOT Analysis
- 16.2.8.4. Recent Developments
- 16.2.8.5. Financials (Based on Availability)
- 16.2.9 Autodesk Inc *List Not Exhaustive
- 16.2.9.1. Overview
- 16.2.9.2. Products
- 16.2.9.3. SWOT Analysis
- 16.2.9.4. Recent Developments
- 16.2.9.5. Financials (Based on Availability)
- 16.2.10 Caliper Corporation
- 16.2.10.1. Overview
- 16.2.10.2. Products
- 16.2.10.3. SWOT Analysis
- 16.2.10.4. Recent Developments
- 16.2.10.5. Financials (Based on Availability)
- 16.2.1 Bentley Systems
List of Figures
- Figure 1: Global GIS Industry Revenue Breakdown (Million, %) by Region 2024 & 2032
- Figure 2: North America GIS Industry Revenue (Million), by Country 2024 & 2032
- Figure 3: North America GIS Industry Revenue Share (%), by Country 2024 & 2032
- Figure 4: Europe GIS Industry Revenue (Million), by Country 2024 & 2032
- Figure 5: Europe GIS Industry Revenue Share (%), by Country 2024 & 2032
- Figure 6: Asia Pacific GIS Industry Revenue (Million), by Country 2024 & 2032
- Figure 7: Asia Pacific GIS Industry Revenue Share (%), by Country 2024 & 2032
- Figure 8: Rest of the World GIS Industry Revenue (Million), by Country 2024 & 2032
- Figure 9: Rest of the World GIS Industry Revenue Share (%), by Country 2024 & 2032
- Figure 10: North America GIS Industry Revenue (Million), by Component 2024 & 2032
- Figure 11: North America GIS Industry Revenue Share (%), by Component 2024 & 2032
- Figure 12: North America GIS Industry Revenue (Million), by Function 2024 & 2032
- Figure 13: North America GIS Industry Revenue Share (%), by Function 2024 & 2032
- Figure 14: North America GIS Industry Revenue (Million), by End User 2024 & 2032
- Figure 15: North America GIS Industry Revenue Share (%), by End User 2024 & 2032
- Figure 16: North America GIS Industry Revenue (Million), by Country 2024 & 2032
- Figure 17: North America GIS Industry Revenue Share (%), by Country 2024 & 2032
- Figure 18: Europe GIS Industry Revenue (Million), by Component 2024 & 2032
- Figure 19: Europe GIS Industry Revenue Share (%), by Component 2024 & 2032
- Figure 20: Europe GIS Industry Revenue (Million), by Function 2024 & 2032
- Figure 21: Europe GIS Industry Revenue Share (%), by Function 2024 & 2032
- Figure 22: Europe GIS Industry Revenue (Million), by End User 2024 & 2032
- Figure 23: Europe GIS Industry Revenue Share (%), by End User 2024 & 2032
- Figure 24: Europe GIS Industry Revenue (Million), by Country 2024 & 2032
- Figure 25: Europe GIS Industry Revenue Share (%), by Country 2024 & 2032
- Figure 26: Asia GIS Industry Revenue (Million), by Component 2024 & 2032
- Figure 27: Asia GIS Industry Revenue Share (%), by Component 2024 & 2032
- Figure 28: Asia GIS Industry Revenue (Million), by Function 2024 & 2032
- Figure 29: Asia GIS Industry Revenue Share (%), by Function 2024 & 2032
- Figure 30: Asia GIS Industry Revenue (Million), by End User 2024 & 2032
- Figure 31: Asia GIS Industry Revenue Share (%), by End User 2024 & 2032
- Figure 32: Asia GIS Industry Revenue (Million), by Country 2024 & 2032
- Figure 33: Asia GIS Industry Revenue Share (%), by Country 2024 & 2032
- Figure 34: Australia and New Zealand GIS Industry Revenue (Million), by Component 2024 & 2032
- Figure 35: Australia and New Zealand GIS Industry Revenue Share (%), by Component 2024 & 2032
- Figure 36: Australia and New Zealand GIS Industry Revenue (Million), by Function 2024 & 2032
- Figure 37: Australia and New Zealand GIS Industry Revenue Share (%), by Function 2024 & 2032
- Figure 38: Australia and New Zealand GIS Industry Revenue (Million), by End User 2024 & 2032
- Figure 39: Australia and New Zealand GIS Industry Revenue Share (%), by End User 2024 & 2032
- Figure 40: Australia and New Zealand GIS Industry Revenue (Million), by Country 2024 & 2032
- Figure 41: Australia and New Zealand GIS Industry Revenue Share (%), by Country 2024 & 2032
- Figure 42: Latin America GIS Industry Revenue (Million), by Component 2024 & 2032
- Figure 43: Latin America GIS Industry Revenue Share (%), by Component 2024 & 2032
- Figure 44: Latin America GIS Industry Revenue (Million), by Function 2024 & 2032
- Figure 45: Latin America GIS Industry Revenue Share (%), by Function 2024 & 2032
- Figure 46: Latin America GIS Industry Revenue (Million), by End User 2024 & 2032
- Figure 47: Latin America GIS Industry Revenue Share (%), by End User 2024 & 2032
- Figure 48: Latin America GIS Industry Revenue (Million), by Country 2024 & 2032
- Figure 49: Latin America GIS Industry Revenue Share (%), by Country 2024 & 2032
- Figure 50: Middle East and Africa GIS Industry Revenue (Million), by Component 2024 & 2032
- Figure 51: Middle East and Africa GIS Industry Revenue Share (%), by Component 2024 & 2032
- Figure 52: Middle East and Africa GIS Industry Revenue (Million), by Function 2024 & 2032
- Figure 53: Middle East and Africa GIS Industry Revenue Share (%), by Function 2024 & 2032
- Figure 54: Middle East and Africa GIS Industry Revenue (Million), by End User 2024 & 2032
- Figure 55: Middle East and Africa GIS Industry Revenue Share (%), by End User 2024 & 2032
- Figure 56: Middle East and Africa GIS Industry Revenue (Million), by Country 2024 & 2032
- Figure 57: Middle East and Africa GIS Industry Revenue Share (%), by Country 2024 & 2032
List of Tables
- Table 1: Global GIS Industry Revenue Million Forecast, by Region 2019 & 2032
- Table 2: Global GIS Industry Revenue Million Forecast, by Component 2019 & 2032
- Table 3: Global GIS Industry Revenue Million Forecast, by Function 2019 & 2032
- Table 4: Global GIS Industry Revenue Million Forecast, by End User 2019 & 2032
- Table 5: Global GIS Industry Revenue Million Forecast, by Region 2019 & 2032
- Table 6: Global GIS Industry Revenue Million Forecast, by Country 2019 & 2032
- Table 7: GIS Industry Revenue (Million) Forecast, by Application 2019 & 2032
- Table 8: Global GIS Industry Revenue Million Forecast, by Country 2019 & 2032
- Table 9: GIS Industry Revenue (Million) Forecast, by Application 2019 & 2032
- Table 10: Global GIS Industry Revenue Million Forecast, by Country 2019 & 2032
- Table 11: GIS Industry Revenue (Million) Forecast, by Application 2019 & 2032
- Table 12: Global GIS Industry Revenue Million Forecast, by Country 2019 & 2032
- Table 13: GIS Industry Revenue (Million) Forecast, by Application 2019 & 2032
- Table 14: Global GIS Industry Revenue Million Forecast, by Component 2019 & 2032
- Table 15: Global GIS Industry Revenue Million Forecast, by Function 2019 & 2032
- Table 16: Global GIS Industry Revenue Million Forecast, by End User 2019 & 2032
- Table 17: Global GIS Industry Revenue Million Forecast, by Country 2019 & 2032
- Table 18: Global GIS Industry Revenue Million Forecast, by Component 2019 & 2032
- Table 19: Global GIS Industry Revenue Million Forecast, by Function 2019 & 2032
- Table 20: Global GIS Industry Revenue Million Forecast, by End User 2019 & 2032
- Table 21: Global GIS Industry Revenue Million Forecast, by Country 2019 & 2032
- Table 22: Global GIS Industry Revenue Million Forecast, by Component 2019 & 2032
- Table 23: Global GIS Industry Revenue Million Forecast, by Function 2019 & 2032
- Table 24: Global GIS Industry Revenue Million Forecast, by End User 2019 & 2032
- Table 25: Global GIS Industry Revenue Million Forecast, by Country 2019 & 2032
- Table 26: Global GIS Industry Revenue Million Forecast, by Component 2019 & 2032
- Table 27: Global GIS Industry Revenue Million Forecast, by Function 2019 & 2032
- Table 28: Global GIS Industry Revenue Million Forecast, by End User 2019 & 2032
- Table 29: Global GIS Industry Revenue Million Forecast, by Country 2019 & 2032
- Table 30: Global GIS Industry Revenue Million Forecast, by Component 2019 & 2032
- Table 31: Global GIS Industry Revenue Million Forecast, by Function 2019 & 2032
- Table 32: Global GIS Industry Revenue Million Forecast, by End User 2019 & 2032
- Table 33: Global GIS Industry Revenue Million Forecast, by Country 2019 & 2032
- Table 34: Global GIS Industry Revenue Million Forecast, by Component 2019 & 2032
- Table 35: Global GIS Industry Revenue Million Forecast, by Function 2019 & 2032
- Table 36: Global GIS Industry Revenue Million Forecast, by End User 2019 & 2032
- Table 37: Global GIS Industry Revenue Million Forecast, by Country 2019 & 2032
Frequently Asked Questions
1. What is the projected Compound Annual Growth Rate (CAGR) of the GIS Industry?
The projected CAGR is approximately 10.80%.
2. Which companies are prominent players in the GIS Industry?
Key companies in the market include Bentley Systems, Spatialworks, Geosoft, Topcon Positioning Systems, Pitney Bowes Inc, Hexagon AB, ESRI Inc, Trimble Inc, Autodesk Inc *List Not Exhaustive, Caliper Corporation.
3. What are the main segments of the GIS Industry?
The market segments include Component, Function, End User.
4. Can you provide details about the market size?
The market size is estimated to be USD XX Million as of 2022.
5. What are some drivers contributing to market growth?
Growing role of GIS in smart cities ecosystem; Integration of location-based mapping systems with business intelligence systems.
6. What are the notable trends driving market growth?
The Rising Smart Cities Development and Urban Planning to Drive the Market Growth.
7. Are there any restraints impacting market growth?
Integration issues with traditional systems; Data quality and accuracy issues.
8. Can you provide examples of recent developments in the market?
November 2022 : The new Geodata Portal and broadband maps for the state will be accessible starting on November 18, 2022, according to a statement from the Connecticut Office of Policy and Management (OPM). This announcement was made on GIS Day 2022, which encourages people to learn about geography and the practical uses of GIS that can improve society.
9. What pricing options are available for accessing the report?
Pricing options include single-user, multi-user, and enterprise licenses priced at USD 4750, USD 5250, and USD 8750 respectively.
10. Is the market size provided in terms of value or volume?
The market size is provided in terms of value, measured in Million.
11. Are there any specific market keywords associated with the report?
Yes, the market keyword associated with the report is "GIS Industry," which aids in identifying and referencing the specific market segment covered.
12. How do I determine which pricing option suits my needs best?
The pricing options vary based on user requirements and access needs. Individual users may opt for single-user licenses, while businesses requiring broader access may choose multi-user or enterprise licenses for cost-effective access to the report.
13. Are there any additional resources or data provided in the GIS Industry report?
While the report offers comprehensive insights, it's advisable to review the specific contents or supplementary materials provided to ascertain if additional resources or data are available.
14. How can I stay updated on further developments or reports in the GIS Industry?
To stay informed about further developments, trends, and reports in the GIS Industry, consider subscribing to industry newsletters, following relevant companies and organizations, or regularly checking reputable industry news sources and publications.
Methodology
Step 1 - Identification of Relevant Samples Size from Population Database


Step 2 - Approaches for Defining Global Market Size (Value, Volume* & Price*)

Note*: In applicable scenarios
Step 3 - Data Sources
Primary Research
- Web Analytics
- Survey Reports
- Research Institute
- Latest Research Reports
- Opinion Leaders
Secondary Research
- Annual Reports
- White Paper
- Latest Press Release
- Industry Association
- Paid Database
- Investor Presentations

Step 4 - Data Triangulation
Involves using different sources of information in order to increase the validity of a study
These sources are likely to be stakeholders in a program - participants, other researchers, program staff, other community members, and so on.
Then we put all data in single framework & apply various statistical tools to find out the dynamic on the market.
During the analysis stage, feedback from the stakeholder groups would be compared to determine areas of agreement as well as areas of divergence


