
Key Insights
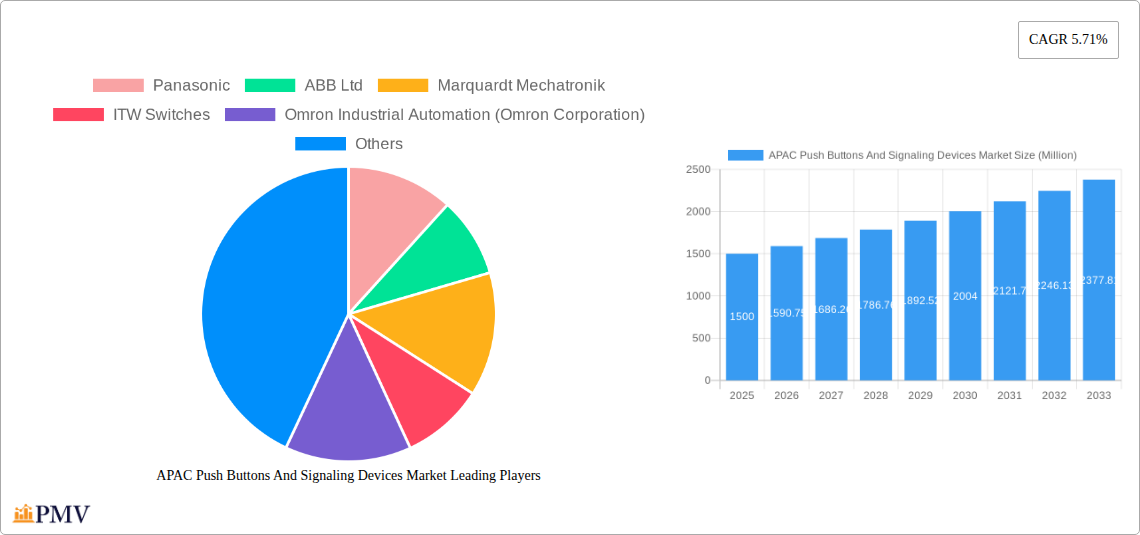
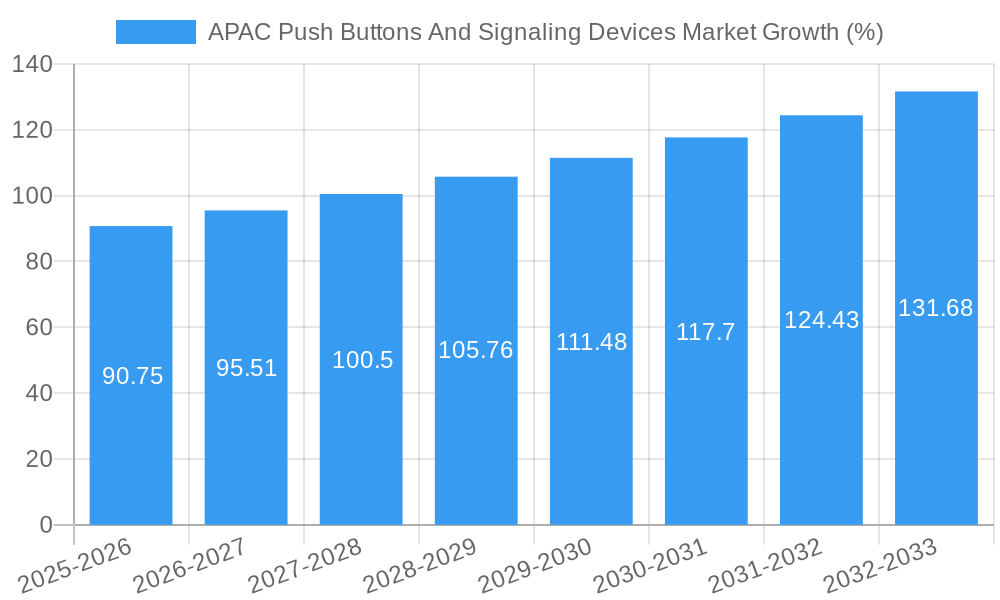
The Asia-Pacific (APAC) push buttons and signaling devices market, valued at approximately $1.5 billion in 2025, is projected to experience robust growth, driven by the region's expanding industrial automation sector and increasing adoption of advanced technologies across automotive, energy, and manufacturing industries. The market's Compound Annual Growth Rate (CAGR) of 5.71% from 2025 to 2033 indicates a significant increase in demand for sophisticated push buttons and signaling devices. This growth is fueled by several key factors: rising investments in infrastructure development, particularly in smart cities and factories; the increasing adoption of Industry 4.0 principles, promoting automation and interconnected systems; and a growing preference for user-friendly, durable, and technologically advanced signaling devices. Furthermore, the automotive industry's continuous innovation in vehicle electronics and the expansion of renewable energy projects in the region are major contributors to market expansion. The segment breakdown shows strong growth potential across diverse product types, including round/square body types, illuminated push buttons, and audible/visible signaling devices. China and India are anticipated to be the largest contributors to regional market growth, driven by their rapid industrialization and significant manufacturing activities. However, challenges such as potential supply chain disruptions and the need for adherence to stringent safety and quality standards might moderately restrain market growth in the coming years.
Despite potential restraints, the overall market outlook for APAC push buttons and signaling devices remains positive. The consistent adoption of advanced functionalities, such as integrated sensors and programmable logic controllers (PLCs), within push button systems, is driving premiumization and creating new revenue opportunities. Companies like Panasonic, ABB, and Omron are well-positioned to benefit from this growth, leveraging their established brand reputation and extensive product portfolios. The market is likely to witness increased competition as smaller, specialized manufacturers enter the market with innovative products and cost-effective solutions. The focus on energy efficiency and sustainability is expected to drive the demand for energy-efficient push buttons and signaling devices, further shaping market dynamics. Continuous technological advancements, coupled with the ongoing industrialization and infrastructure development across the region, promise sustained growth for the APAC push buttons and signaling devices market in the forecast period.
APAC Push Buttons and Signaling Devices Market: A Comprehensive Report (2019-2033)
This in-depth report provides a comprehensive analysis of the Asia-Pacific (APAC) push buttons and signaling devices market, offering valuable insights for stakeholders across the value chain. The study covers the period from 2019 to 2033, with a focus on the base year 2025 and a forecast period extending to 2033. The report segments the market by product type, application, end-user industry, and country, providing granular data for informed decision-making. Key players like Panasonic, ABB Ltd, and Omron are analyzed, highlighting their market share and strategic initiatives. The report also incorporates recent industry developments to illustrate market trends and future potential. The total market value in 2025 is estimated at xx Million, poised for significant growth in the coming years.
APAC Push Buttons And Signaling Devices Market Market Structure & Competitive Dynamics
The APAC push buttons and signaling devices market exhibits a moderately concentrated structure with several multinational players and regional manufacturers vying for market share. Market concentration is influenced by factors such as economies of scale, technological capabilities, and established distribution networks. Key players like Panasonic, ABB Ltd, and Omron hold significant market share, leveraging their brand reputation and extensive product portfolios. However, smaller, specialized companies also thrive by focusing on niche applications and innovative technologies.
The market's innovation ecosystem is dynamic, with ongoing advancements in materials, miniaturization, and smart functionalities. Regulatory frameworks, including safety and environmental standards, play a crucial role in shaping product design and market entry strategies. Product substitutes, like touch-sensitive interfaces and alternative signaling methods, present competitive pressures, compelling existing players to innovate and enhance their offerings. End-user trends toward automation, IoT integration, and enhanced safety measures are driving demand for advanced features and functionalities in push buttons and signaling devices.
Mergers and acquisitions (M&A) activities in the industry reflect the consolidation trend, with larger players seeking to expand their market reach and product portfolios. While precise M&A deal values for the APAC region are unavailable (xx Million), the overall impact of these activities is to increase market concentration and enhance the competitiveness of major players.
- Market Concentration: Moderately concentrated, with significant players holding a substantial market share.
- Innovation Ecosystem: Dynamic, characterized by ongoing technological advancements and material innovations.
- Regulatory Framework: Stringent safety and environmental standards influence product design.
- Product Substitutes: Presence of alternative signaling technologies necessitates ongoing innovation.
- End-User Trends: Automation, IoT integration, and safety needs drive demand for advanced features.
- M&A Activities: Ongoing consolidation with an estimated (xx Million) in M&A deals in the recent period.
APAC Push Buttons And Signaling Devices Market Industry Trends & Insights
The APAC push buttons and signaling devices market is experiencing robust growth, driven by several key factors. The rapid industrialization and urbanization across the region contribute significantly to this growth, with increasing demand from various end-user sectors including automotive, manufacturing, and energy and power. The rising adoption of automation technologies and the integration of smart systems are creating significant opportunities for advanced push button and signaling devices with features like remote monitoring, diagnostics, and improved safety mechanisms. Consumer preference is shifting towards more intuitive and user-friendly interfaces, influencing the design and functionality of these products.
Technological disruptions are transforming the industry, with the integration of IoT, AI, and other advanced technologies enabling enhanced functionalities. For instance, the introduction of smart switches with features like remote control and self-diagnostics has changed the competitive landscape. This has led to a higher CAGR (xx%) and increased market penetration (xx%) for intelligent push button and signaling devices. Competitive dynamics are primarily shaped by technological advancements, pricing strategies, brand reputation, and the ability to offer customized solutions. The market is experiencing a shift towards customized and integrated solutions, enabling better system optimization and efficiency gains for users.
Dominant Markets & Segments in APAC Push Buttons And Signaling Devices Market
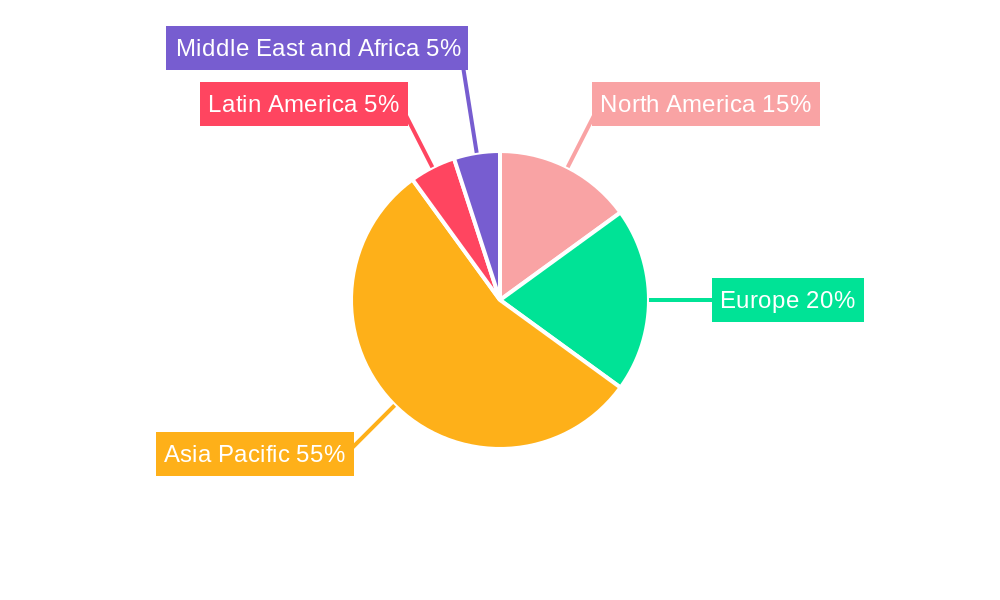
The APAC push buttons and signaling devices market is dominated by China, driven by its robust manufacturing sector and significant investments in infrastructure development. India is emerging as a key market, fueled by rapid industrialization and growth in automotive and other sectors. Japan maintains a strong presence, driven by advancements in automation and technological innovation. Within segments:
By Product: Round or square body types hold the largest market share due to their versatility and wide applicability. Non-lighted push buttons are widely used in various applications, creating significant demand, followed by other product variations.
By Type: Audible signaling devices cater to applications demanding audible feedback, while visible signaling devices are preferred where visual indication is crucial. Other types include more niche solutions offering unique functionalities and cater to specific requirements.
By End-user Industry: The automotive industry is a major driver of growth, followed by the manufacturing and energy and power sectors, with diverse needs from machinery controls to sophisticated safety systems. Food and beverage and transportation sectors also contribute significantly to market demand.
Key Drivers for China:
- Strong manufacturing base.
- Extensive infrastructure development.
- Rapid industrialization across various sectors.
Key Drivers for India:
- Rapid industrialization and economic growth.
- Growing automotive sector.
- Increasing adoption of automation technologies.
Key Drivers for Japan:
- Technological advancements and innovation in automation.
- Focus on safety and high-quality industrial processes.
APAC Push Buttons And Signaling Devices Market Product Innovations
Recent product developments in the APAC push buttons and signaling devices market highlight a focus on enhanced safety features, miniaturization, and smart functionalities. Manufacturers are integrating advanced technologies such as IoT connectivity, allowing for remote monitoring and diagnostics. The increased adoption of customizable designs, user-friendly interfaces, and durable materials provides competitive advantages, addressing varied application needs. The ongoing trend toward smaller, more energy-efficient, and environmentally friendly designs is also significantly impacting market choices.
Report Segmentation & Scope
This report comprehensively segments the APAC push buttons and signaling devices market:
- By Product: Round or Square Body Type, Non-lighted Push Button, Other Products (growth projections vary significantly according to product type).
- By Type: Audible, Visible, Other Types (each type caters to a specific demand and offers unique growth potential).
- By End-user Industry: Automotive, Energy and Power, Manufacturing, Food and Beverage, Transportation, Other End-user Industries (market size differs substantially based on industry-specific needs).
- By Country: India, China, Japan (market dynamics in each country are unique and reflect national growth patterns).
Each segment includes detailed analysis of market size, growth projections, and competitive dynamics.
Key Drivers of APAC Push Buttons And Signaling Devices Market Growth
Several factors drive the growth of the APAP push buttons and signaling devices market. Firstly, rapid industrialization and urbanization across the region are increasing demand from various sectors. Secondly, the ongoing automation trend is boosting the adoption of advanced signaling and control solutions. Finally, stringent safety regulations across many industries are driving the adoption of advanced safety features in push buttons and signaling devices. Government initiatives promoting industrial automation and smart city development further contribute to market expansion.
Challenges in the APAP Push Buttons And Signaling Devices Market Sector
Challenges facing the APAC push buttons and signaling devices market include intense competition from both domestic and international manufacturers. Maintaining consistent supply chains, especially in the face of geopolitical and economic uncertainties, is crucial. The stringent regulatory landscape, varying across countries, requires manufacturers to adapt to local standards. Fluctuations in raw material costs and currency exchange rates pose additional price pressures.
Leading Players in the APAC Push Buttons And Signaling Devices Market Market
- Panasonic
- ABB Ltd
- Marquardt Mechatronik
- ITW Switches
- Omron Industrial Automation (Omron Corporation)
- Kaihua Electronic
- Siemens AG
- Nihon Kaiheiki
- NKK Switches
- Schneider Electric
- Wurth Electronics
- Carling Technologies
- Littelfuse
- Eaton Corporation
Key Developments in APAC Push Buttons And Signaling Devices Market Sector
- October 2023: Alstom's launch of modern signaling systems with integrated platform screening doors in India signifies advancements in railway signaling technology, boosting demand for sophisticated signaling devices.
- August 2023: Hikvision's launch of a new generation of smart managed switches highlights the integration of smart functionalities, impacting the demand for network-connected signaling solutions.
Strategic APAC Push Buttons And Signaling Devices Market Market Outlook
The APAC push buttons and signaling devices market presents significant growth potential, driven by continuous industrialization, urbanization, and technological advancements. Strategic opportunities lie in developing innovative products with enhanced safety features, integrating smart functionalities, and providing customized solutions to meet diverse industry needs. Focusing on sustainable and energy-efficient designs will also attract environmentally conscious consumers and businesses. Expanding into emerging markets and strengthening partnerships with key players across the value chain are critical for achieving long-term success.
APAC Push Buttons And Signaling Devices Market Segmentation
-
1. Product
- 1.1. Round or Square Body Type
- 1.2. Non-lighted Push Button
- 1.3. Other Products
-
2. Type
- 2.1. Audible
- 2.2. Visible
- 2.3. Other Types
-
3. End-user Industry
- 3.1. Automotive
- 3.2. Energy and Power
- 3.3. Manufacturing
- 3.4. Food and Beverage
- 3.5. Transportation
- 3.6. Other End-user Industries
APAC Push Buttons And Signaling Devices Market Segmentation By Geography
-
1. North America
- 1.1. United States
- 1.2. Canada
- 1.3. Mexico
-
2. South America
- 2.1. Brazil
- 2.2. Argentina
- 2.3. Rest of South America
-
3. Europe
- 3.1. United Kingdom
- 3.2. Germany
- 3.3. France
- 3.4. Italy
- 3.5. Spain
- 3.6. Russia
- 3.7. Benelux
- 3.8. Nordics
- 3.9. Rest of Europe
-
4. Middle East & Africa
- 4.1. Turkey
- 4.2. Israel
- 4.3. GCC
- 4.4. North Africa
- 4.5. South Africa
- 4.6. Rest of Middle East & Africa
-
5. Asia Pacific
- 5.1. China
- 5.2. India
- 5.3. Japan
- 5.4. South Korea
- 5.5. ASEAN
- 5.6. Oceania
- 5.7. Rest of Asia Pacific
APAC Push Buttons And Signaling Devices Market REPORT HIGHLIGHTS
| Aspects | Details |
|---|---|
| Study Period | 2019-2033 |
| Base Year | 2024 |
| Estimated Year | 2025 |
| Forecast Period | 2025-2033 |
| Historical Period | 2019-2024 |
| Growth Rate | CAGR of 5.71% from 2019-2033 |
| Segmentation |
|
Table of Contents
- 1. Introduction
- 1.1. Research Scope
- 1.2. Market Segmentation
- 1.3. Research Methodology
- 1.4. Definitions and Assumptions
- 2. Executive Summary
- 2.1. Introduction
- 3. Market Dynamics
- 3.1. Introduction
- 3.2. Market Drivers
- 3.2.1. Increasing Use of Fire Alarm Management Systems and Safety Systems; Favorable Government Regulations for Industrial Safety
- 3.3. Market Restrains
- 3.3.1. High Initial Investment in Creating Supporting Infrastructure and Automation
- 3.4. Market Trends
- 3.4.1. The Automotive Segment is Expected to Hold a Significant Market Share
- 4. Market Factor Analysis
- 4.1. Porters Five Forces
- 4.2. Supply/Value Chain
- 4.3. PESTEL analysis
- 4.4. Market Entropy
- 4.5. Patent/Trademark Analysis
- 5. Global APAC Push Buttons And Signaling Devices Market Analysis, Insights and Forecast, 2019-2031
- 5.1. Market Analysis, Insights and Forecast - by Product
- 5.1.1. Round or Square Body Type
- 5.1.2. Non-lighted Push Button
- 5.1.3. Other Products
- 5.2. Market Analysis, Insights and Forecast - by Type
- 5.2.1. Audible
- 5.2.2. Visible
- 5.2.3. Other Types
- 5.3. Market Analysis, Insights and Forecast - by End-user Industry
- 5.3.1. Automotive
- 5.3.2. Energy and Power
- 5.3.3. Manufacturing
- 5.3.4. Food and Beverage
- 5.3.5. Transportation
- 5.3.6. Other End-user Industries
- 5.4. Market Analysis, Insights and Forecast - by Region
- 5.4.1. North America
- 5.4.2. South America
- 5.4.3. Europe
- 5.4.4. Middle East & Africa
- 5.4.5. Asia Pacific
- 5.1. Market Analysis, Insights and Forecast - by Product
- 6. North America APAC Push Buttons And Signaling Devices Market Analysis, Insights and Forecast, 2019-2031
- 6.1. Market Analysis, Insights and Forecast - by Product
- 6.1.1. Round or Square Body Type
- 6.1.2. Non-lighted Push Button
- 6.1.3. Other Products
- 6.2. Market Analysis, Insights and Forecast - by Type
- 6.2.1. Audible
- 6.2.2. Visible
- 6.2.3. Other Types
- 6.3. Market Analysis, Insights and Forecast - by End-user Industry
- 6.3.1. Automotive
- 6.3.2. Energy and Power
- 6.3.3. Manufacturing
- 6.3.4. Food and Beverage
- 6.3.5. Transportation
- 6.3.6. Other End-user Industries
- 6.1. Market Analysis, Insights and Forecast - by Product
- 7. South America APAC Push Buttons And Signaling Devices Market Analysis, Insights and Forecast, 2019-2031
- 7.1. Market Analysis, Insights and Forecast - by Product
- 7.1.1. Round or Square Body Type
- 7.1.2. Non-lighted Push Button
- 7.1.3. Other Products
- 7.2. Market Analysis, Insights and Forecast - by Type
- 7.2.1. Audible
- 7.2.2. Visible
- 7.2.3. Other Types
- 7.3. Market Analysis, Insights and Forecast - by End-user Industry
- 7.3.1. Automotive
- 7.3.2. Energy and Power
- 7.3.3. Manufacturing
- 7.3.4. Food and Beverage
- 7.3.5. Transportation
- 7.3.6. Other End-user Industries
- 7.1. Market Analysis, Insights and Forecast - by Product
- 8. Europe APAC Push Buttons And Signaling Devices Market Analysis, Insights and Forecast, 2019-2031
- 8.1. Market Analysis, Insights and Forecast - by Product
- 8.1.1. Round or Square Body Type
- 8.1.2. Non-lighted Push Button
- 8.1.3. Other Products
- 8.2. Market Analysis, Insights and Forecast - by Type
- 8.2.1. Audible
- 8.2.2. Visible
- 8.2.3. Other Types
- 8.3. Market Analysis, Insights and Forecast - by End-user Industry
- 8.3.1. Automotive
- 8.3.2. Energy and Power
- 8.3.3. Manufacturing
- 8.3.4. Food and Beverage
- 8.3.5. Transportation
- 8.3.6. Other End-user Industries
- 8.1. Market Analysis, Insights and Forecast - by Product
- 9. Middle East & Africa APAC Push Buttons And Signaling Devices Market Analysis, Insights and Forecast, 2019-2031
- 9.1. Market Analysis, Insights and Forecast - by Product
- 9.1.1. Round or Square Body Type
- 9.1.2. Non-lighted Push Button
- 9.1.3. Other Products
- 9.2. Market Analysis, Insights and Forecast - by Type
- 9.2.1. Audible
- 9.2.2. Visible
- 9.2.3. Other Types
- 9.3. Market Analysis, Insights and Forecast - by End-user Industry
- 9.3.1. Automotive
- 9.3.2. Energy and Power
- 9.3.3. Manufacturing
- 9.3.4. Food and Beverage
- 9.3.5. Transportation
- 9.3.6. Other End-user Industries
- 9.1. Market Analysis, Insights and Forecast - by Product
- 10. Asia Pacific APAC Push Buttons And Signaling Devices Market Analysis, Insights and Forecast, 2019-2031
- 10.1. Market Analysis, Insights and Forecast - by Product
- 10.1.1. Round or Square Body Type
- 10.1.2. Non-lighted Push Button
- 10.1.3. Other Products
- 10.2. Market Analysis, Insights and Forecast - by Type
- 10.2.1. Audible
- 10.2.2. Visible
- 10.2.3. Other Types
- 10.3. Market Analysis, Insights and Forecast - by End-user Industry
- 10.3.1. Automotive
- 10.3.2. Energy and Power
- 10.3.3. Manufacturing
- 10.3.4. Food and Beverage
- 10.3.5. Transportation
- 10.3.6. Other End-user Industries
- 10.1. Market Analysis, Insights and Forecast - by Product
- 11. North America APAC Push Buttons And Signaling Devices Market Analysis, Insights and Forecast, 2019-2031
- 11.1. Market Analysis, Insights and Forecast - By Country/Sub-region
- 11.1.1.
- 12. Europe APAC Push Buttons And Signaling Devices Market Analysis, Insights and Forecast, 2019-2031
- 12.1. Market Analysis, Insights and Forecast - By Country/Sub-region
- 12.1.1.
- 13. Asia Pacific APAC Push Buttons And Signaling Devices Market Analysis, Insights and Forecast, 2019-2031
- 13.1. Market Analysis, Insights and Forecast - By Country/Sub-region
- 13.1.1.
- 14. Latin America APAC Push Buttons And Signaling Devices Market Analysis, Insights and Forecast, 2019-2031
- 14.1. Market Analysis, Insights and Forecast - By Country/Sub-region
- 14.1.1.
- 15. Middle East and Africa APAC Push Buttons And Signaling Devices Market Analysis, Insights and Forecast, 2019-2031
- 15.1. Market Analysis, Insights and Forecast - By Country/Sub-region
- 15.1.1.
- 16. Competitive Analysis
- 16.1. Global Market Share Analysis 2024
- 16.2. Company Profiles
- 16.2.1 Panasonic
- 16.2.1.1. Overview
- 16.2.1.2. Products
- 16.2.1.3. SWOT Analysis
- 16.2.1.4. Recent Developments
- 16.2.1.5. Financials (Based on Availability)
- 16.2.2 ABB Ltd
- 16.2.2.1. Overview
- 16.2.2.2. Products
- 16.2.2.3. SWOT Analysis
- 16.2.2.4. Recent Developments
- 16.2.2.5. Financials (Based on Availability)
- 16.2.3 Marquardt Mechatronik
- 16.2.3.1. Overview
- 16.2.3.2. Products
- 16.2.3.3. SWOT Analysis
- 16.2.3.4. Recent Developments
- 16.2.3.5. Financials (Based on Availability)
- 16.2.4 ITW Switches
- 16.2.4.1. Overview
- 16.2.4.2. Products
- 16.2.4.3. SWOT Analysis
- 16.2.4.4. Recent Developments
- 16.2.4.5. Financials (Based on Availability)
- 16.2.5 Omron Industrial Automation (Omron Corporation)
- 16.2.5.1. Overview
- 16.2.5.2. Products
- 16.2.5.3. SWOT Analysis
- 16.2.5.4. Recent Developments
- 16.2.5.5. Financials (Based on Availability)
- 16.2.6 Kaihua Electronic
- 16.2.6.1. Overview
- 16.2.6.2. Products
- 16.2.6.3. SWOT Analysis
- 16.2.6.4. Recent Developments
- 16.2.6.5. Financials (Based on Availability)
- 16.2.7 Siemens AG
- 16.2.7.1. Overview
- 16.2.7.2. Products
- 16.2.7.3. SWOT Analysis
- 16.2.7.4. Recent Developments
- 16.2.7.5. Financials (Based on Availability)
- 16.2.8 Nihon Kaiheiki
- 16.2.8.1. Overview
- 16.2.8.2. Products
- 16.2.8.3. SWOT Analysis
- 16.2.8.4. Recent Developments
- 16.2.8.5. Financials (Based on Availability)
- 16.2.9 NKK Switches
- 16.2.9.1. Overview
- 16.2.9.2. Products
- 16.2.9.3. SWOT Analysis
- 16.2.9.4. Recent Developments
- 16.2.9.5. Financials (Based on Availability)
- 16.2.10 Schneider Electric
- 16.2.10.1. Overview
- 16.2.10.2. Products
- 16.2.10.3. SWOT Analysis
- 16.2.10.4. Recent Developments
- 16.2.10.5. Financials (Based on Availability)
- 16.2.11 Wurth Electronics
- 16.2.11.1. Overview
- 16.2.11.2. Products
- 16.2.11.3. SWOT Analysis
- 16.2.11.4. Recent Developments
- 16.2.11.5. Financials (Based on Availability)
- 16.2.12 Carling Technologies
- 16.2.12.1. Overview
- 16.2.12.2. Products
- 16.2.12.3. SWOT Analysis
- 16.2.12.4. Recent Developments
- 16.2.12.5. Financials (Based on Availability)
- 16.2.13 Littelfuse
- 16.2.13.1. Overview
- 16.2.13.2. Products
- 16.2.13.3. SWOT Analysis
- 16.2.13.4. Recent Developments
- 16.2.13.5. Financials (Based on Availability)
- 16.2.14 Eaton Corporation
- 16.2.14.1. Overview
- 16.2.14.2. Products
- 16.2.14.3. SWOT Analysis
- 16.2.14.4. Recent Developments
- 16.2.14.5. Financials (Based on Availability)
- 16.2.1 Panasonic
List of Figures
- Figure 1: Global APAC Push Buttons And Signaling Devices Market Revenue Breakdown (Million, %) by Region 2024 & 2032
- Figure 2: North America APAC Push Buttons And Signaling Devices Market Revenue (Million), by Country 2024 & 2032
- Figure 3: North America APAC Push Buttons And Signaling Devices Market Revenue Share (%), by Country 2024 & 2032
- Figure 4: Europe APAC Push Buttons And Signaling Devices Market Revenue (Million), by Country 2024 & 2032
- Figure 5: Europe APAC Push Buttons And Signaling Devices Market Revenue Share (%), by Country 2024 & 2032
- Figure 6: Asia Pacific APAC Push Buttons And Signaling Devices Market Revenue (Million), by Country 2024 & 2032
- Figure 7: Asia Pacific APAC Push Buttons And Signaling Devices Market Revenue Share (%), by Country 2024 & 2032
- Figure 8: Latin America APAC Push Buttons And Signaling Devices Market Revenue (Million), by Country 2024 & 2032
- Figure 9: Latin America APAC Push Buttons And Signaling Devices Market Revenue Share (%), by Country 2024 & 2032
- Figure 10: Middle East and Africa APAC Push Buttons And Signaling Devices Market Revenue (Million), by Country 2024 & 2032
- Figure 11: Middle East and Africa APAC Push Buttons And Signaling Devices Market Revenue Share (%), by Country 2024 & 2032
- Figure 12: North America APAC Push Buttons And Signaling Devices Market Revenue (Million), by Product 2024 & 2032
- Figure 13: North America APAC Push Buttons And Signaling Devices Market Revenue Share (%), by Product 2024 & 2032
- Figure 14: North America APAC Push Buttons And Signaling Devices Market Revenue (Million), by Type 2024 & 2032
- Figure 15: North America APAC Push Buttons And Signaling Devices Market Revenue Share (%), by Type 2024 & 2032
- Figure 16: North America APAC Push Buttons And Signaling Devices Market Revenue (Million), by End-user Industry 2024 & 2032
- Figure 17: North America APAC Push Buttons And Signaling Devices Market Revenue Share (%), by End-user Industry 2024 & 2032
- Figure 18: North America APAC Push Buttons And Signaling Devices Market Revenue (Million), by Country 2024 & 2032
- Figure 19: North America APAC Push Buttons And Signaling Devices Market Revenue Share (%), by Country 2024 & 2032
- Figure 20: South America APAC Push Buttons And Signaling Devices Market Revenue (Million), by Product 2024 & 2032
- Figure 21: South America APAC Push Buttons And Signaling Devices Market Revenue Share (%), by Product 2024 & 2032
- Figure 22: South America APAC Push Buttons And Signaling Devices Market Revenue (Million), by Type 2024 & 2032
- Figure 23: South America APAC Push Buttons And Signaling Devices Market Revenue Share (%), by Type 2024 & 2032
- Figure 24: South America APAC Push Buttons And Signaling Devices Market Revenue (Million), by End-user Industry 2024 & 2032
- Figure 25: South America APAC Push Buttons And Signaling Devices Market Revenue Share (%), by End-user Industry 2024 & 2032
- Figure 26: South America APAC Push Buttons And Signaling Devices Market Revenue (Million), by Country 2024 & 2032
- Figure 27: South America APAC Push Buttons And Signaling Devices Market Revenue Share (%), by Country 2024 & 2032
- Figure 28: Europe APAC Push Buttons And Signaling Devices Market Revenue (Million), by Product 2024 & 2032
- Figure 29: Europe APAC Push Buttons And Signaling Devices Market Revenue Share (%), by Product 2024 & 2032
- Figure 30: Europe APAC Push Buttons And Signaling Devices Market Revenue (Million), by Type 2024 & 2032
- Figure 31: Europe APAC Push Buttons And Signaling Devices Market Revenue Share (%), by Type 2024 & 2032
- Figure 32: Europe APAC Push Buttons And Signaling Devices Market Revenue (Million), by End-user Industry 2024 & 2032
- Figure 33: Europe APAC Push Buttons And Signaling Devices Market Revenue Share (%), by End-user Industry 2024 & 2032
- Figure 34: Europe APAC Push Buttons And Signaling Devices Market Revenue (Million), by Country 2024 & 2032
- Figure 35: Europe APAC Push Buttons And Signaling Devices Market Revenue Share (%), by Country 2024 & 2032
- Figure 36: Middle East & Africa APAC Push Buttons And Signaling Devices Market Revenue (Million), by Product 2024 & 2032
- Figure 37: Middle East & Africa APAC Push Buttons And Signaling Devices Market Revenue Share (%), by Product 2024 & 2032
- Figure 38: Middle East & Africa APAC Push Buttons And Signaling Devices Market Revenue (Million), by Type 2024 & 2032
- Figure 39: Middle East & Africa APAC Push Buttons And Signaling Devices Market Revenue Share (%), by Type 2024 & 2032
- Figure 40: Middle East & Africa APAC Push Buttons And Signaling Devices Market Revenue (Million), by End-user Industry 2024 & 2032
- Figure 41: Middle East & Africa APAC Push Buttons And Signaling Devices Market Revenue Share (%), by End-user Industry 2024 & 2032
- Figure 42: Middle East & Africa APAC Push Buttons And Signaling Devices Market Revenue (Million), by Country 2024 & 2032
- Figure 43: Middle East & Africa APAC Push Buttons And Signaling Devices Market Revenue Share (%), by Country 2024 & 2032
- Figure 44: Asia Pacific APAC Push Buttons And Signaling Devices Market Revenue (Million), by Product 2024 & 2032
- Figure 45: Asia Pacific APAC Push Buttons And Signaling Devices Market Revenue Share (%), by Product 2024 & 2032
- Figure 46: Asia Pacific APAC Push Buttons And Signaling Devices Market Revenue (Million), by Type 2024 & 2032
- Figure 47: Asia Pacific APAC Push Buttons And Signaling Devices Market Revenue Share (%), by Type 2024 & 2032
- Figure 48: Asia Pacific APAC Push Buttons And Signaling Devices Market Revenue (Million), by End-user Industry 2024 & 2032
- Figure 49: Asia Pacific APAC Push Buttons And Signaling Devices Market Revenue Share (%), by End-user Industry 2024 & 2032
- Figure 50: Asia Pacific APAC Push Buttons And Signaling Devices Market Revenue (Million), by Country 2024 & 2032
- Figure 51: Asia Pacific APAC Push Buttons And Signaling Devices Market Revenue Share (%), by Country 2024 & 2032
List of Tables
- Table 1: Global APAC Push Buttons And Signaling Devices Market Revenue Million Forecast, by Region 2019 & 2032
- Table 2: Global APAC Push Buttons And Signaling Devices Market Revenue Million Forecast, by Product 2019 & 2032
- Table 3: Global APAC Push Buttons And Signaling Devices Market Revenue Million Forecast, by Type 2019 & 2032
- Table 4: Global APAC Push Buttons And Signaling Devices Market Revenue Million Forecast, by End-user Industry 2019 & 2032
- Table 5: Global APAC Push Buttons And Signaling Devices Market Revenue Million Forecast, by Region 2019 & 2032
- Table 6: Global APAC Push Buttons And Signaling Devices Market Revenue Million Forecast, by Country 2019 & 2032
- Table 7: APAC Push Buttons And Signaling Devices Market Revenue (Million) Forecast, by Application 2019 & 2032
- Table 8: Global APAC Push Buttons And Signaling Devices Market Revenue Million Forecast, by Country 2019 & 2032
- Table 9: APAC Push Buttons And Signaling Devices Market Revenue (Million) Forecast, by Application 2019 & 2032
- Table 10: Global APAC Push Buttons And Signaling Devices Market Revenue Million Forecast, by Country 2019 & 2032
- Table 11: APAC Push Buttons And Signaling Devices Market Revenue (Million) Forecast, by Application 2019 & 2032
- Table 12: Global APAC Push Buttons And Signaling Devices Market Revenue Million Forecast, by Country 2019 & 2032
- Table 13: APAC Push Buttons And Signaling Devices Market Revenue (Million) Forecast, by Application 2019 & 2032
- Table 14: Global APAC Push Buttons And Signaling Devices Market Revenue Million Forecast, by Country 2019 & 2032
- Table 15: APAC Push Buttons And Signaling Devices Market Revenue (Million) Forecast, by Application 2019 & 2032
- Table 16: Global APAC Push Buttons And Signaling Devices Market Revenue Million Forecast, by Product 2019 & 2032
- Table 17: Global APAC Push Buttons And Signaling Devices Market Revenue Million Forecast, by Type 2019 & 2032
- Table 18: Global APAC Push Buttons And Signaling Devices Market Revenue Million Forecast, by End-user Industry 2019 & 2032
- Table 19: Global APAC Push Buttons And Signaling Devices Market Revenue Million Forecast, by Country 2019 & 2032
- Table 20: United States APAC Push Buttons And Signaling Devices Market Revenue (Million) Forecast, by Application 2019 & 2032
- Table 21: Canada APAC Push Buttons And Signaling Devices Market Revenue (Million) Forecast, by Application 2019 & 2032
- Table 22: Mexico APAC Push Buttons And Signaling Devices Market Revenue (Million) Forecast, by Application 2019 & 2032
- Table 23: Global APAC Push Buttons And Signaling Devices Market Revenue Million Forecast, by Product 2019 & 2032
- Table 24: Global APAC Push Buttons And Signaling Devices Market Revenue Million Forecast, by Type 2019 & 2032
- Table 25: Global APAC Push Buttons And Signaling Devices Market Revenue Million Forecast, by End-user Industry 2019 & 2032
- Table 26: Global APAC Push Buttons And Signaling Devices Market Revenue Million Forecast, by Country 2019 & 2032
- Table 27: Brazil APAC Push Buttons And Signaling Devices Market Revenue (Million) Forecast, by Application 2019 & 2032
- Table 28: Argentina APAC Push Buttons And Signaling Devices Market Revenue (Million) Forecast, by Application 2019 & 2032
- Table 29: Rest of South America APAC Push Buttons And Signaling Devices Market Revenue (Million) Forecast, by Application 2019 & 2032
- Table 30: Global APAC Push Buttons And Signaling Devices Market Revenue Million Forecast, by Product 2019 & 2032
- Table 31: Global APAC Push Buttons And Signaling Devices Market Revenue Million Forecast, by Type 2019 & 2032
- Table 32: Global APAC Push Buttons And Signaling Devices Market Revenue Million Forecast, by End-user Industry 2019 & 2032
- Table 33: Global APAC Push Buttons And Signaling Devices Market Revenue Million Forecast, by Country 2019 & 2032
- Table 34: United Kingdom APAC Push Buttons And Signaling Devices Market Revenue (Million) Forecast, by Application 2019 & 2032
- Table 35: Germany APAC Push Buttons And Signaling Devices Market Revenue (Million) Forecast, by Application 2019 & 2032
- Table 36: France APAC Push Buttons And Signaling Devices Market Revenue (Million) Forecast, by Application 2019 & 2032
- Table 37: Italy APAC Push Buttons And Signaling Devices Market Revenue (Million) Forecast, by Application 2019 & 2032
- Table 38: Spain APAC Push Buttons And Signaling Devices Market Revenue (Million) Forecast, by Application 2019 & 2032
- Table 39: Russia APAC Push Buttons And Signaling Devices Market Revenue (Million) Forecast, by Application 2019 & 2032
- Table 40: Benelux APAC Push Buttons And Signaling Devices Market Revenue (Million) Forecast, by Application 2019 & 2032
- Table 41: Nordics APAC Push Buttons And Signaling Devices Market Revenue (Million) Forecast, by Application 2019 & 2032
- Table 42: Rest of Europe APAC Push Buttons And Signaling Devices Market Revenue (Million) Forecast, by Application 2019 & 2032
- Table 43: Global APAC Push Buttons And Signaling Devices Market Revenue Million Forecast, by Product 2019 & 2032
- Table 44: Global APAC Push Buttons And Signaling Devices Market Revenue Million Forecast, by Type 2019 & 2032
- Table 45: Global APAC Push Buttons And Signaling Devices Market Revenue Million Forecast, by End-user Industry 2019 & 2032
- Table 46: Global APAC Push Buttons And Signaling Devices Market Revenue Million Forecast, by Country 2019 & 2032
- Table 47: Turkey APAC Push Buttons And Signaling Devices Market Revenue (Million) Forecast, by Application 2019 & 2032
- Table 48: Israel APAC Push Buttons And Signaling Devices Market Revenue (Million) Forecast, by Application 2019 & 2032
- Table 49: GCC APAC Push Buttons And Signaling Devices Market Revenue (Million) Forecast, by Application 2019 & 2032
- Table 50: North Africa APAC Push Buttons And Signaling Devices Market Revenue (Million) Forecast, by Application 2019 & 2032
- Table 51: South Africa APAC Push Buttons And Signaling Devices Market Revenue (Million) Forecast, by Application 2019 & 2032
- Table 52: Rest of Middle East & Africa APAC Push Buttons And Signaling Devices Market Revenue (Million) Forecast, by Application 2019 & 2032
- Table 53: Global APAC Push Buttons And Signaling Devices Market Revenue Million Forecast, by Product 2019 & 2032
- Table 54: Global APAC Push Buttons And Signaling Devices Market Revenue Million Forecast, by Type 2019 & 2032
- Table 55: Global APAC Push Buttons And Signaling Devices Market Revenue Million Forecast, by End-user Industry 2019 & 2032
- Table 56: Global APAC Push Buttons And Signaling Devices Market Revenue Million Forecast, by Country 2019 & 2032
- Table 57: China APAC Push Buttons And Signaling Devices Market Revenue (Million) Forecast, by Application 2019 & 2032
- Table 58: India APAC Push Buttons And Signaling Devices Market Revenue (Million) Forecast, by Application 2019 & 2032
- Table 59: Japan APAC Push Buttons And Signaling Devices Market Revenue (Million) Forecast, by Application 2019 & 2032
- Table 60: South Korea APAC Push Buttons And Signaling Devices Market Revenue (Million) Forecast, by Application 2019 & 2032
- Table 61: ASEAN APAC Push Buttons And Signaling Devices Market Revenue (Million) Forecast, by Application 2019 & 2032
- Table 62: Oceania APAC Push Buttons And Signaling Devices Market Revenue (Million) Forecast, by Application 2019 & 2032
- Table 63: Rest of Asia Pacific APAC Push Buttons And Signaling Devices Market Revenue (Million) Forecast, by Application 2019 & 2032
Frequently Asked Questions
1. What is the projected Compound Annual Growth Rate (CAGR) of the APAC Push Buttons And Signaling Devices Market?
The projected CAGR is approximately 5.71%.
2. Which companies are prominent players in the APAC Push Buttons And Signaling Devices Market?
Key companies in the market include Panasonic, ABB Ltd, Marquardt Mechatronik, ITW Switches, Omron Industrial Automation (Omron Corporation), Kaihua Electronic, Siemens AG, Nihon Kaiheiki, NKK Switches, Schneider Electric, Wurth Electronics, Carling Technologies, Littelfuse, Eaton Corporation.
3. What are the main segments of the APAC Push Buttons And Signaling Devices Market?
The market segments include Product, Type, End-user Industry.
4. Can you provide details about the market size?
The market size is estimated to be USD 1.5 Million as of 2022.
5. What are some drivers contributing to market growth?
Increasing Use of Fire Alarm Management Systems and Safety Systems; Favorable Government Regulations for Industrial Safety.
6. What are the notable trends driving market growth?
The Automotive Segment is Expected to Hold a Significant Market Share.
7. Are there any restraints impacting market growth?
High Initial Investment in Creating Supporting Infrastructure and Automation.
8. Can you provide examples of recent developments in the market?
October 2023: Alstom, the world's largest railway equipment manufacturer, marked the global debut of its modern signaling systems with integrated platform screening doors with the inauguration of the first Regional Rapid Transit System in India.
9. What pricing options are available for accessing the report?
Pricing options include single-user, multi-user, and enterprise licenses priced at USD 4750, USD 4950, and USD 6800 respectively.
10. Is the market size provided in terms of value or volume?
The market size is provided in terms of value, measured in Million.
11. Are there any specific market keywords associated with the report?
Yes, the market keyword associated with the report is "APAC Push Buttons And Signaling Devices Market," which aids in identifying and referencing the specific market segment covered.
12. How do I determine which pricing option suits my needs best?
The pricing options vary based on user requirements and access needs. Individual users may opt for single-user licenses, while businesses requiring broader access may choose multi-user or enterprise licenses for cost-effective access to the report.
13. Are there any additional resources or data provided in the APAC Push Buttons And Signaling Devices Market report?
While the report offers comprehensive insights, it's advisable to review the specific contents or supplementary materials provided to ascertain if additional resources or data are available.
14. How can I stay updated on further developments or reports in the APAC Push Buttons And Signaling Devices Market?
To stay informed about further developments, trends, and reports in the APAC Push Buttons And Signaling Devices Market, consider subscribing to industry newsletters, following relevant companies and organizations, or regularly checking reputable industry news sources and publications.
Methodology
Step 1 - Identification of Relevant Samples Size from Population Database


Step 2 - Approaches for Defining Global Market Size (Value, Volume* & Price*)

Note*: In applicable scenarios
Step 3 - Data Sources
Primary Research
- Web Analytics
- Survey Reports
- Research Institute
- Latest Research Reports
- Opinion Leaders
Secondary Research
- Annual Reports
- White Paper
- Latest Press Release
- Industry Association
- Paid Database
- Investor Presentations

Step 4 - Data Triangulation
Involves using different sources of information in order to increase the validity of a study
These sources are likely to be stakeholders in a program - participants, other researchers, program staff, other community members, and so on.
Then we put all data in single framework & apply various statistical tools to find out the dynamic on the market.
During the analysis stage, feedback from the stakeholder groups would be compared to determine areas of agreement as well as areas of divergence


