
Key Insights
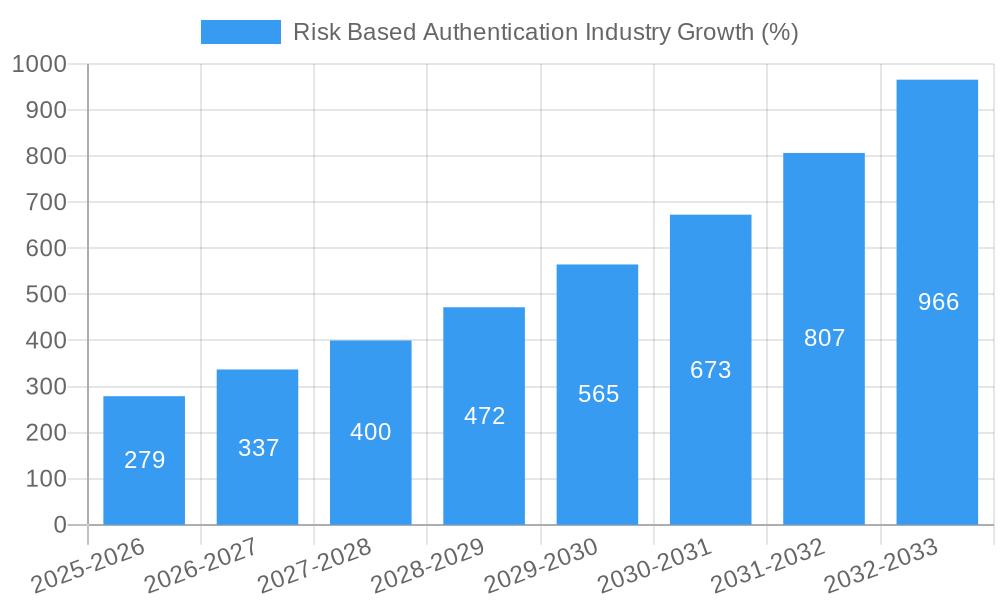
The Risk-Based Authentication (RBA) market is experiencing robust growth, projected to reach a substantial size by 2033. Driven by the escalating need for enhanced cybersecurity in a rapidly digitalizing world, the market is expanding at a Compound Annual Growth Rate (CAGR) of 18.80%. This growth is fueled by several factors, including the increasing prevalence of sophisticated cyber threats, stringent regulatory compliance mandates like GDPR and CCPA, and the rising adoption of cloud-based solutions. The BFSI sector remains a significant driver, followed by retail, IT and telecommunications, and healthcare, all demonstrating a growing need for sophisticated authentication methods that adapt to evolving user behaviors and risk profiles. The shift towards cloud deployment models further accelerates market expansion, offering scalability and cost-effectiveness for businesses. While the market faces challenges, such as the complexity of implementing and managing RBA systems and potential user friction with multi-factor authentication, these are being mitigated by innovative solutions focusing on user experience and seamless integration.
The competitive landscape is characterized by a mix of established players and emerging technology providers, reflecting the market's dynamism. Key players like HID Global, IBM, Thales, and Okta are investing heavily in research and development to enhance their product offerings and expand their market share. The market segmentation, across end-user verticals, offerings (solution and service), and deployment models (on-premise and cloud), provides diverse opportunities for specialized vendors to cater to specific niche requirements. Future growth will be largely determined by technological advancements such as behavioral biometrics and AI-powered risk assessments, alongside a growing awareness and adoption among smaller businesses and organizations. Overall, the RBA market presents a compelling investment opportunity with significant potential for growth in the coming years.

Risk Based Authentication Industry Market Report: 2019-2033
This comprehensive report provides a detailed analysis of the Risk Based Authentication (RBA) industry, offering invaluable insights for stakeholders seeking to understand market dynamics, competitive landscapes, and future growth potential. With a study period spanning 2019-2033, a base year of 2025, and a forecast period of 2025-2033, this report delivers crucial data for informed decision-making. The market is projected to reach xx Million by 2033, exhibiting a significant CAGR of xx% during the forecast period.
Risk Based Authentication Industry Market Structure & Competitive Dynamics
The Risk Based Authentication market is characterized by a moderately consolidated structure with several key players holding significant market share. The industry witnesses continuous innovation driven by advancements in artificial intelligence (AI), machine learning (ML), and behavioral biometrics. Regulatory frameworks, particularly concerning data privacy (like GDPR and CCPA), significantly influence market dynamics. Product substitutes, such as traditional password-based authentication, still exist but are progressively being replaced by RBA solutions due to enhanced security. End-user trends towards stronger security protocols and increasing cyber threats fuel market growth. Mergers and acquisitions (M&A) activity is prevalent, with deal values totaling xx Million in 2024 alone, consolidating market share and driving innovation. Key players' market share fluctuates; however, IBM, Okta, and RSA Security hold a substantial portion. The following are some notable M&A activities:
- Example 1: Acquisition of [Company A] by [Company B] in [Year] for xx Million. This significantly impacted [Market segment].
- Example 2: Strategic partnership between [Company C] and [Company D] to jointly develop a [Product/Service] in [Year]. This expanded market reach and enhanced technological capabilities.
Risk Based Authentication Industry Industry Trends & Insights
The Risk Based Authentication market is experiencing robust growth, driven primarily by the escalating need for robust cybersecurity solutions across diverse sectors. The rising frequency and sophistication of cyberattacks, coupled with stringent data privacy regulations, compel organizations to adopt advanced authentication methods. Technological disruptions, such as the increasing adoption of AI and ML in risk assessment algorithms, significantly enhance the accuracy and efficiency of RBA systems. Consumer preferences are shifting towards seamless and secure authentication experiences, which are driving the demand for frictionless RBA solutions that incorporate biometric authentication and contextual factors. Competitive dynamics are intense, with established players and new entrants vying for market share through product innovation, strategic partnerships, and acquisitions. The market penetration of RBA solutions is expanding steadily, particularly in sectors like BFSI and healthcare. The market shows a projected Compound Annual Growth Rate (CAGR) of xx% during the forecast period, indicating substantial growth.
Dominant Markets & Segments in Risk Based Authentication Industry
The Banking, Financial Services, and Insurance (BFSI) sector is currently the dominant end-user vertical in the Risk Based Authentication market, driven by stringent regulatory compliance requirements and the high value of financial data. Other prominent sectors include:
- Banking and Financial Services (BFSI): Driven by regulatory compliance (e.g., PSD2) and the high value of financial data. Key drivers include robust security needs and the substantial impact of fraud prevention.
- Retail: Growth driven by increasing online transactions and a need to protect customer data and reduce fraud.
- IT and Telecommunication: Driven by the need to secure sensitive data and protect against cyber threats.
- Government: Growth spurred by the need to secure critical infrastructure and sensitive governmental data.
- Healthcare: Driven by privacy regulations (HIPAA) and the protection of sensitive patient information.
- Other End-user Verticals: Shows moderate growth, encompassing diverse sectors with increasing digitalization.
By Offering: The "Solution" segment dominates, providing comprehensive RBA platforms and integrating various authentication methods. The "Service" segment comprises implementation, maintenance, and support services.
By Deployment: The "Cloud" segment demonstrates accelerated growth due to scalability, cost-effectiveness, and ease of management. The "On-premise" segment maintains a significant market share, particularly in organizations with stringent security requirements.
Risk Based Authentication Industry Product Innovations
Recent product innovations in the Risk Based Authentication industry focus on enhancing user experience, improving risk assessment accuracy, and integrating diverse authentication methods. This includes the adoption of behavioral biometrics, adaptive authentication, and seamless integration with existing security infrastructure. The development of AI and ML-driven risk assessment engines offers more efficient and accurate risk scoring. These innovations provide strong competitive advantages by offering better security, improved usability, and increased cost-effectiveness.
Report Segmentation & Scope
This report segments the Risk Based Authentication market comprehensively by End-user Vertical (Banking and Financial Services (BFSI), Retail, IT and Telecommunication, Government, Healthcare, Other End-user Verticals), Offering (Solution, Service), and Deployment (On-premise, Cloud). Each segment is thoroughly analyzed, presenting its market size, growth projections, and competitive dynamics. For example, the BFSI segment is projected to hold the largest market share in 2025, with xx Million, driven by stringent regulatory compliance and the need for robust fraud prevention.
Key Drivers of Risk Based Authentication Industry Growth
The Risk Based Authentication market's growth is propelled by several key factors: the increasing prevalence of cyberattacks, the growing adoption of cloud computing, stringent government regulations around data security, rising awareness of data breaches, and an increasing number of connected devices. The adoption of AI and ML technologies to enhance risk assessment also plays a significant role.
Challenges in the Risk Based Authentication Industry Sector
Challenges within the Risk Based Authentication sector include the high cost of implementation, the need for continuous updates to adapt to evolving threats, the complexity of integrating with existing systems, and ensuring interoperability across different platforms. Regulatory changes and evolving standards also present ongoing challenges. The potential for user frustration with complex authentication flows is another concern.
Leading Players in the Risk Based Authentication Industry Market
- HID Global Corporation (Assa Abloy AB)
- IBM Corporation
- Thales Group (Gemalto N V )
- SecureAuth Corporation
- Oracle Corporation
- Equifax Inc
- Financial Software Systems Inc
- Okta Inc
- RSA Security LLC
- Micro Focus International plc (NetIQ)
- Broadcom Inc (CA Technologies Inc )
Key Developments in Risk Based Authentication Industry Sector
- July 2021: RSA released the SecurID App 3.0, enhancing user experience and accessibility. This improved market competitiveness and user adoption.
- July 2021: Broadcom Inc. announced CA Adapter integration, enhancing SiteMinder's capabilities with CA Strong Authentication and CA Risk Authentication. This broadened the functionality of existing solutions and improved market penetration.
Strategic Risk Based Authentication Industry Market Outlook
The Risk Based Authentication market holds significant future potential, driven by the continuous evolution of cyber threats, the increasing adoption of digital technologies across various sectors, and the growing demand for robust security solutions. Strategic opportunities lie in developing innovative RBA solutions that leverage advanced technologies such as AI, ML, and biometrics, along with focusing on user experience and seamless integration with existing systems. The market is poised for continued expansion, particularly in emerging economies and sectors experiencing rapid digital transformation.
Risk Based Authentication Industry Segmentation
-
1. Offering
- 1.1. Solution
- 1.2. Service
-
2. Deployment
- 2.1. On-premise
- 2.2. Cloud
-
3. End-user Vertical
- 3.1. Banking and Financial Services (BFSI)
- 3.2. Retail
- 3.3. IT and Telecommunication
- 3.4. Government
- 3.5. Healthcare
- 3.6. Other End-user Verticals
Risk Based Authentication Industry Segmentation By Geography
- 1. North America
- 2. Europe
- 3. Asia Pacific
- 4. Latin America
- 5. Middle East and Africa

Risk Based Authentication Industry REPORT HIGHLIGHTS
| Aspects | Details |
|---|---|
| Study Period | 2019-2033 |
| Base Year | 2024 |
| Estimated Year | 2025 |
| Forecast Period | 2025-2033 |
| Historical Period | 2019-2024 |
| Growth Rate | CAGR of 18.80% from 2019-2033 |
| Segmentation |
|
Table of Contents
- 1. Introduction
- 1.1. Research Scope
- 1.2. Market Segmentation
- 1.3. Research Methodology
- 1.4. Definitions and Assumptions
- 2. Executive Summary
- 2.1. Introduction
- 3. Market Dynamics
- 3.1. Introduction
- 3.2. Market Drivers
- 3.2.1. Growing Data Breaches and Cyber Attacks across Key End-user Verticals; Adoption of BYOD Trends in Enterprises
- 3.3. Market Restrains
- 3.3.1. Growing Pressure to Update Risk Scores in line With Evolving Cyber-security Threats
- 3.4. Market Trends
- 3.4.1. Banking and Financial Services Hold the Major Share
- 4. Market Factor Analysis
- 4.1. Porters Five Forces
- 4.2. Supply/Value Chain
- 4.3. PESTEL analysis
- 4.4. Market Entropy
- 4.5. Patent/Trademark Analysis
- 5. Global Risk Based Authentication Industry Analysis, Insights and Forecast, 2019-2031
- 5.1. Market Analysis, Insights and Forecast - by Offering
- 5.1.1. Solution
- 5.1.2. Service
- 5.2. Market Analysis, Insights and Forecast - by Deployment
- 5.2.1. On-premise
- 5.2.2. Cloud
- 5.3. Market Analysis, Insights and Forecast - by End-user Vertical
- 5.3.1. Banking and Financial Services (BFSI)
- 5.3.2. Retail
- 5.3.3. IT and Telecommunication
- 5.3.4. Government
- 5.3.5. Healthcare
- 5.3.6. Other End-user Verticals
- 5.4. Market Analysis, Insights and Forecast - by Region
- 5.4.1. North America
- 5.4.2. Europe
- 5.4.3. Asia Pacific
- 5.4.4. Latin America
- 5.4.5. Middle East and Africa
- 5.1. Market Analysis, Insights and Forecast - by Offering
- 6. North America Risk Based Authentication Industry Analysis, Insights and Forecast, 2019-2031
- 6.1. Market Analysis, Insights and Forecast - by Offering
- 6.1.1. Solution
- 6.1.2. Service
- 6.2. Market Analysis, Insights and Forecast - by Deployment
- 6.2.1. On-premise
- 6.2.2. Cloud
- 6.3. Market Analysis, Insights and Forecast - by End-user Vertical
- 6.3.1. Banking and Financial Services (BFSI)
- 6.3.2. Retail
- 6.3.3. IT and Telecommunication
- 6.3.4. Government
- 6.3.5. Healthcare
- 6.3.6. Other End-user Verticals
- 6.1. Market Analysis, Insights and Forecast - by Offering
- 7. Europe Risk Based Authentication Industry Analysis, Insights and Forecast, 2019-2031
- 7.1. Market Analysis, Insights and Forecast - by Offering
- 7.1.1. Solution
- 7.1.2. Service
- 7.2. Market Analysis, Insights and Forecast - by Deployment
- 7.2.1. On-premise
- 7.2.2. Cloud
- 7.3. Market Analysis, Insights and Forecast - by End-user Vertical
- 7.3.1. Banking and Financial Services (BFSI)
- 7.3.2. Retail
- 7.3.3. IT and Telecommunication
- 7.3.4. Government
- 7.3.5. Healthcare
- 7.3.6. Other End-user Verticals
- 7.1. Market Analysis, Insights and Forecast - by Offering
- 8. Asia Pacific Risk Based Authentication Industry Analysis, Insights and Forecast, 2019-2031
- 8.1. Market Analysis, Insights and Forecast - by Offering
- 8.1.1. Solution
- 8.1.2. Service
- 8.2. Market Analysis, Insights and Forecast - by Deployment
- 8.2.1. On-premise
- 8.2.2. Cloud
- 8.3. Market Analysis, Insights and Forecast - by End-user Vertical
- 8.3.1. Banking and Financial Services (BFSI)
- 8.3.2. Retail
- 8.3.3. IT and Telecommunication
- 8.3.4. Government
- 8.3.5. Healthcare
- 8.3.6. Other End-user Verticals
- 8.1. Market Analysis, Insights and Forecast - by Offering
- 9. Latin America Risk Based Authentication Industry Analysis, Insights and Forecast, 2019-2031
- 9.1. Market Analysis, Insights and Forecast - by Offering
- 9.1.1. Solution
- 9.1.2. Service
- 9.2. Market Analysis, Insights and Forecast - by Deployment
- 9.2.1. On-premise
- 9.2.2. Cloud
- 9.3. Market Analysis, Insights and Forecast - by End-user Vertical
- 9.3.1. Banking and Financial Services (BFSI)
- 9.3.2. Retail
- 9.3.3. IT and Telecommunication
- 9.3.4. Government
- 9.3.5. Healthcare
- 9.3.6. Other End-user Verticals
- 9.1. Market Analysis, Insights and Forecast - by Offering
- 10. Middle East and Africa Risk Based Authentication Industry Analysis, Insights and Forecast, 2019-2031
- 10.1. Market Analysis, Insights and Forecast - by Offering
- 10.1.1. Solution
- 10.1.2. Service
- 10.2. Market Analysis, Insights and Forecast - by Deployment
- 10.2.1. On-premise
- 10.2.2. Cloud
- 10.3. Market Analysis, Insights and Forecast - by End-user Vertical
- 10.3.1. Banking and Financial Services (BFSI)
- 10.3.2. Retail
- 10.3.3. IT and Telecommunication
- 10.3.4. Government
- 10.3.5. Healthcare
- 10.3.6. Other End-user Verticals
- 10.1. Market Analysis, Insights and Forecast - by Offering
- 11. North America Risk Based Authentication Industry Analysis, Insights and Forecast, 2019-2031
- 11.1. Market Analysis, Insights and Forecast - By Country/Sub-region
- 11.1.1.
- 12. Europe Risk Based Authentication Industry Analysis, Insights and Forecast, 2019-2031
- 12.1. Market Analysis, Insights and Forecast - By Country/Sub-region
- 12.1.1.
- 13. Asia Pacific Risk Based Authentication Industry Analysis, Insights and Forecast, 2019-2031
- 13.1. Market Analysis, Insights and Forecast - By Country/Sub-region
- 13.1.1.
- 14. Latin America Risk Based Authentication Industry Analysis, Insights and Forecast, 2019-2031
- 14.1. Market Analysis, Insights and Forecast - By Country/Sub-region
- 14.1.1.
- 15. Middle East and Africa Risk Based Authentication Industry Analysis, Insights and Forecast, 2019-2031
- 15.1. Market Analysis, Insights and Forecast - By Country/Sub-region
- 15.1.1.
- 16. Competitive Analysis
- 16.1. Global Market Share Analysis 2024
- 16.2. Company Profiles
- 16.2.1 HID Global Corporation (Assa Abloy AB)
- 16.2.1.1. Overview
- 16.2.1.2. Products
- 16.2.1.3. SWOT Analysis
- 16.2.1.4. Recent Developments
- 16.2.1.5. Financials (Based on Availability)
- 16.2.2 IBM Corporation
- 16.2.2.1. Overview
- 16.2.2.2. Products
- 16.2.2.3. SWOT Analysis
- 16.2.2.4. Recent Developments
- 16.2.2.5. Financials (Based on Availability)
- 16.2.3 Thales Group (Gemalto N V )
- 16.2.3.1. Overview
- 16.2.3.2. Products
- 16.2.3.3. SWOT Analysis
- 16.2.3.4. Recent Developments
- 16.2.3.5. Financials (Based on Availability)
- 16.2.4 SecureAuth Corporation
- 16.2.4.1. Overview
- 16.2.4.2. Products
- 16.2.4.3. SWOT Analysis
- 16.2.4.4. Recent Developments
- 16.2.4.5. Financials (Based on Availability)
- 16.2.5 Oracle Corporation
- 16.2.5.1. Overview
- 16.2.5.2. Products
- 16.2.5.3. SWOT Analysis
- 16.2.5.4. Recent Developments
- 16.2.5.5. Financials (Based on Availability)
- 16.2.6 Equifax Inc
- 16.2.6.1. Overview
- 16.2.6.2. Products
- 16.2.6.3. SWOT Analysis
- 16.2.6.4. Recent Developments
- 16.2.6.5. Financials (Based on Availability)
- 16.2.7 Financial Software Systems Inc *List Not Exhaustive
- 16.2.7.1. Overview
- 16.2.7.2. Products
- 16.2.7.3. SWOT Analysis
- 16.2.7.4. Recent Developments
- 16.2.7.5. Financials (Based on Availability)
- 16.2.8 Okta Inc
- 16.2.8.1. Overview
- 16.2.8.2. Products
- 16.2.8.3. SWOT Analysis
- 16.2.8.4. Recent Developments
- 16.2.8.5. Financials (Based on Availability)
- 16.2.9 RSA Security LLC
- 16.2.9.1. Overview
- 16.2.9.2. Products
- 16.2.9.3. SWOT Analysis
- 16.2.9.4. Recent Developments
- 16.2.9.5. Financials (Based on Availability)
- 16.2.10 Micro Focus International plc (NetIQ)
- 16.2.10.1. Overview
- 16.2.10.2. Products
- 16.2.10.3. SWOT Analysis
- 16.2.10.4. Recent Developments
- 16.2.10.5. Financials (Based on Availability)
- 16.2.11 Broadcom Inc (CA Technologies Inc )
- 16.2.11.1. Overview
- 16.2.11.2. Products
- 16.2.11.3. SWOT Analysis
- 16.2.11.4. Recent Developments
- 16.2.11.5. Financials (Based on Availability)
- 16.2.1 HID Global Corporation (Assa Abloy AB)
List of Figures
- Figure 1: Global Risk Based Authentication Industry Revenue Breakdown (Million, %) by Region 2024 & 2032
- Figure 2: North America Risk Based Authentication Industry Revenue (Million), by Country 2024 & 2032
- Figure 3: North America Risk Based Authentication Industry Revenue Share (%), by Country 2024 & 2032
- Figure 4: Europe Risk Based Authentication Industry Revenue (Million), by Country 2024 & 2032
- Figure 5: Europe Risk Based Authentication Industry Revenue Share (%), by Country 2024 & 2032
- Figure 6: Asia Pacific Risk Based Authentication Industry Revenue (Million), by Country 2024 & 2032
- Figure 7: Asia Pacific Risk Based Authentication Industry Revenue Share (%), by Country 2024 & 2032
- Figure 8: Latin America Risk Based Authentication Industry Revenue (Million), by Country 2024 & 2032
- Figure 9: Latin America Risk Based Authentication Industry Revenue Share (%), by Country 2024 & 2032
- Figure 10: Middle East and Africa Risk Based Authentication Industry Revenue (Million), by Country 2024 & 2032
- Figure 11: Middle East and Africa Risk Based Authentication Industry Revenue Share (%), by Country 2024 & 2032
- Figure 12: North America Risk Based Authentication Industry Revenue (Million), by Offering 2024 & 2032
- Figure 13: North America Risk Based Authentication Industry Revenue Share (%), by Offering 2024 & 2032
- Figure 14: North America Risk Based Authentication Industry Revenue (Million), by Deployment 2024 & 2032
- Figure 15: North America Risk Based Authentication Industry Revenue Share (%), by Deployment 2024 & 2032
- Figure 16: North America Risk Based Authentication Industry Revenue (Million), by End-user Vertical 2024 & 2032
- Figure 17: North America Risk Based Authentication Industry Revenue Share (%), by End-user Vertical 2024 & 2032
- Figure 18: North America Risk Based Authentication Industry Revenue (Million), by Country 2024 & 2032
- Figure 19: North America Risk Based Authentication Industry Revenue Share (%), by Country 2024 & 2032
- Figure 20: Europe Risk Based Authentication Industry Revenue (Million), by Offering 2024 & 2032
- Figure 21: Europe Risk Based Authentication Industry Revenue Share (%), by Offering 2024 & 2032
- Figure 22: Europe Risk Based Authentication Industry Revenue (Million), by Deployment 2024 & 2032
- Figure 23: Europe Risk Based Authentication Industry Revenue Share (%), by Deployment 2024 & 2032
- Figure 24: Europe Risk Based Authentication Industry Revenue (Million), by End-user Vertical 2024 & 2032
- Figure 25: Europe Risk Based Authentication Industry Revenue Share (%), by End-user Vertical 2024 & 2032
- Figure 26: Europe Risk Based Authentication Industry Revenue (Million), by Country 2024 & 2032
- Figure 27: Europe Risk Based Authentication Industry Revenue Share (%), by Country 2024 & 2032
- Figure 28: Asia Pacific Risk Based Authentication Industry Revenue (Million), by Offering 2024 & 2032
- Figure 29: Asia Pacific Risk Based Authentication Industry Revenue Share (%), by Offering 2024 & 2032
- Figure 30: Asia Pacific Risk Based Authentication Industry Revenue (Million), by Deployment 2024 & 2032
- Figure 31: Asia Pacific Risk Based Authentication Industry Revenue Share (%), by Deployment 2024 & 2032
- Figure 32: Asia Pacific Risk Based Authentication Industry Revenue (Million), by End-user Vertical 2024 & 2032
- Figure 33: Asia Pacific Risk Based Authentication Industry Revenue Share (%), by End-user Vertical 2024 & 2032
- Figure 34: Asia Pacific Risk Based Authentication Industry Revenue (Million), by Country 2024 & 2032
- Figure 35: Asia Pacific Risk Based Authentication Industry Revenue Share (%), by Country 2024 & 2032
- Figure 36: Latin America Risk Based Authentication Industry Revenue (Million), by Offering 2024 & 2032
- Figure 37: Latin America Risk Based Authentication Industry Revenue Share (%), by Offering 2024 & 2032
- Figure 38: Latin America Risk Based Authentication Industry Revenue (Million), by Deployment 2024 & 2032
- Figure 39: Latin America Risk Based Authentication Industry Revenue Share (%), by Deployment 2024 & 2032
- Figure 40: Latin America Risk Based Authentication Industry Revenue (Million), by End-user Vertical 2024 & 2032
- Figure 41: Latin America Risk Based Authentication Industry Revenue Share (%), by End-user Vertical 2024 & 2032
- Figure 42: Latin America Risk Based Authentication Industry Revenue (Million), by Country 2024 & 2032
- Figure 43: Latin America Risk Based Authentication Industry Revenue Share (%), by Country 2024 & 2032
- Figure 44: Middle East and Africa Risk Based Authentication Industry Revenue (Million), by Offering 2024 & 2032
- Figure 45: Middle East and Africa Risk Based Authentication Industry Revenue Share (%), by Offering 2024 & 2032
- Figure 46: Middle East and Africa Risk Based Authentication Industry Revenue (Million), by Deployment 2024 & 2032
- Figure 47: Middle East and Africa Risk Based Authentication Industry Revenue Share (%), by Deployment 2024 & 2032
- Figure 48: Middle East and Africa Risk Based Authentication Industry Revenue (Million), by End-user Vertical 2024 & 2032
- Figure 49: Middle East and Africa Risk Based Authentication Industry Revenue Share (%), by End-user Vertical 2024 & 2032
- Figure 50: Middle East and Africa Risk Based Authentication Industry Revenue (Million), by Country 2024 & 2032
- Figure 51: Middle East and Africa Risk Based Authentication Industry Revenue Share (%), by Country 2024 & 2032
List of Tables
- Table 1: Global Risk Based Authentication Industry Revenue Million Forecast, by Region 2019 & 2032
- Table 2: Global Risk Based Authentication Industry Revenue Million Forecast, by Offering 2019 & 2032
- Table 3: Global Risk Based Authentication Industry Revenue Million Forecast, by Deployment 2019 & 2032
- Table 4: Global Risk Based Authentication Industry Revenue Million Forecast, by End-user Vertical 2019 & 2032
- Table 5: Global Risk Based Authentication Industry Revenue Million Forecast, by Region 2019 & 2032
- Table 6: Global Risk Based Authentication Industry Revenue Million Forecast, by Country 2019 & 2032
- Table 7: Risk Based Authentication Industry Revenue (Million) Forecast, by Application 2019 & 2032
- Table 8: Global Risk Based Authentication Industry Revenue Million Forecast, by Country 2019 & 2032
- Table 9: Risk Based Authentication Industry Revenue (Million) Forecast, by Application 2019 & 2032
- Table 10: Global Risk Based Authentication Industry Revenue Million Forecast, by Country 2019 & 2032
- Table 11: Risk Based Authentication Industry Revenue (Million) Forecast, by Application 2019 & 2032
- Table 12: Global Risk Based Authentication Industry Revenue Million Forecast, by Country 2019 & 2032
- Table 13: Risk Based Authentication Industry Revenue (Million) Forecast, by Application 2019 & 2032
- Table 14: Global Risk Based Authentication Industry Revenue Million Forecast, by Country 2019 & 2032
- Table 15: Risk Based Authentication Industry Revenue (Million) Forecast, by Application 2019 & 2032
- Table 16: Global Risk Based Authentication Industry Revenue Million Forecast, by Offering 2019 & 2032
- Table 17: Global Risk Based Authentication Industry Revenue Million Forecast, by Deployment 2019 & 2032
- Table 18: Global Risk Based Authentication Industry Revenue Million Forecast, by End-user Vertical 2019 & 2032
- Table 19: Global Risk Based Authentication Industry Revenue Million Forecast, by Country 2019 & 2032
- Table 20: Global Risk Based Authentication Industry Revenue Million Forecast, by Offering 2019 & 2032
- Table 21: Global Risk Based Authentication Industry Revenue Million Forecast, by Deployment 2019 & 2032
- Table 22: Global Risk Based Authentication Industry Revenue Million Forecast, by End-user Vertical 2019 & 2032
- Table 23: Global Risk Based Authentication Industry Revenue Million Forecast, by Country 2019 & 2032
- Table 24: Global Risk Based Authentication Industry Revenue Million Forecast, by Offering 2019 & 2032
- Table 25: Global Risk Based Authentication Industry Revenue Million Forecast, by Deployment 2019 & 2032
- Table 26: Global Risk Based Authentication Industry Revenue Million Forecast, by End-user Vertical 2019 & 2032
- Table 27: Global Risk Based Authentication Industry Revenue Million Forecast, by Country 2019 & 2032
- Table 28: Global Risk Based Authentication Industry Revenue Million Forecast, by Offering 2019 & 2032
- Table 29: Global Risk Based Authentication Industry Revenue Million Forecast, by Deployment 2019 & 2032
- Table 30: Global Risk Based Authentication Industry Revenue Million Forecast, by End-user Vertical 2019 & 2032
- Table 31: Global Risk Based Authentication Industry Revenue Million Forecast, by Country 2019 & 2032
- Table 32: Global Risk Based Authentication Industry Revenue Million Forecast, by Offering 2019 & 2032
- Table 33: Global Risk Based Authentication Industry Revenue Million Forecast, by Deployment 2019 & 2032
- Table 34: Global Risk Based Authentication Industry Revenue Million Forecast, by End-user Vertical 2019 & 2032
- Table 35: Global Risk Based Authentication Industry Revenue Million Forecast, by Country 2019 & 2032
Frequently Asked Questions
1. What is the projected Compound Annual Growth Rate (CAGR) of the Risk Based Authentication Industry?
The projected CAGR is approximately 18.80%.
2. Which companies are prominent players in the Risk Based Authentication Industry?
Key companies in the market include HID Global Corporation (Assa Abloy AB), IBM Corporation, Thales Group (Gemalto N V ), SecureAuth Corporation, Oracle Corporation, Equifax Inc, Financial Software Systems Inc *List Not Exhaustive, Okta Inc, RSA Security LLC, Micro Focus International plc (NetIQ), Broadcom Inc (CA Technologies Inc ).
3. What are the main segments of the Risk Based Authentication Industry?
The market segments include Offering, Deployment, End-user Vertical.
4. Can you provide details about the market size?
The market size is estimated to be USD XX Million as of 2022.
5. What are some drivers contributing to market growth?
Growing Data Breaches and Cyber Attacks across Key End-user Verticals; Adoption of BYOD Trends in Enterprises.
6. What are the notable trends driving market growth?
Banking and Financial Services Hold the Major Share.
7. Are there any restraints impacting market growth?
Growing Pressure to Update Risk Scores in line With Evolving Cyber-security Threats.
8. Can you provide examples of recent developments in the market?
July 2021 - RSA released the SecurID App 3.0 to deliver a next-generation end-user experience for iOS and Android users with multiple software tokens into a single, easy-to-use SecurID App. The SecurID App also provides greater accessibility with voice-over and talk back for visually impaired users.
9. What pricing options are available for accessing the report?
Pricing options include single-user, multi-user, and enterprise licenses priced at USD 4750, USD 5250, and USD 8750 respectively.
10. Is the market size provided in terms of value or volume?
The market size is provided in terms of value, measured in Million.
11. Are there any specific market keywords associated with the report?
Yes, the market keyword associated with the report is "Risk Based Authentication Industry," which aids in identifying and referencing the specific market segment covered.
12. How do I determine which pricing option suits my needs best?
The pricing options vary based on user requirements and access needs. Individual users may opt for single-user licenses, while businesses requiring broader access may choose multi-user or enterprise licenses for cost-effective access to the report.
13. Are there any additional resources or data provided in the Risk Based Authentication Industry report?
While the report offers comprehensive insights, it's advisable to review the specific contents or supplementary materials provided to ascertain if additional resources or data are available.
14. How can I stay updated on further developments or reports in the Risk Based Authentication Industry?
To stay informed about further developments, trends, and reports in the Risk Based Authentication Industry, consider subscribing to industry newsletters, following relevant companies and organizations, or regularly checking reputable industry news sources and publications.
Methodology
Step 1 - Identification of Relevant Samples Size from Population Database


Step 2 - Approaches for Defining Global Market Size (Value, Volume* & Price*)

Note*: In applicable scenarios
Step 3 - Data Sources
Primary Research
- Web Analytics
- Survey Reports
- Research Institute
- Latest Research Reports
- Opinion Leaders
Secondary Research
- Annual Reports
- White Paper
- Latest Press Release
- Industry Association
- Paid Database
- Investor Presentations

Step 4 - Data Triangulation
Involves using different sources of information in order to increase the validity of a study
These sources are likely to be stakeholders in a program - participants, other researchers, program staff, other community members, and so on.
Then we put all data in single framework & apply various statistical tools to find out the dynamic on the market.
During the analysis stage, feedback from the stakeholder groups would be compared to determine areas of agreement as well as areas of divergence


