
Key Insights
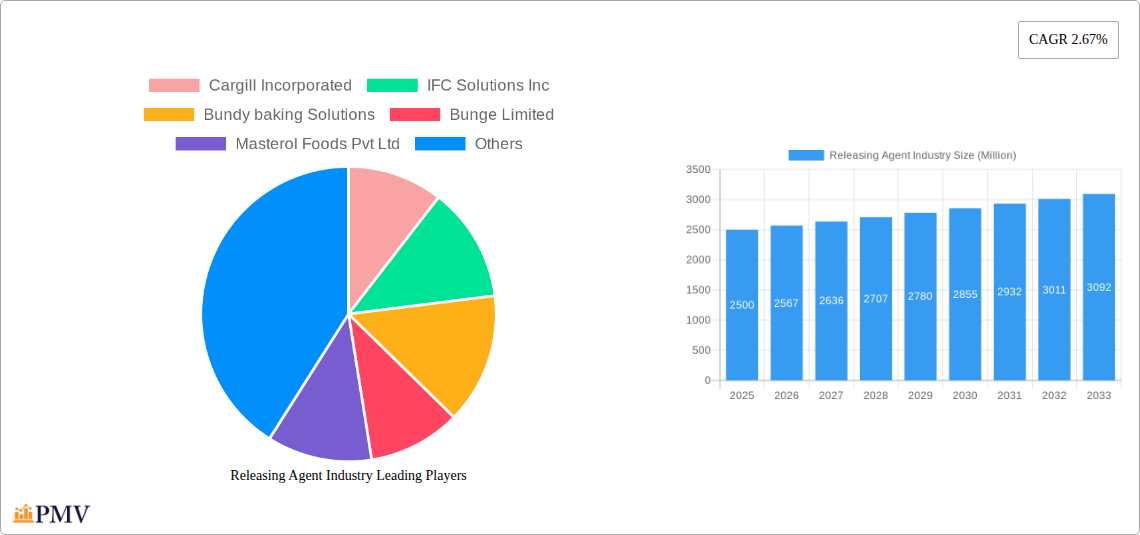
The global releasing agent market, valued at approximately $XX million in 2025, is projected to experience steady growth with a Compound Annual Growth Rate (CAGR) of 2.67% from 2025 to 2033. This growth is driven primarily by the increasing demand for bakery and confectionery products, coupled with the expansion of the meat and meat products industry. Consumers' preference for high-quality, visually appealing food products necessitates the use of effective releasing agents to prevent sticking and ensure consistent product quality. Furthermore, technological advancements in the food processing industry are leading to the development of more efficient and specialized releasing agents, further fueling market expansion. The market is segmented by application (bakery and confectionery, meat and meat products, other applications), form (liquid, solid), and composition (emulsifiers, antioxidants, vegetable oils, wax and wax esters, others). The bakery and confectionery segment currently holds a significant market share due to the high volume of baked goods produced globally. Key players like Cargill Incorporated, Bunge Limited, and Archer Daniels Midland Company dominate the market, leveraging their established distribution networks and technological expertise. However, the market faces some restraints, including fluctuating raw material prices and stringent regulatory requirements for food additives. The Asia-Pacific region is expected to witness significant growth, driven by rising disposable incomes and increasing urbanization, leading to higher consumption of processed foods.
The competitive landscape is characterized by the presence of both large multinational corporations and smaller specialized firms. Large players benefit from economies of scale and extensive R&D capabilities, while smaller companies focus on niche applications and customized solutions. Future growth will likely be influenced by factors such as the introduction of innovative releasing agents with enhanced performance characteristics, the growing preference for natural and organic ingredients, and the increasing focus on sustainability throughout the food supply chain. The continued expansion of the global food processing industry is expected to provide a robust foundation for the sustained growth of the releasing agent market in the coming years. Regional variations in consumption patterns and regulatory frameworks will continue to shape the market dynamics across different geographical regions.
Releasing Agent Industry: A Comprehensive Market Report (2019-2033)
This in-depth report provides a comprehensive analysis of the Releasing Agent industry, offering invaluable insights for businesses, investors, and industry stakeholders. Covering the period from 2019 to 2033, with a focus on 2025, this report meticulously examines market dynamics, competitive landscapes, and future growth potential. The study period encompasses historical data (2019-2024), a base year (2025), and a forecast period (2025-2033). The global market is projected to reach xx Million by 2033, demonstrating substantial growth opportunities.
Releasing Agent Industry Market Structure & Competitive Dynamics
The Releasing Agent industry exhibits a moderately concentrated market structure, with several key players commanding significant market share. Cargill Incorporated, Bunge Limited, Archer Daniels Midland Company, and Lallemand are among the leading players, collectively holding an estimated xx% market share in 2025. The industry's innovation ecosystem is dynamic, driven by ongoing R&D efforts focused on developing sustainable and high-performance releasing agents. Regulatory frameworks, particularly concerning food safety and environmental regulations, significantly impact industry operations. Product substitutes, such as silicone-based releasing agents, pose a competitive threat, although their market penetration remains limited due to cost and performance considerations. End-user trends towards healthier and more sustainable food products influence the demand for specific types of releasing agents. M&A activity has been moderate in recent years, with deal values averaging approximately xx Million per transaction. Notable acquisitions include (insert examples if available, otherwise state "no significant M&A activity reported").
Releasing Agent Industry Industry Trends & Insights
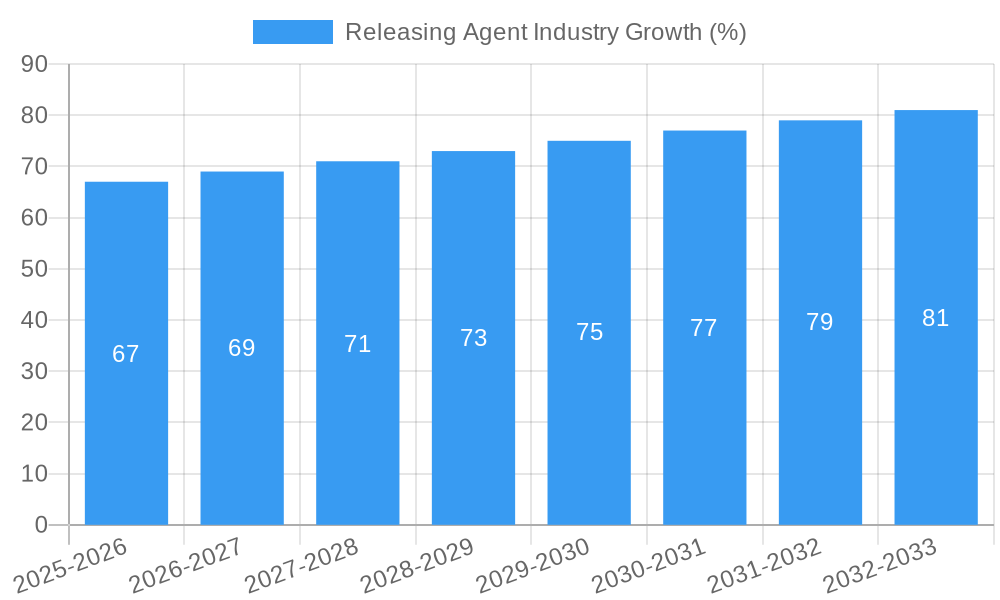
The Releasing Agent market is experiencing robust growth, driven by increasing demand from various end-use industries, particularly bakery and confectionery. The industry's CAGR from 2025 to 2033 is projected at xx%, fueled by several factors. Firstly, the expanding global population and rising disposable incomes in developing economies are boosting demand for processed foods, creating significant opportunities for releasing agents. Secondly, technological advancements in food processing technologies are driving the adoption of innovative releasing agents that enhance efficiency and product quality. Consumer preference for convenient and ready-to-eat food products further contributes to market growth. However, fluctuating raw material prices and environmental concerns pose challenges. Market penetration is highest in North America and Europe, but significant growth is anticipated in Asia-Pacific due to rapid industrialization and urbanization. Competitive dynamics are characterized by intense rivalry among existing players and the emergence of new entrants, particularly in developing regions.
Dominant Markets & Segments in Releasing Agent Industry
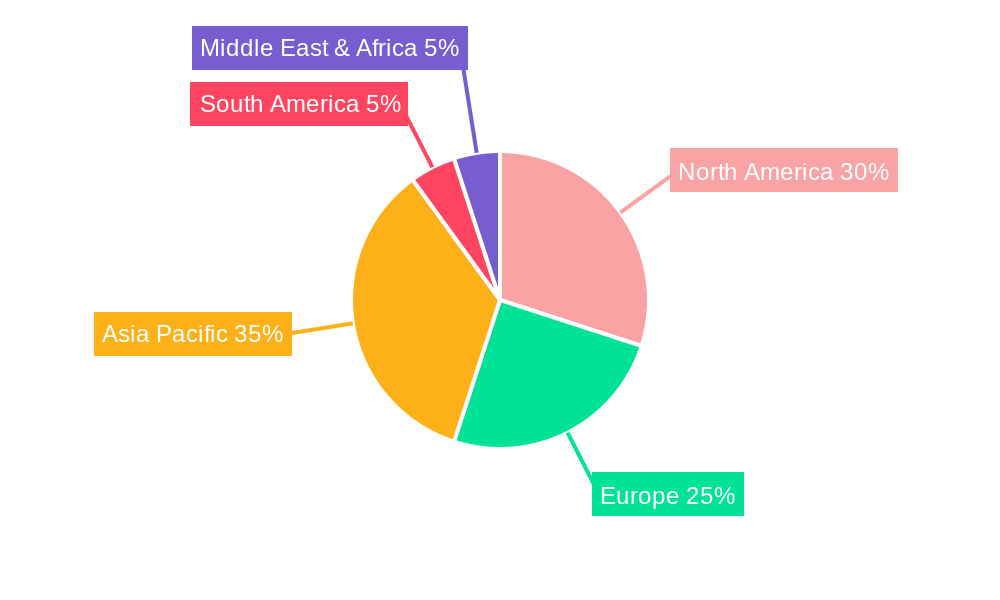
Leading Region: North America currently holds the largest market share, driven by a well-established food processing industry and high per capita consumption of processed foods. Key drivers include robust economic conditions, advanced infrastructure, and stringent food safety regulations, leading to higher adoption rates of high-quality releasing agents.
Dominant Application Segment: The Bakery and Confectionery segment dominates the market due to extensive usage in bread, cakes, biscuits, and chocolates. This segment’s growth is primarily driven by consumer preference for convenience and variety, along with increased investments in the bakery sector.
Leading Form Segment: Liquid releasing agents maintain a higher market share compared to solid forms, as they offer superior application ease and broader compatibility with various food processing equipment.
Leading Composition Segment: Emulsifiers and vegetable oils constitute significant portions of the market, owing to their superior emulsifying properties and cost-effectiveness compared to other compositions.
Europe follows North America with a substantial market share, driven by similar factors as mentioned earlier. The Asia-Pacific region is expected to witness the fastest growth rate in the forecast period.
Releasing Agent Industry Product Innovations
Recent innovations focus on developing bio-based and sustainable releasing agents to meet growing consumer demand for eco-friendly food products. These innovations also emphasize improved performance characteristics, such as enhanced release properties and reduced residue, to improve efficiency in food processing. Companies are investing heavily in research and development to create high-performance releasing agents that meet the specific needs of different food applications. The focus is on tailoring products for specific applications and offering solutions that enhance product quality and reduce costs.
Report Segmentation & Scope
The report provides a granular analysis of the Releasing Agent market across various segments:
By Application: Bakery and Confectionery, Meat and Meat Products, Other Applications (e.g., dairy, pharmaceuticals) Each segment's growth is analyzed based on specific market drivers, competitive intensity, and anticipated future growth.
By Form: Liquid and Solid. Growth projections for each form consider factors such as ease of application, cost, and suitability for specific processing methods.
By Composition: Emulsifiers, Antioxidants, Vegetable Oils, Wax and Wax Esters, Others. Analysis considers the performance characteristics, cost, and regulatory approvals of each composition. Competitive dynamics within each composition segment are explored in detail. Market size and growth projections are provided for each segment, reflecting the current and future market dynamics.
Key Drivers of Releasing Agent Industry Growth
The growth of the Releasing Agent industry is propelled by several key factors. The rising demand for processed foods globally, driven by increased urbanization and changing lifestyles, forms a crucial driver. Technological advancements in food processing are also significant, facilitating the adoption of improved releasing agents. Finally, stringent food safety regulations are driving the demand for high-quality, reliable releasing agents, further accelerating market growth.
Challenges in the Releasing Agent Industry Sector
The industry faces challenges such as the volatility of raw material prices, impacting production costs and profitability. Supply chain disruptions, particularly in the wake of global events, also pose risks. Intense competition among established players and the emergence of new entrants creates pressure on profit margins. Regulatory compliance and the evolving landscape of food safety standards present ongoing hurdles. The predicted impact of these challenges on market growth is estimated at a reduction of xx% by 2033 if not effectively mitigated.
Leading Players in the Releasing Agent Industry Market
- Cargill Incorporated
- IFC Solutions Inc
- Bundy Baking Solutions
- Bunge Limited
- Masterol Foods Pvt Ltd
- Archer Daniels Midland Company
- Lallemand
- The Bakels Group
- Mallet & Company Inc
- Avatar Corporation
- List Not Exhaustive
Key Developments in Releasing Agent Industry Sector
- [Month, Year]: [Company Name] launched a new line of bio-based releasing agents, expanding its product portfolio and targeting the growing demand for sustainable solutions. This launch significantly impacted market competition, driving innovation in the sector.
- [Month, Year]: [Company Name] acquired [Company Name], expanding its market reach and product offerings. This M&A activity contributed to market consolidation.
- (Add more bullet points as needed with specific dates and details)
Strategic Releasing Agent Industry Market Outlook
The Releasing Agent industry presents significant growth opportunities over the next decade. Continued innovation in sustainable and high-performance releasing agents, coupled with expanding demand from key end-use industries, will drive market growth. Strategic partnerships, acquisitions, and investments in R&D will be crucial for companies to maintain a competitive edge. Focus on regional expansion, especially into rapidly developing economies, will unlock significant market potential. The strategic outlook suggests a substantial increase in market value, contingent on addressing the challenges mentioned earlier.
Releasing Agent Industry Segmentation
-
1. Composition
- 1.1. Emulsifiers
- 1.2. Antioxidants
- 1.3. vegetable Oils
- 1.4. Wax and Wax Esters
- 1.5. Others
-
2. Application
- 2.1. Bakery and Confectionery
- 2.2. Meat and Meat Products
- 2.3. Other Applications
-
3. Form
- 3.1. Liquid
- 3.2. Solid
Releasing Agent Industry Segmentation By Geography
-
1. North America
- 1.1. United States
- 1.2. Canada
- 1.3. Mexico
- 1.4. Rest of North America
-
2. Europe
- 2.1. Germany
- 2.2. United Kingdom
- 2.3. France
- 2.4. Russia
- 2.5. Spain
- 2.6. Rest of Europe
-
3. Asia Pacific
- 3.1. India
- 3.2. China
- 3.3. Japan
- 3.4. Rest of Asia Pacific
-
4. South America
- 4.1. Brazil
- 4.2. Argentina
- 4.3. Rest of South America
- 5. Middle East
-
6. United Arab Emirates
- 6.1. South Africa
- 6.2. Rest of Middle East
Releasing Agent Industry REPORT HIGHLIGHTS
| Aspects | Details |
|---|---|
| Study Period | 2019-2033 |
| Base Year | 2024 |
| Estimated Year | 2025 |
| Forecast Period | 2025-2033 |
| Historical Period | 2019-2024 |
| Growth Rate | CAGR of 2.67% from 2019-2033 |
| Segmentation |
|
Table of Contents
- 1. Introduction
- 1.1. Research Scope
- 1.2. Market Segmentation
- 1.3. Research Methodology
- 1.4. Definitions and Assumptions
- 2. Executive Summary
- 2.1. Introduction
- 3. Market Dynamics
- 3.1. Introduction
- 3.2. Market Drivers
- 3.2.1. Increasing Demand for Organic Plant Proteins; Increasing Application of Pea Protein in Food and Beverages
- 3.3. Market Restrains
- 3.3.1. Presence of Alternative protein sources
- 3.4. Market Trends
- 3.4.1. Rising Food Consumption and Innovation in Packaged Foods
- 4. Market Factor Analysis
- 4.1. Porters Five Forces
- 4.2. Supply/Value Chain
- 4.3. PESTEL analysis
- 4.4. Market Entropy
- 4.5. Patent/Trademark Analysis
- 5. Global Releasing Agent Industry Analysis, Insights and Forecast, 2019-2031
- 5.1. Market Analysis, Insights and Forecast - by Composition
- 5.1.1. Emulsifiers
- 5.1.2. Antioxidants
- 5.1.3. vegetable Oils
- 5.1.4. Wax and Wax Esters
- 5.1.5. Others
- 5.2. Market Analysis, Insights and Forecast - by Application
- 5.2.1. Bakery and Confectionery
- 5.2.2. Meat and Meat Products
- 5.2.3. Other Applications
- 5.3. Market Analysis, Insights and Forecast - by Form
- 5.3.1. Liquid
- 5.3.2. Solid
- 5.4. Market Analysis, Insights and Forecast - by Region
- 5.4.1. North America
- 5.4.2. Europe
- 5.4.3. Asia Pacific
- 5.4.4. South America
- 5.4.5. Middle East
- 5.4.6. United Arab Emirates
- 5.1. Market Analysis, Insights and Forecast - by Composition
- 6. North America Releasing Agent Industry Analysis, Insights and Forecast, 2019-2031
- 6.1. Market Analysis, Insights and Forecast - by Composition
- 6.1.1. Emulsifiers
- 6.1.2. Antioxidants
- 6.1.3. vegetable Oils
- 6.1.4. Wax and Wax Esters
- 6.1.5. Others
- 6.2. Market Analysis, Insights and Forecast - by Application
- 6.2.1. Bakery and Confectionery
- 6.2.2. Meat and Meat Products
- 6.2.3. Other Applications
- 6.3. Market Analysis, Insights and Forecast - by Form
- 6.3.1. Liquid
- 6.3.2. Solid
- 6.1. Market Analysis, Insights and Forecast - by Composition
- 7. Europe Releasing Agent Industry Analysis, Insights and Forecast, 2019-2031
- 7.1. Market Analysis, Insights and Forecast - by Composition
- 7.1.1. Emulsifiers
- 7.1.2. Antioxidants
- 7.1.3. vegetable Oils
- 7.1.4. Wax and Wax Esters
- 7.1.5. Others
- 7.2. Market Analysis, Insights and Forecast - by Application
- 7.2.1. Bakery and Confectionery
- 7.2.2. Meat and Meat Products
- 7.2.3. Other Applications
- 7.3. Market Analysis, Insights and Forecast - by Form
- 7.3.1. Liquid
- 7.3.2. Solid
- 7.1. Market Analysis, Insights and Forecast - by Composition
- 8. Asia Pacific Releasing Agent Industry Analysis, Insights and Forecast, 2019-2031
- 8.1. Market Analysis, Insights and Forecast - by Composition
- 8.1.1. Emulsifiers
- 8.1.2. Antioxidants
- 8.1.3. vegetable Oils
- 8.1.4. Wax and Wax Esters
- 8.1.5. Others
- 8.2. Market Analysis, Insights and Forecast - by Application
- 8.2.1. Bakery and Confectionery
- 8.2.2. Meat and Meat Products
- 8.2.3. Other Applications
- 8.3. Market Analysis, Insights and Forecast - by Form
- 8.3.1. Liquid
- 8.3.2. Solid
- 8.1. Market Analysis, Insights and Forecast - by Composition
- 9. South America Releasing Agent Industry Analysis, Insights and Forecast, 2019-2031
- 9.1. Market Analysis, Insights and Forecast - by Composition
- 9.1.1. Emulsifiers
- 9.1.2. Antioxidants
- 9.1.3. vegetable Oils
- 9.1.4. Wax and Wax Esters
- 9.1.5. Others
- 9.2. Market Analysis, Insights and Forecast - by Application
- 9.2.1. Bakery and Confectionery
- 9.2.2. Meat and Meat Products
- 9.2.3. Other Applications
- 9.3. Market Analysis, Insights and Forecast - by Form
- 9.3.1. Liquid
- 9.3.2. Solid
- 9.1. Market Analysis, Insights and Forecast - by Composition
- 10. Middle East Releasing Agent Industry Analysis, Insights and Forecast, 2019-2031
- 10.1. Market Analysis, Insights and Forecast - by Composition
- 10.1.1. Emulsifiers
- 10.1.2. Antioxidants
- 10.1.3. vegetable Oils
- 10.1.4. Wax and Wax Esters
- 10.1.5. Others
- 10.2. Market Analysis, Insights and Forecast - by Application
- 10.2.1. Bakery and Confectionery
- 10.2.2. Meat and Meat Products
- 10.2.3. Other Applications
- 10.3. Market Analysis, Insights and Forecast - by Form
- 10.3.1. Liquid
- 10.3.2. Solid
- 10.1. Market Analysis, Insights and Forecast - by Composition
- 11. United Arab Emirates Releasing Agent Industry Analysis, Insights and Forecast, 2019-2031
- 11.1. Market Analysis, Insights and Forecast - by Composition
- 11.1.1. Emulsifiers
- 11.1.2. Antioxidants
- 11.1.3. vegetable Oils
- 11.1.4. Wax and Wax Esters
- 11.1.5. Others
- 11.2. Market Analysis, Insights and Forecast - by Application
- 11.2.1. Bakery and Confectionery
- 11.2.2. Meat and Meat Products
- 11.2.3. Other Applications
- 11.3. Market Analysis, Insights and Forecast - by Form
- 11.3.1. Liquid
- 11.3.2. Solid
- 11.1. Market Analysis, Insights and Forecast - by Composition
- 12. North America Releasing Agent Industry Analysis, Insights and Forecast, 2019-2031
- 12.1. Market Analysis, Insights and Forecast - By Country/Sub-region
- 12.1.1 United States
- 12.1.2 Canada
- 12.1.3 Mexico
- 12.1.4 Rest of North America
- 13. Europe Releasing Agent Industry Analysis, Insights and Forecast, 2019-2031
- 13.1. Market Analysis, Insights and Forecast - By Country/Sub-region
- 13.1.1 Germany
- 13.1.2 United Kingdom
- 13.1.3 France
- 13.1.4 Russia
- 13.1.5 Spain
- 13.1.6 Rest of Europe
- 14. Asia Pacific Releasing Agent Industry Analysis, Insights and Forecast, 2019-2031
- 14.1. Market Analysis, Insights and Forecast - By Country/Sub-region
- 14.1.1 India
- 14.1.2 China
- 14.1.3 Japan
- 14.1.4 Rest of Asia Pacific
- 15. South America Releasing Agent Industry Analysis, Insights and Forecast, 2019-2031
- 15.1. Market Analysis, Insights and Forecast - By Country/Sub-region
- 15.1.1 Brazil
- 15.1.2 Argentina
- 15.1.3 Rest of South America
- 16. Middle East Releasing Agent Industry Analysis, Insights and Forecast, 2019-2031
- 16.1. Market Analysis, Insights and Forecast - By Country/Sub-region
- 16.1.1 Middle East
- 16.1.2 Africa
- 17. United Arab Emirates Releasing Agent Industry Analysis, Insights and Forecast, 2019-2031
- 17.1. Market Analysis, Insights and Forecast - By Country/Sub-region
- 17.1.1 South Africa
- 17.1.2 Rest of Middle East
- 18. Competitive Analysis
- 18.1. Global Market Share Analysis 2024
- 18.2. Company Profiles
- 18.2.1 Cargill Incorporated
- 18.2.1.1. Overview
- 18.2.1.2. Products
- 18.2.1.3. SWOT Analysis
- 18.2.1.4. Recent Developments
- 18.2.1.5. Financials (Based on Availability)
- 18.2.2 IFC Solutions Inc
- 18.2.2.1. Overview
- 18.2.2.2. Products
- 18.2.2.3. SWOT Analysis
- 18.2.2.4. Recent Developments
- 18.2.2.5. Financials (Based on Availability)
- 18.2.3 Bundy baking Solutions
- 18.2.3.1. Overview
- 18.2.3.2. Products
- 18.2.3.3. SWOT Analysis
- 18.2.3.4. Recent Developments
- 18.2.3.5. Financials (Based on Availability)
- 18.2.4 Bunge Limited
- 18.2.4.1. Overview
- 18.2.4.2. Products
- 18.2.4.3. SWOT Analysis
- 18.2.4.4. Recent Developments
- 18.2.4.5. Financials (Based on Availability)
- 18.2.5 Masterol Foods Pvt Ltd
- 18.2.5.1. Overview
- 18.2.5.2. Products
- 18.2.5.3. SWOT Analysis
- 18.2.5.4. Recent Developments
- 18.2.5.5. Financials (Based on Availability)
- 18.2.6 Archer Danelis Midland Company
- 18.2.6.1. Overview
- 18.2.6.2. Products
- 18.2.6.3. SWOT Analysis
- 18.2.6.4. Recent Developments
- 18.2.6.5. Financials (Based on Availability)
- 18.2.7 Lallemand
- 18.2.7.1. Overview
- 18.2.7.2. Products
- 18.2.7.3. SWOT Analysis
- 18.2.7.4. Recent Developments
- 18.2.7.5. Financials (Based on Availability)
- 18.2.8 The Bakels Group
- 18.2.8.1. Overview
- 18.2.8.2. Products
- 18.2.8.3. SWOT Analysis
- 18.2.8.4. Recent Developments
- 18.2.8.5. Financials (Based on Availability)
- 18.2.9 Mallet & Company Inc
- 18.2.9.1. Overview
- 18.2.9.2. Products
- 18.2.9.3. SWOT Analysis
- 18.2.9.4. Recent Developments
- 18.2.9.5. Financials (Based on Availability)
- 18.2.10 Avatar Corporation*List Not Exhaustive
- 18.2.10.1. Overview
- 18.2.10.2. Products
- 18.2.10.3. SWOT Analysis
- 18.2.10.4. Recent Developments
- 18.2.10.5. Financials (Based on Availability)
- 18.2.1 Cargill Incorporated
List of Figures
- Figure 1: Global Releasing Agent Industry Revenue Breakdown (Million, %) by Region 2024 & 2032
- Figure 2: Global Releasing Agent Industry Volume Breakdown (K Tons, %) by Region 2024 & 2032
- Figure 3: North America Releasing Agent Industry Revenue (Million), by Country 2024 & 2032
- Figure 4: North America Releasing Agent Industry Volume (K Tons), by Country 2024 & 2032
- Figure 5: North America Releasing Agent Industry Revenue Share (%), by Country 2024 & 2032
- Figure 6: North America Releasing Agent Industry Volume Share (%), by Country 2024 & 2032
- Figure 7: Europe Releasing Agent Industry Revenue (Million), by Country 2024 & 2032
- Figure 8: Europe Releasing Agent Industry Volume (K Tons), by Country 2024 & 2032
- Figure 9: Europe Releasing Agent Industry Revenue Share (%), by Country 2024 & 2032
- Figure 10: Europe Releasing Agent Industry Volume Share (%), by Country 2024 & 2032
- Figure 11: Asia Pacific Releasing Agent Industry Revenue (Million), by Country 2024 & 2032
- Figure 12: Asia Pacific Releasing Agent Industry Volume (K Tons), by Country 2024 & 2032
- Figure 13: Asia Pacific Releasing Agent Industry Revenue Share (%), by Country 2024 & 2032
- Figure 14: Asia Pacific Releasing Agent Industry Volume Share (%), by Country 2024 & 2032
- Figure 15: South America Releasing Agent Industry Revenue (Million), by Country 2024 & 2032
- Figure 16: South America Releasing Agent Industry Volume (K Tons), by Country 2024 & 2032
- Figure 17: South America Releasing Agent Industry Revenue Share (%), by Country 2024 & 2032
- Figure 18: South America Releasing Agent Industry Volume Share (%), by Country 2024 & 2032
- Figure 19: Middle East Releasing Agent Industry Revenue (Million), by Country 2024 & 2032
- Figure 20: Middle East Releasing Agent Industry Volume (K Tons), by Country 2024 & 2032
- Figure 21: Middle East Releasing Agent Industry Revenue Share (%), by Country 2024 & 2032
- Figure 22: Middle East Releasing Agent Industry Volume Share (%), by Country 2024 & 2032
- Figure 23: United Arab Emirates Releasing Agent Industry Revenue (Million), by Country 2024 & 2032
- Figure 24: United Arab Emirates Releasing Agent Industry Volume (K Tons), by Country 2024 & 2032
- Figure 25: United Arab Emirates Releasing Agent Industry Revenue Share (%), by Country 2024 & 2032
- Figure 26: United Arab Emirates Releasing Agent Industry Volume Share (%), by Country 2024 & 2032
- Figure 27: North America Releasing Agent Industry Revenue (Million), by Composition 2024 & 2032
- Figure 28: North America Releasing Agent Industry Volume (K Tons), by Composition 2024 & 2032
- Figure 29: North America Releasing Agent Industry Revenue Share (%), by Composition 2024 & 2032
- Figure 30: North America Releasing Agent Industry Volume Share (%), by Composition 2024 & 2032
- Figure 31: North America Releasing Agent Industry Revenue (Million), by Application 2024 & 2032
- Figure 32: North America Releasing Agent Industry Volume (K Tons), by Application 2024 & 2032
- Figure 33: North America Releasing Agent Industry Revenue Share (%), by Application 2024 & 2032
- Figure 34: North America Releasing Agent Industry Volume Share (%), by Application 2024 & 2032
- Figure 35: North America Releasing Agent Industry Revenue (Million), by Form 2024 & 2032
- Figure 36: North America Releasing Agent Industry Volume (K Tons), by Form 2024 & 2032
- Figure 37: North America Releasing Agent Industry Revenue Share (%), by Form 2024 & 2032
- Figure 38: North America Releasing Agent Industry Volume Share (%), by Form 2024 & 2032
- Figure 39: North America Releasing Agent Industry Revenue (Million), by Country 2024 & 2032
- Figure 40: North America Releasing Agent Industry Volume (K Tons), by Country 2024 & 2032
- Figure 41: North America Releasing Agent Industry Revenue Share (%), by Country 2024 & 2032
- Figure 42: North America Releasing Agent Industry Volume Share (%), by Country 2024 & 2032
- Figure 43: Europe Releasing Agent Industry Revenue (Million), by Composition 2024 & 2032
- Figure 44: Europe Releasing Agent Industry Volume (K Tons), by Composition 2024 & 2032
- Figure 45: Europe Releasing Agent Industry Revenue Share (%), by Composition 2024 & 2032
- Figure 46: Europe Releasing Agent Industry Volume Share (%), by Composition 2024 & 2032
- Figure 47: Europe Releasing Agent Industry Revenue (Million), by Application 2024 & 2032
- Figure 48: Europe Releasing Agent Industry Volume (K Tons), by Application 2024 & 2032
- Figure 49: Europe Releasing Agent Industry Revenue Share (%), by Application 2024 & 2032
- Figure 50: Europe Releasing Agent Industry Volume Share (%), by Application 2024 & 2032
- Figure 51: Europe Releasing Agent Industry Revenue (Million), by Form 2024 & 2032
- Figure 52: Europe Releasing Agent Industry Volume (K Tons), by Form 2024 & 2032
- Figure 53: Europe Releasing Agent Industry Revenue Share (%), by Form 2024 & 2032
- Figure 54: Europe Releasing Agent Industry Volume Share (%), by Form 2024 & 2032
- Figure 55: Europe Releasing Agent Industry Revenue (Million), by Country 2024 & 2032
- Figure 56: Europe Releasing Agent Industry Volume (K Tons), by Country 2024 & 2032
- Figure 57: Europe Releasing Agent Industry Revenue Share (%), by Country 2024 & 2032
- Figure 58: Europe Releasing Agent Industry Volume Share (%), by Country 2024 & 2032
- Figure 59: Asia Pacific Releasing Agent Industry Revenue (Million), by Composition 2024 & 2032
- Figure 60: Asia Pacific Releasing Agent Industry Volume (K Tons), by Composition 2024 & 2032
- Figure 61: Asia Pacific Releasing Agent Industry Revenue Share (%), by Composition 2024 & 2032
- Figure 62: Asia Pacific Releasing Agent Industry Volume Share (%), by Composition 2024 & 2032
- Figure 63: Asia Pacific Releasing Agent Industry Revenue (Million), by Application 2024 & 2032
- Figure 64: Asia Pacific Releasing Agent Industry Volume (K Tons), by Application 2024 & 2032
- Figure 65: Asia Pacific Releasing Agent Industry Revenue Share (%), by Application 2024 & 2032
- Figure 66: Asia Pacific Releasing Agent Industry Volume Share (%), by Application 2024 & 2032
- Figure 67: Asia Pacific Releasing Agent Industry Revenue (Million), by Form 2024 & 2032
- Figure 68: Asia Pacific Releasing Agent Industry Volume (K Tons), by Form 2024 & 2032
- Figure 69: Asia Pacific Releasing Agent Industry Revenue Share (%), by Form 2024 & 2032
- Figure 70: Asia Pacific Releasing Agent Industry Volume Share (%), by Form 2024 & 2032
- Figure 71: Asia Pacific Releasing Agent Industry Revenue (Million), by Country 2024 & 2032
- Figure 72: Asia Pacific Releasing Agent Industry Volume (K Tons), by Country 2024 & 2032
- Figure 73: Asia Pacific Releasing Agent Industry Revenue Share (%), by Country 2024 & 2032
- Figure 74: Asia Pacific Releasing Agent Industry Volume Share (%), by Country 2024 & 2032
- Figure 75: South America Releasing Agent Industry Revenue (Million), by Composition 2024 & 2032
- Figure 76: South America Releasing Agent Industry Volume (K Tons), by Composition 2024 & 2032
- Figure 77: South America Releasing Agent Industry Revenue Share (%), by Composition 2024 & 2032
- Figure 78: South America Releasing Agent Industry Volume Share (%), by Composition 2024 & 2032
- Figure 79: South America Releasing Agent Industry Revenue (Million), by Application 2024 & 2032
- Figure 80: South America Releasing Agent Industry Volume (K Tons), by Application 2024 & 2032
- Figure 81: South America Releasing Agent Industry Revenue Share (%), by Application 2024 & 2032
- Figure 82: South America Releasing Agent Industry Volume Share (%), by Application 2024 & 2032
- Figure 83: South America Releasing Agent Industry Revenue (Million), by Form 2024 & 2032
- Figure 84: South America Releasing Agent Industry Volume (K Tons), by Form 2024 & 2032
- Figure 85: South America Releasing Agent Industry Revenue Share (%), by Form 2024 & 2032
- Figure 86: South America Releasing Agent Industry Volume Share (%), by Form 2024 & 2032
- Figure 87: South America Releasing Agent Industry Revenue (Million), by Country 2024 & 2032
- Figure 88: South America Releasing Agent Industry Volume (K Tons), by Country 2024 & 2032
- Figure 89: South America Releasing Agent Industry Revenue Share (%), by Country 2024 & 2032
- Figure 90: South America Releasing Agent Industry Volume Share (%), by Country 2024 & 2032
- Figure 91: Middle East Releasing Agent Industry Revenue (Million), by Composition 2024 & 2032
- Figure 92: Middle East Releasing Agent Industry Volume (K Tons), by Composition 2024 & 2032
- Figure 93: Middle East Releasing Agent Industry Revenue Share (%), by Composition 2024 & 2032
- Figure 94: Middle East Releasing Agent Industry Volume Share (%), by Composition 2024 & 2032
- Figure 95: Middle East Releasing Agent Industry Revenue (Million), by Application 2024 & 2032
- Figure 96: Middle East Releasing Agent Industry Volume (K Tons), by Application 2024 & 2032
- Figure 97: Middle East Releasing Agent Industry Revenue Share (%), by Application 2024 & 2032
- Figure 98: Middle East Releasing Agent Industry Volume Share (%), by Application 2024 & 2032
- Figure 99: Middle East Releasing Agent Industry Revenue (Million), by Form 2024 & 2032
- Figure 100: Middle East Releasing Agent Industry Volume (K Tons), by Form 2024 & 2032
- Figure 101: Middle East Releasing Agent Industry Revenue Share (%), by Form 2024 & 2032
- Figure 102: Middle East Releasing Agent Industry Volume Share (%), by Form 2024 & 2032
- Figure 103: Middle East Releasing Agent Industry Revenue (Million), by Country 2024 & 2032
- Figure 104: Middle East Releasing Agent Industry Volume (K Tons), by Country 2024 & 2032
- Figure 105: Middle East Releasing Agent Industry Revenue Share (%), by Country 2024 & 2032
- Figure 106: Middle East Releasing Agent Industry Volume Share (%), by Country 2024 & 2032
- Figure 107: United Arab Emirates Releasing Agent Industry Revenue (Million), by Composition 2024 & 2032
- Figure 108: United Arab Emirates Releasing Agent Industry Volume (K Tons), by Composition 2024 & 2032
- Figure 109: United Arab Emirates Releasing Agent Industry Revenue Share (%), by Composition 2024 & 2032
- Figure 110: United Arab Emirates Releasing Agent Industry Volume Share (%), by Composition 2024 & 2032
- Figure 111: United Arab Emirates Releasing Agent Industry Revenue (Million), by Application 2024 & 2032
- Figure 112: United Arab Emirates Releasing Agent Industry Volume (K Tons), by Application 2024 & 2032
- Figure 113: United Arab Emirates Releasing Agent Industry Revenue Share (%), by Application 2024 & 2032
- Figure 114: United Arab Emirates Releasing Agent Industry Volume Share (%), by Application 2024 & 2032
- Figure 115: United Arab Emirates Releasing Agent Industry Revenue (Million), by Form 2024 & 2032
- Figure 116: United Arab Emirates Releasing Agent Industry Volume (K Tons), by Form 2024 & 2032
- Figure 117: United Arab Emirates Releasing Agent Industry Revenue Share (%), by Form 2024 & 2032
- Figure 118: United Arab Emirates Releasing Agent Industry Volume Share (%), by Form 2024 & 2032
- Figure 119: United Arab Emirates Releasing Agent Industry Revenue (Million), by Country 2024 & 2032
- Figure 120: United Arab Emirates Releasing Agent Industry Volume (K Tons), by Country 2024 & 2032
- Figure 121: United Arab Emirates Releasing Agent Industry Revenue Share (%), by Country 2024 & 2032
- Figure 122: United Arab Emirates Releasing Agent Industry Volume Share (%), by Country 2024 & 2032
List of Tables
- Table 1: Global Releasing Agent Industry Revenue Million Forecast, by Region 2019 & 2032
- Table 2: Global Releasing Agent Industry Volume K Tons Forecast, by Region 2019 & 2032
- Table 3: Global Releasing Agent Industry Revenue Million Forecast, by Composition 2019 & 2032
- Table 4: Global Releasing Agent Industry Volume K Tons Forecast, by Composition 2019 & 2032
- Table 5: Global Releasing Agent Industry Revenue Million Forecast, by Application 2019 & 2032
- Table 6: Global Releasing Agent Industry Volume K Tons Forecast, by Application 2019 & 2032
- Table 7: Global Releasing Agent Industry Revenue Million Forecast, by Form 2019 & 2032
- Table 8: Global Releasing Agent Industry Volume K Tons Forecast, by Form 2019 & 2032
- Table 9: Global Releasing Agent Industry Revenue Million Forecast, by Region 2019 & 2032
- Table 10: Global Releasing Agent Industry Volume K Tons Forecast, by Region 2019 & 2032
- Table 11: Global Releasing Agent Industry Revenue Million Forecast, by Country 2019 & 2032
- Table 12: Global Releasing Agent Industry Volume K Tons Forecast, by Country 2019 & 2032
- Table 13: United States Releasing Agent Industry Revenue (Million) Forecast, by Application 2019 & 2032
- Table 14: United States Releasing Agent Industry Volume (K Tons) Forecast, by Application 2019 & 2032
- Table 15: Canada Releasing Agent Industry Revenue (Million) Forecast, by Application 2019 & 2032
- Table 16: Canada Releasing Agent Industry Volume (K Tons) Forecast, by Application 2019 & 2032
- Table 17: Mexico Releasing Agent Industry Revenue (Million) Forecast, by Application 2019 & 2032
- Table 18: Mexico Releasing Agent Industry Volume (K Tons) Forecast, by Application 2019 & 2032
- Table 19: Rest of North America Releasing Agent Industry Revenue (Million) Forecast, by Application 2019 & 2032
- Table 20: Rest of North America Releasing Agent Industry Volume (K Tons) Forecast, by Application 2019 & 2032
- Table 21: Global Releasing Agent Industry Revenue Million Forecast, by Country 2019 & 2032
- Table 22: Global Releasing Agent Industry Volume K Tons Forecast, by Country 2019 & 2032
- Table 23: Germany Releasing Agent Industry Revenue (Million) Forecast, by Application 2019 & 2032
- Table 24: Germany Releasing Agent Industry Volume (K Tons) Forecast, by Application 2019 & 2032
- Table 25: United Kingdom Releasing Agent Industry Revenue (Million) Forecast, by Application 2019 & 2032
- Table 26: United Kingdom Releasing Agent Industry Volume (K Tons) Forecast, by Application 2019 & 2032
- Table 27: France Releasing Agent Industry Revenue (Million) Forecast, by Application 2019 & 2032
- Table 28: France Releasing Agent Industry Volume (K Tons) Forecast, by Application 2019 & 2032
- Table 29: Russia Releasing Agent Industry Revenue (Million) Forecast, by Application 2019 & 2032
- Table 30: Russia Releasing Agent Industry Volume (K Tons) Forecast, by Application 2019 & 2032
- Table 31: Spain Releasing Agent Industry Revenue (Million) Forecast, by Application 2019 & 2032
- Table 32: Spain Releasing Agent Industry Volume (K Tons) Forecast, by Application 2019 & 2032
- Table 33: Rest of Europe Releasing Agent Industry Revenue (Million) Forecast, by Application 2019 & 2032
- Table 34: Rest of Europe Releasing Agent Industry Volume (K Tons) Forecast, by Application 2019 & 2032
- Table 35: Global Releasing Agent Industry Revenue Million Forecast, by Country 2019 & 2032
- Table 36: Global Releasing Agent Industry Volume K Tons Forecast, by Country 2019 & 2032
- Table 37: India Releasing Agent Industry Revenue (Million) Forecast, by Application 2019 & 2032
- Table 38: India Releasing Agent Industry Volume (K Tons) Forecast, by Application 2019 & 2032
- Table 39: China Releasing Agent Industry Revenue (Million) Forecast, by Application 2019 & 2032
- Table 40: China Releasing Agent Industry Volume (K Tons) Forecast, by Application 2019 & 2032
- Table 41: Japan Releasing Agent Industry Revenue (Million) Forecast, by Application 2019 & 2032
- Table 42: Japan Releasing Agent Industry Volume (K Tons) Forecast, by Application 2019 & 2032
- Table 43: Rest of Asia Pacific Releasing Agent Industry Revenue (Million) Forecast, by Application 2019 & 2032
- Table 44: Rest of Asia Pacific Releasing Agent Industry Volume (K Tons) Forecast, by Application 2019 & 2032
- Table 45: Global Releasing Agent Industry Revenue Million Forecast, by Country 2019 & 2032
- Table 46: Global Releasing Agent Industry Volume K Tons Forecast, by Country 2019 & 2032
- Table 47: Brazil Releasing Agent Industry Revenue (Million) Forecast, by Application 2019 & 2032
- Table 48: Brazil Releasing Agent Industry Volume (K Tons) Forecast, by Application 2019 & 2032
- Table 49: Argentina Releasing Agent Industry Revenue (Million) Forecast, by Application 2019 & 2032
- Table 50: Argentina Releasing Agent Industry Volume (K Tons) Forecast, by Application 2019 & 2032
- Table 51: Rest of South America Releasing Agent Industry Revenue (Million) Forecast, by Application 2019 & 2032
- Table 52: Rest of South America Releasing Agent Industry Volume (K Tons) Forecast, by Application 2019 & 2032
- Table 53: Global Releasing Agent Industry Revenue Million Forecast, by Country 2019 & 2032
- Table 54: Global Releasing Agent Industry Volume K Tons Forecast, by Country 2019 & 2032
- Table 55: Middle East Releasing Agent Industry Revenue (Million) Forecast, by Application 2019 & 2032
- Table 56: Middle East Releasing Agent Industry Volume (K Tons) Forecast, by Application 2019 & 2032
- Table 57: Africa Releasing Agent Industry Revenue (Million) Forecast, by Application 2019 & 2032
- Table 58: Africa Releasing Agent Industry Volume (K Tons) Forecast, by Application 2019 & 2032
- Table 59: Global Releasing Agent Industry Revenue Million Forecast, by Country 2019 & 2032
- Table 60: Global Releasing Agent Industry Volume K Tons Forecast, by Country 2019 & 2032
- Table 61: South Africa Releasing Agent Industry Revenue (Million) Forecast, by Application 2019 & 2032
- Table 62: South Africa Releasing Agent Industry Volume (K Tons) Forecast, by Application 2019 & 2032
- Table 63: Rest of Middle East Releasing Agent Industry Revenue (Million) Forecast, by Application 2019 & 2032
- Table 64: Rest of Middle East Releasing Agent Industry Volume (K Tons) Forecast, by Application 2019 & 2032
- Table 65: Global Releasing Agent Industry Revenue Million Forecast, by Composition 2019 & 2032
- Table 66: Global Releasing Agent Industry Volume K Tons Forecast, by Composition 2019 & 2032
- Table 67: Global Releasing Agent Industry Revenue Million Forecast, by Application 2019 & 2032
- Table 68: Global Releasing Agent Industry Volume K Tons Forecast, by Application 2019 & 2032
- Table 69: Global Releasing Agent Industry Revenue Million Forecast, by Form 2019 & 2032
- Table 70: Global Releasing Agent Industry Volume K Tons Forecast, by Form 2019 & 2032
- Table 71: Global Releasing Agent Industry Revenue Million Forecast, by Country 2019 & 2032
- Table 72: Global Releasing Agent Industry Volume K Tons Forecast, by Country 2019 & 2032
- Table 73: United States Releasing Agent Industry Revenue (Million) Forecast, by Application 2019 & 2032
- Table 74: United States Releasing Agent Industry Volume (K Tons) Forecast, by Application 2019 & 2032
- Table 75: Canada Releasing Agent Industry Revenue (Million) Forecast, by Application 2019 & 2032
- Table 76: Canada Releasing Agent Industry Volume (K Tons) Forecast, by Application 2019 & 2032
- Table 77: Mexico Releasing Agent Industry Revenue (Million) Forecast, by Application 2019 & 2032
- Table 78: Mexico Releasing Agent Industry Volume (K Tons) Forecast, by Application 2019 & 2032
- Table 79: Rest of North America Releasing Agent Industry Revenue (Million) Forecast, by Application 2019 & 2032
- Table 80: Rest of North America Releasing Agent Industry Volume (K Tons) Forecast, by Application 2019 & 2032
- Table 81: Global Releasing Agent Industry Revenue Million Forecast, by Composition 2019 & 2032
- Table 82: Global Releasing Agent Industry Volume K Tons Forecast, by Composition 2019 & 2032
- Table 83: Global Releasing Agent Industry Revenue Million Forecast, by Application 2019 & 2032
- Table 84: Global Releasing Agent Industry Volume K Tons Forecast, by Application 2019 & 2032
- Table 85: Global Releasing Agent Industry Revenue Million Forecast, by Form 2019 & 2032
- Table 86: Global Releasing Agent Industry Volume K Tons Forecast, by Form 2019 & 2032
- Table 87: Global Releasing Agent Industry Revenue Million Forecast, by Country 2019 & 2032
- Table 88: Global Releasing Agent Industry Volume K Tons Forecast, by Country 2019 & 2032
- Table 89: Germany Releasing Agent Industry Revenue (Million) Forecast, by Application 2019 & 2032
- Table 90: Germany Releasing Agent Industry Volume (K Tons) Forecast, by Application 2019 & 2032
- Table 91: United Kingdom Releasing Agent Industry Revenue (Million) Forecast, by Application 2019 & 2032
- Table 92: United Kingdom Releasing Agent Industry Volume (K Tons) Forecast, by Application 2019 & 2032
- Table 93: France Releasing Agent Industry Revenue (Million) Forecast, by Application 2019 & 2032
- Table 94: France Releasing Agent Industry Volume (K Tons) Forecast, by Application 2019 & 2032
- Table 95: Russia Releasing Agent Industry Revenue (Million) Forecast, by Application 2019 & 2032
- Table 96: Russia Releasing Agent Industry Volume (K Tons) Forecast, by Application 2019 & 2032
- Table 97: Spain Releasing Agent Industry Revenue (Million) Forecast, by Application 2019 & 2032
- Table 98: Spain Releasing Agent Industry Volume (K Tons) Forecast, by Application 2019 & 2032
- Table 99: Rest of Europe Releasing Agent Industry Revenue (Million) Forecast, by Application 2019 & 2032
- Table 100: Rest of Europe Releasing Agent Industry Volume (K Tons) Forecast, by Application 2019 & 2032
- Table 101: Global Releasing Agent Industry Revenue Million Forecast, by Composition 2019 & 2032
- Table 102: Global Releasing Agent Industry Volume K Tons Forecast, by Composition 2019 & 2032
- Table 103: Global Releasing Agent Industry Revenue Million Forecast, by Application 2019 & 2032
- Table 104: Global Releasing Agent Industry Volume K Tons Forecast, by Application 2019 & 2032
- Table 105: Global Releasing Agent Industry Revenue Million Forecast, by Form 2019 & 2032
- Table 106: Global Releasing Agent Industry Volume K Tons Forecast, by Form 2019 & 2032
- Table 107: Global Releasing Agent Industry Revenue Million Forecast, by Country 2019 & 2032
- Table 108: Global Releasing Agent Industry Volume K Tons Forecast, by Country 2019 & 2032
- Table 109: India Releasing Agent Industry Revenue (Million) Forecast, by Application 2019 & 2032
- Table 110: India Releasing Agent Industry Volume (K Tons) Forecast, by Application 2019 & 2032
- Table 111: China Releasing Agent Industry Revenue (Million) Forecast, by Application 2019 & 2032
- Table 112: China Releasing Agent Industry Volume (K Tons) Forecast, by Application 2019 & 2032
- Table 113: Japan Releasing Agent Industry Revenue (Million) Forecast, by Application 2019 & 2032
- Table 114: Japan Releasing Agent Industry Volume (K Tons) Forecast, by Application 2019 & 2032
- Table 115: Rest of Asia Pacific Releasing Agent Industry Revenue (Million) Forecast, by Application 2019 & 2032
- Table 116: Rest of Asia Pacific Releasing Agent Industry Volume (K Tons) Forecast, by Application 2019 & 2032
- Table 117: Global Releasing Agent Industry Revenue Million Forecast, by Composition 2019 & 2032
- Table 118: Global Releasing Agent Industry Volume K Tons Forecast, by Composition 2019 & 2032
- Table 119: Global Releasing Agent Industry Revenue Million Forecast, by Application 2019 & 2032
- Table 120: Global Releasing Agent Industry Volume K Tons Forecast, by Application 2019 & 2032
- Table 121: Global Releasing Agent Industry Revenue Million Forecast, by Form 2019 & 2032
- Table 122: Global Releasing Agent Industry Volume K Tons Forecast, by Form 2019 & 2032
- Table 123: Global Releasing Agent Industry Revenue Million Forecast, by Country 2019 & 2032
- Table 124: Global Releasing Agent Industry Volume K Tons Forecast, by Country 2019 & 2032
- Table 125: Brazil Releasing Agent Industry Revenue (Million) Forecast, by Application 2019 & 2032
- Table 126: Brazil Releasing Agent Industry Volume (K Tons) Forecast, by Application 2019 & 2032
- Table 127: Argentina Releasing Agent Industry Revenue (Million) Forecast, by Application 2019 & 2032
- Table 128: Argentina Releasing Agent Industry Volume (K Tons) Forecast, by Application 2019 & 2032
- Table 129: Rest of South America Releasing Agent Industry Revenue (Million) Forecast, by Application 2019 & 2032
- Table 130: Rest of South America Releasing Agent Industry Volume (K Tons) Forecast, by Application 2019 & 2032
- Table 131: Global Releasing Agent Industry Revenue Million Forecast, by Composition 2019 & 2032
- Table 132: Global Releasing Agent Industry Volume K Tons Forecast, by Composition 2019 & 2032
- Table 133: Global Releasing Agent Industry Revenue Million Forecast, by Application 2019 & 2032
- Table 134: Global Releasing Agent Industry Volume K Tons Forecast, by Application 2019 & 2032
- Table 135: Global Releasing Agent Industry Revenue Million Forecast, by Form 2019 & 2032
- Table 136: Global Releasing Agent Industry Volume K Tons Forecast, by Form 2019 & 2032
- Table 137: Global Releasing Agent Industry Revenue Million Forecast, by Country 2019 & 2032
- Table 138: Global Releasing Agent Industry Volume K Tons Forecast, by Country 2019 & 2032
- Table 139: Global Releasing Agent Industry Revenue Million Forecast, by Composition 2019 & 2032
- Table 140: Global Releasing Agent Industry Volume K Tons Forecast, by Composition 2019 & 2032
- Table 141: Global Releasing Agent Industry Revenue Million Forecast, by Application 2019 & 2032
- Table 142: Global Releasing Agent Industry Volume K Tons Forecast, by Application 2019 & 2032
- Table 143: Global Releasing Agent Industry Revenue Million Forecast, by Form 2019 & 2032
- Table 144: Global Releasing Agent Industry Volume K Tons Forecast, by Form 2019 & 2032
- Table 145: Global Releasing Agent Industry Revenue Million Forecast, by Country 2019 & 2032
- Table 146: Global Releasing Agent Industry Volume K Tons Forecast, by Country 2019 & 2032
- Table 147: South Africa Releasing Agent Industry Revenue (Million) Forecast, by Application 2019 & 2032
- Table 148: South Africa Releasing Agent Industry Volume (K Tons) Forecast, by Application 2019 & 2032
- Table 149: Rest of Middle East Releasing Agent Industry Revenue (Million) Forecast, by Application 2019 & 2032
- Table 150: Rest of Middle East Releasing Agent Industry Volume (K Tons) Forecast, by Application 2019 & 2032
Frequently Asked Questions
1. What is the projected Compound Annual Growth Rate (CAGR) of the Releasing Agent Industry?
The projected CAGR is approximately 2.67%.
2. Which companies are prominent players in the Releasing Agent Industry?
Key companies in the market include Cargill Incorporated, IFC Solutions Inc, Bundy baking Solutions, Bunge Limited, Masterol Foods Pvt Ltd, Archer Danelis Midland Company, Lallemand, The Bakels Group, Mallet & Company Inc, Avatar Corporation*List Not Exhaustive.
3. What are the main segments of the Releasing Agent Industry?
The market segments include Composition, Application, Form.
4. Can you provide details about the market size?
The market size is estimated to be USD XX Million as of 2022.
5. What are some drivers contributing to market growth?
Increasing Demand for Organic Plant Proteins; Increasing Application of Pea Protein in Food and Beverages.
6. What are the notable trends driving market growth?
Rising Food Consumption and Innovation in Packaged Foods.
7. Are there any restraints impacting market growth?
Presence of Alternative protein sources.
8. Can you provide examples of recent developments in the market?
N/A
9. What pricing options are available for accessing the report?
Pricing options include single-user, multi-user, and enterprise licenses priced at USD 4750, USD 5250, and USD 8750 respectively.
10. Is the market size provided in terms of value or volume?
The market size is provided in terms of value, measured in Million and volume, measured in K Tons.
11. Are there any specific market keywords associated with the report?
Yes, the market keyword associated with the report is "Releasing Agent Industry," which aids in identifying and referencing the specific market segment covered.
12. How do I determine which pricing option suits my needs best?
The pricing options vary based on user requirements and access needs. Individual users may opt for single-user licenses, while businesses requiring broader access may choose multi-user or enterprise licenses for cost-effective access to the report.
13. Are there any additional resources or data provided in the Releasing Agent Industry report?
While the report offers comprehensive insights, it's advisable to review the specific contents or supplementary materials provided to ascertain if additional resources or data are available.
14. How can I stay updated on further developments or reports in the Releasing Agent Industry?
To stay informed about further developments, trends, and reports in the Releasing Agent Industry, consider subscribing to industry newsletters, following relevant companies and organizations, or regularly checking reputable industry news sources and publications.
Methodology
Step 1 - Identification of Relevant Samples Size from Population Database


Step 2 - Approaches for Defining Global Market Size (Value, Volume* & Price*)

Note*: In applicable scenarios
Step 3 - Data Sources
Primary Research
- Web Analytics
- Survey Reports
- Research Institute
- Latest Research Reports
- Opinion Leaders
Secondary Research
- Annual Reports
- White Paper
- Latest Press Release
- Industry Association
- Paid Database
- Investor Presentations

Step 4 - Data Triangulation
Involves using different sources of information in order to increase the validity of a study
These sources are likely to be stakeholders in a program - participants, other researchers, program staff, other community members, and so on.
Then we put all data in single framework & apply various statistical tools to find out the dynamic on the market.
During the analysis stage, feedback from the stakeholder groups would be compared to determine areas of agreement as well as areas of divergence


