Exploring Opportunities in Cereal Bars Market in South America Sector

Cereal Bars Market in South America by Production Analysis, by Consumption Analysis, by Import Market Analysis (Value & Volume), by Export Market Analysis (Value & Volume), by Price Trend Analysis, by North America (United States, Canada, Mexico), by South America (Brazil, Argentina, Rest of South America), by Europe (United Kingdom, Germany, France, Italy, Spain, Russia, Benelux, Nordics, Rest of Europe), by Middle East & Africa (Turkey, Israel, GCC, North Africa, South Africa, Rest of Middle East & Africa), by Asia Pacific (China, India, Japan, South Korea, ASEAN, Oceania, Rest of Asia Pacific) Forecast 2025-2033

Jul 22 2025
Base Year: 2024

210 Pages
Main Logo

Exploring Opportunities in Cereal Bars Market in South America Sector


Home
Industries
Food & Beverage
sponsor image
sponsor image
sponsor image
sponsor image

Tailored for you

  • In-depth Analysis Tailored to Specified Regions or Segments
  • Company Profiles Customized to User Preferences
  • Comprehensive Insights Focused on Specific Segments or Regions
  • Customized Evaluation of Competitive Landscape to Meet Your Needs
  • Tailored Customization to Address Other Specific Requirements
Ask for customization


Key Insights

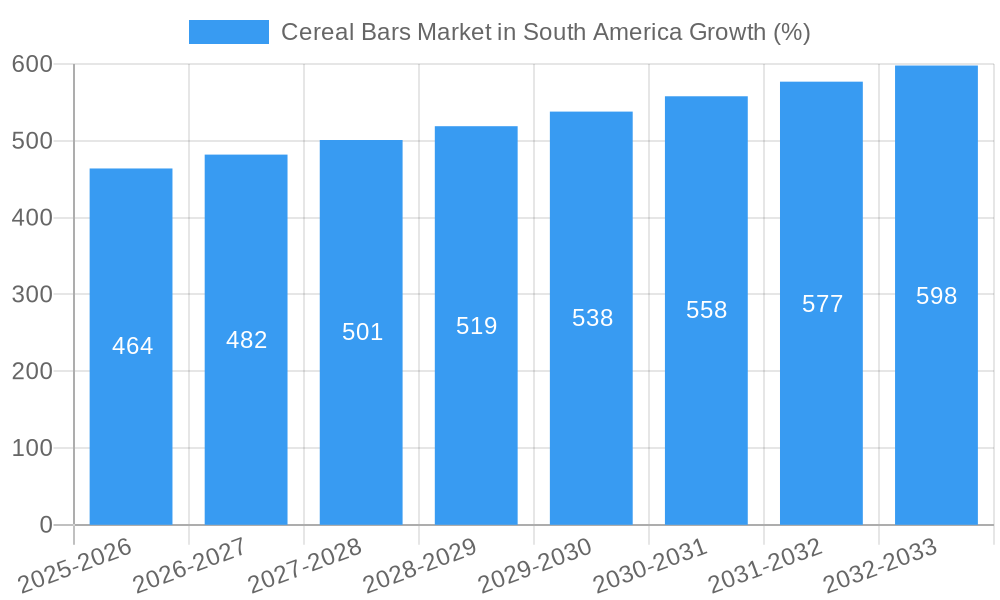
The South American cereal bars market, valued at $10,380 million in 2025, is projected to experience robust growth, driven by increasing health consciousness among consumers and the rising popularity of convenient, on-the-go snack options. The market's Compound Annual Growth Rate (CAGR) of 4.30% from 2025 to 2033 indicates a steady expansion, with granola and muesli bars leading the product type segment due to their perceived health benefits. Supermarkets and hypermarkets dominate the distribution channels, although online retail is exhibiting significant growth potential, particularly in urban areas with increasing internet penetration and e-commerce adoption. Key players like Kellogg's, Nestlé, General Mills, and PepsiCo are vying for market share through product innovation, strategic partnerships, and targeted marketing campaigns. Brazil and Argentina constitute the largest national markets within South America, reflecting their larger populations and higher disposable incomes. However, growth opportunities also exist in the "Rest of South America" segment as consumer preferences evolve and distribution networks expand. Challenges include price sensitivity in certain market segments and competition from traditional snack foods. The market's future growth will depend on factors such as sustained economic growth, increasing consumer awareness of healthy snacking options, and successful marketing strategies by key players to reach diverse consumer segments across South America.

The forecast period of 2025-2033 presents opportunities for market expansion through product diversification. Manufacturers are exploring innovative flavors, ingredients (e.g., organic, gluten-free), and packaging to cater to specific consumer preferences. Sustainability initiatives and ethical sourcing are also gaining traction, impacting consumer purchasing decisions. Furthermore, the rise of health and wellness trends, along with the increasing adoption of active lifestyles, fuels demand for nutritious and convenient snack options like cereal bars. The strategic expansion of distribution channels, particularly focusing on reaching rural areas and leveraging online platforms, presents lucrative opportunities for market players. Competitive pricing strategies and targeted marketing campaigns are also essential to sustain growth and capture market share within this dynamic South American landscape.

Cereal Bars Market in South America Research Report - Market Size, Growth & Forecast

Cereal Bars Market in South America: A Comprehensive Market Report (2019-2033)

This in-depth report provides a comprehensive analysis of the Cereal Bars Market in South America, covering market structure, competitive dynamics, industry trends, and future growth prospects. The study period spans from 2019 to 2033, with 2025 serving as the base and estimated year. The report utilizes data from the historical period (2019-2024) to forecast market trends from 2025 to 2033. The South American cereal bar market is a dynamic landscape influenced by evolving consumer preferences, technological advancements, and competitive strategies from key players like The Kellogg Company, Nestle S.A., General Mills Inc., PepsiCo Inc., Kind LLC, Clif Bar & Company, and Mondelez International Inc. This report offers actionable insights for businesses seeking to navigate this lucrative market.

Cereal Bars Market in South America Market Structure & Competitive Dynamics

The South American cereal bar market exhibits a moderately consolidated structure, with a few major multinational players holding significant market share. The Kellogg Company, Nestle S.A., and General Mills Inc. collectively control an estimated xx% of the market, while regional and smaller players compete for the remaining share. The market is characterized by intense competition, driven by product innovation, aggressive marketing strategies, and price wars. Innovation ecosystems are evolving, with increasing focus on healthier ingredients, functional benefits (e.g., protein bars, high-fiber bars), and sustainable packaging. Regulatory frameworks vary across South American countries, impacting ingredient labeling, health claims, and food safety standards. Product substitutes, such as energy bars, fruit snacks, and yogurt, pose a competitive threat. End-user trends show a growing preference for convenient, on-the-go snacks with high nutritional value. M&A activities in the region have been moderate, with deal values averaging around xx Million USD annually over the past five years. Key metrics include:

  • Market Concentration: xx% controlled by top 3 players.
  • Average M&A Deal Value: xx Million USD (2019-2024)
  • Number of M&A Deals: xx (2019-2024)

Cereal Bars Market in South America Industry Trends & Insights

The South American cereal bar market is experiencing robust growth, driven by several factors. Rising disposable incomes, particularly in urban areas, are fueling increased demand for convenient and nutritious snacks. Changing lifestyles and busy schedules are pushing consumers towards ready-to-eat options. The growing awareness of health and wellness is also contributing to the market expansion, with consumers increasingly seeking bars with high protein, fiber, and whole grains. Technological disruptions include advancements in food processing and packaging technologies, enabling the production of longer-shelf-life products with improved texture and taste. Consumer preferences are shifting towards healthier options, with a growing interest in organic, gluten-free, and vegan cereal bars. Competitive dynamics are characterized by continuous product innovation, strategic partnerships, and expansion into new markets. The CAGR for the South American cereal bar market is estimated to be xx% during the forecast period (2025-2033), with market penetration expected to reach xx% by 2033.

Cereal Bars Market in South America Growth

Dominant Markets & Segments in Cereal Bars Market in South America

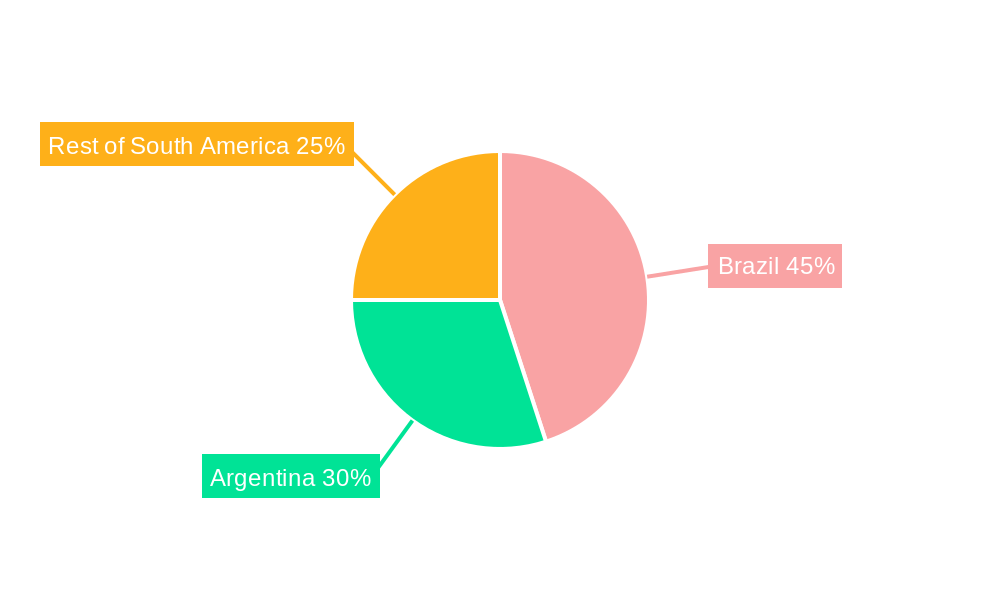
Brazil and Argentina represent the dominant markets within South America, accounting for approximately xx% of the total market value. Granola/Muesli bars are the leading product type, followed by other cereal bars such as fruit and nut bars. Supermarkets/hypermarkets constitute the largest distribution channel, driven by the widespread availability and established consumer preference for these retail formats.

  • Key Drivers in Brazil:

    • Large and growing population.
    • Strong middle class.
    • Rapid urbanization.
    • Favorable economic policies.
  • Key Drivers in Argentina:

    • High per capita consumption of snacks.
    • Developed retail infrastructure.
    • Increasing demand for health-conscious products.

Within the distribution channels, online retail stores are witnessing the fastest growth, driven by the increasing penetration of e-commerce and the convenience offered to consumers. This segment is expected to capture a significant market share in the forecast period.

Cereal Bars Market in South America Product Innovations

Recent product developments focus on enhancing nutritional profiles, incorporating functional ingredients (e.g., probiotics, adaptogens), and adopting sustainable packaging solutions. Manufacturers are responding to consumer demand for healthier and more convenient options by introducing innovative flavors, formats, and packaging sizes. Technological advancements in extrusion and co-extrusion techniques enable the creation of complex and customized bar formulations. These innovations aim to improve taste, texture, and nutritional value, while also enhancing the shelf-life and convenience of cereal bars.

Report Segmentation & Scope

This report segments the South American cereal bar market by product type (Granola/Muesli Bars, Other Cereal Bars) and distribution channel (Supermarkets/Hypermarkets, Convenience Stores, Online Retail Stores, Other Distribution Channels). Granola/Muesli bars are projected to experience a CAGR of xx% from 2025-2033 due to growing health consciousness. The "other cereal bars" segment shows a CAGR of xx%. In distribution, Supermarkets/Hypermarkets dominate, with a market share of xx% in 2025, while the online segment exhibits the highest growth potential, projected to reach xx% by 2033, fueled by e-commerce expansion. Competitive dynamics within each segment are influenced by factors such as pricing, product differentiation, and brand awareness.

Key Drivers of Cereal Bars Market in South America Growth

Several factors are driving the growth of the South American cereal bar market: rising disposable incomes leading to increased spending on convenient and healthy snacks; the growing popularity of health and wellness lifestyles; the increasing demand for on-the-go food options; advancements in product technology resulting in improved taste, texture, and shelf life; and supportive regulatory frameworks. These factors are creating a favorable environment for market expansion.

Challenges in the Cereal Bars Market in South America Sector

The South American cereal bar market faces challenges including fluctuating raw material prices, impacting production costs; the presence of strong competition from both local and international brands; potential regulatory changes affecting labeling and ingredient usage; and concerns regarding sugar content and other nutritional aspects in some cereal bars, leading to consumer preference shifts towards healthier alternatives. These factors necessitate robust strategies for market players to navigate the challenges successfully.

Leading Players in the Cereal Bars Market in South America Market

  • The Kellogg Company (Kellogg Company)
  • Nestle S.A. (Nestle)
  • General Mills Inc. (General Mills)
  • PepsiCo Inc. (PepsiCo)
  • Kind LLC
  • Clif Bar & Company
  • Mondelez International Inc. (Mondelez International)

Key Developments in Cereal Bars Market in South America Sector

  • June 2023: Nestle launches a new line of organic cereal bars in Brazil.
  • October 2022: Kellogg's expands its distribution network in Argentina.
  • March 2021: General Mills introduces a new range of protein-rich cereal bars in Colombia.
  • Further developments will be added to the full report.

Strategic Cereal Bars Market in South America Market Outlook

The South American cereal bar market holds significant growth potential, driven by expanding consumer bases, evolving preferences, and innovative product development. Strategic opportunities exist in focusing on health-conscious consumers, expanding online distribution channels, and capitalizing on the growing demand for organic and functional cereal bars. Companies that effectively address consumer needs for convenience, health, and value will be best positioned to capture market share and drive future growth.

Cereal Bars Market in South America Segmentation

  • 1. Production Analysis
  • 2. Consumption Analysis
  • 3. Import Market Analysis (Value & Volume)
  • 4. Export Market Analysis (Value & Volume)
  • 5. Price Trend Analysis

Cereal Bars Market in South America Segmentation By Geography

  • 1. North America
    • 1.1. United States
    • 1.2. Canada
    • 1.3. Mexico
  • 2. South America
    • 2.1. Brazil
    • 2.2. Argentina
    • 2.3. Rest of South America
  • 3. Europe
    • 3.1. United Kingdom
    • 3.2. Germany
    • 3.3. France
    • 3.4. Italy
    • 3.5. Spain
    • 3.6. Russia
    • 3.7. Benelux
    • 3.8. Nordics
    • 3.9. Rest of Europe
  • 4. Middle East & Africa
    • 4.1. Turkey
    • 4.2. Israel
    • 4.3. GCC
    • 4.4. North Africa
    • 4.5. South Africa
    • 4.6. Rest of Middle East & Africa
  • 5. Asia Pacific
    • 5.1. China
    • 5.2. India
    • 5.3. Japan
    • 5.4. South Korea
    • 5.5. ASEAN
    • 5.6. Oceania
    • 5.7. Rest of Asia Pacific
Cereal Bars Market in South America Regional Share


Cereal Bars Market in South America REPORT HIGHLIGHTS

AspectsDetails
Study Period 2019-2033
Base Year 2024
Estimated Year 2025
Forecast Period2025-2033
Historical Period2019-2024
Growth RateCAGR of 4.30% from 2019-2033
Segmentation
    • By Production Analysis
    • By Consumption Analysis
    • By Import Market Analysis (Value & Volume)
    • By Export Market Analysis (Value & Volume)
    • By Price Trend Analysis
  • By Geography
    • North America
      • United States
      • Canada
      • Mexico
    • South America
      • Brazil
      • Argentina
      • Rest of South America
    • Europe
      • United Kingdom
      • Germany
      • France
      • Italy
      • Spain
      • Russia
      • Benelux
      • Nordics
      • Rest of Europe
    • Middle East & Africa
      • Turkey
      • Israel
      • GCC
      • North Africa
      • South Africa
      • Rest of Middle East & Africa
    • Asia Pacific
      • China
      • India
      • Japan
      • South Korea
      • ASEAN
      • Oceania
      • Rest of Asia Pacific


Table of Contents

  1. 1. Introduction
    • 1.1. Research Scope
    • 1.2. Market Segmentation
    • 1.3. Research Methodology
    • 1.4. Definitions and Assumptions
  2. 2. Executive Summary
    • 2.1. Introduction
  3. 3. Market Dynamics
    • 3.1. Introduction
      • 3.2. Market Drivers
        • 3.2.1. Popularity of Convenient Food Products; Expansion of Cold Chain Logistics
      • 3.3. Market Restrains
        • 3.3.1. Concerns Over Food Safety and Quality
      • 3.4. Market Trends
        • 3.4.1. Surge In The Consumption Of Healthy Food
  4. 4. Market Factor Analysis
    • 4.1. Porters Five Forces
    • 4.2. Supply/Value Chain
    • 4.3. PESTEL analysis
    • 4.4. Market Entropy
    • 4.5. Patent/Trademark Analysis
  5. 5. Global Cereal Bars Market in South America Analysis, Insights and Forecast, 2019-2031
    • 5.1. Market Analysis, Insights and Forecast - by Production Analysis
      • 5.2. Market Analysis, Insights and Forecast - by Consumption Analysis
        • 5.3. Market Analysis, Insights and Forecast - by Import Market Analysis (Value & Volume)
          • 5.4. Market Analysis, Insights and Forecast - by Export Market Analysis (Value & Volume)
            • 5.5. Market Analysis, Insights and Forecast - by Price Trend Analysis
              • 5.6. Market Analysis, Insights and Forecast - by Region
                • 5.6.1. North America
                • 5.6.2. South America
                • 5.6.3. Europe
                • 5.6.4. Middle East & Africa
                • 5.6.5. Asia Pacific
            • 6. North America Cereal Bars Market in South America Analysis, Insights and Forecast, 2019-2031
              • 6.1. Market Analysis, Insights and Forecast - by Production Analysis
                • 6.2. Market Analysis, Insights and Forecast - by Consumption Analysis
                  • 6.3. Market Analysis, Insights and Forecast - by Import Market Analysis (Value & Volume)
                    • 6.4. Market Analysis, Insights and Forecast - by Export Market Analysis (Value & Volume)
                      • 6.5. Market Analysis, Insights and Forecast - by Price Trend Analysis
                      • 7. South America Cereal Bars Market in South America Analysis, Insights and Forecast, 2019-2031
                        • 7.1. Market Analysis, Insights and Forecast - by Production Analysis
                          • 7.2. Market Analysis, Insights and Forecast - by Consumption Analysis
                            • 7.3. Market Analysis, Insights and Forecast - by Import Market Analysis (Value & Volume)
                              • 7.4. Market Analysis, Insights and Forecast - by Export Market Analysis (Value & Volume)
                                • 7.5. Market Analysis, Insights and Forecast - by Price Trend Analysis
                                • 8. Europe Cereal Bars Market in South America Analysis, Insights and Forecast, 2019-2031
                                  • 8.1. Market Analysis, Insights and Forecast - by Production Analysis
                                    • 8.2. Market Analysis, Insights and Forecast - by Consumption Analysis
                                      • 8.3. Market Analysis, Insights and Forecast - by Import Market Analysis (Value & Volume)
                                        • 8.4. Market Analysis, Insights and Forecast - by Export Market Analysis (Value & Volume)
                                          • 8.5. Market Analysis, Insights and Forecast - by Price Trend Analysis
                                          • 9. Middle East & Africa Cereal Bars Market in South America Analysis, Insights and Forecast, 2019-2031
                                            • 9.1. Market Analysis, Insights and Forecast - by Production Analysis
                                              • 9.2. Market Analysis, Insights and Forecast - by Consumption Analysis
                                                • 9.3. Market Analysis, Insights and Forecast - by Import Market Analysis (Value & Volume)
                                                  • 9.4. Market Analysis, Insights and Forecast - by Export Market Analysis (Value & Volume)
                                                    • 9.5. Market Analysis, Insights and Forecast - by Price Trend Analysis
                                                    • 10. Asia Pacific Cereal Bars Market in South America Analysis, Insights and Forecast, 2019-2031
                                                      • 10.1. Market Analysis, Insights and Forecast - by Production Analysis
                                                        • 10.2. Market Analysis, Insights and Forecast - by Consumption Analysis
                                                          • 10.3. Market Analysis, Insights and Forecast - by Import Market Analysis (Value & Volume)
                                                            • 10.4. Market Analysis, Insights and Forecast - by Export Market Analysis (Value & Volume)
                                                              • 10.5. Market Analysis, Insights and Forecast - by Price Trend Analysis
                                                              • 11. Brazil Cereal Bars Market in South America Analysis, Insights and Forecast, 2019-2031
                                                                • 12. Argentina Cereal Bars Market in South America Analysis, Insights and Forecast, 2019-2031
                                                                  • 13. Rest of South America Cereal Bars Market in South America Analysis, Insights and Forecast, 2019-2031
                                                                    • 14. Competitive Analysis
                                                                      • 14.1. Global Market Share Analysis 2024
                                                                        • 14.2. Company Profiles
                                                                          • 14.2.1 The Kellogg Company
                                                                            • 14.2.1.1. Overview
                                                                            • 14.2.1.2. Products
                                                                            • 14.2.1.3. SWOT Analysis
                                                                            • 14.2.1.4. Recent Developments
                                                                            • 14.2.1.5. Financials (Based on Availability)
                                                                          • 14.2.2 Nestle S A
                                                                            • 14.2.2.1. Overview
                                                                            • 14.2.2.2. Products
                                                                            • 14.2.2.3. SWOT Analysis
                                                                            • 14.2.2.4. Recent Developments
                                                                            • 14.2.2.5. Financials (Based on Availability)
                                                                          • 14.2.3 General Mills Inc
                                                                            • 14.2.3.1. Overview
                                                                            • 14.2.3.2. Products
                                                                            • 14.2.3.3. SWOT Analysis
                                                                            • 14.2.3.4. Recent Developments
                                                                            • 14.2.3.5. Financials (Based on Availability)
                                                                          • 14.2.4 PepsiCo Inc
                                                                            • 14.2.4.1. Overview
                                                                            • 14.2.4.2. Products
                                                                            • 14.2.4.3. SWOT Analysis
                                                                            • 14.2.4.4. Recent Developments
                                                                            • 14.2.4.5. Financials (Based on Availability)
                                                                          • 14.2.5 Kind LLC*List Not Exhaustive
                                                                            • 14.2.5.1. Overview
                                                                            • 14.2.5.2. Products
                                                                            • 14.2.5.3. SWOT Analysis
                                                                            • 14.2.5.4. Recent Developments
                                                                            • 14.2.5.5. Financials (Based on Availability)
                                                                          • 14.2.6 Clif Bar & Company
                                                                            • 14.2.6.1. Overview
                                                                            • 14.2.6.2. Products
                                                                            • 14.2.6.3. SWOT Analysis
                                                                            • 14.2.6.4. Recent Developments
                                                                            • 14.2.6.5. Financials (Based on Availability)
                                                                          • 14.2.7 Mondelez International Inc
                                                                            • 14.2.7.1. Overview
                                                                            • 14.2.7.2. Products
                                                                            • 14.2.7.3. SWOT Analysis
                                                                            • 14.2.7.4. Recent Developments
                                                                            • 14.2.7.5. Financials (Based on Availability)

                                                                    List of Figures

                                                                    1. Figure 1: Global Cereal Bars Market in South America Revenue Breakdown (Million, %) by Region 2024 & 2032
                                                                    2. Figure 2: Global Cereal Bars Market in South America Volume Breakdown (K Units, %) by Region 2024 & 2032
                                                                    3. Figure 3: South America Cereal Bars Market in South America Revenue (Million), by Country 2024 & 2032
                                                                    4. Figure 4: South America Cereal Bars Market in South America Volume (K Units), by Country 2024 & 2032
                                                                    5. Figure 5: South America Cereal Bars Market in South America Revenue Share (%), by Country 2024 & 2032
                                                                    6. Figure 6: South America Cereal Bars Market in South America Volume Share (%), by Country 2024 & 2032
                                                                    7. Figure 7: North America Cereal Bars Market in South America Revenue (Million), by Production Analysis 2024 & 2032
                                                                    8. Figure 8: North America Cereal Bars Market in South America Volume (K Units), by Production Analysis 2024 & 2032
                                                                    9. Figure 9: North America Cereal Bars Market in South America Revenue Share (%), by Production Analysis 2024 & 2032
                                                                    10. Figure 10: North America Cereal Bars Market in South America Volume Share (%), by Production Analysis 2024 & 2032
                                                                    11. Figure 11: North America Cereal Bars Market in South America Revenue (Million), by Consumption Analysis 2024 & 2032
                                                                    12. Figure 12: North America Cereal Bars Market in South America Volume (K Units), by Consumption Analysis 2024 & 2032
                                                                    13. Figure 13: North America Cereal Bars Market in South America Revenue Share (%), by Consumption Analysis 2024 & 2032
                                                                    14. Figure 14: North America Cereal Bars Market in South America Volume Share (%), by Consumption Analysis 2024 & 2032
                                                                    15. Figure 15: North America Cereal Bars Market in South America Revenue (Million), by Import Market Analysis (Value & Volume) 2024 & 2032
                                                                    16. Figure 16: North America Cereal Bars Market in South America Volume (K Units), by Import Market Analysis (Value & Volume) 2024 & 2032
                                                                    17. Figure 17: North America Cereal Bars Market in South America Revenue Share (%), by Import Market Analysis (Value & Volume) 2024 & 2032
                                                                    18. Figure 18: North America Cereal Bars Market in South America Volume Share (%), by Import Market Analysis (Value & Volume) 2024 & 2032
                                                                    19. Figure 19: North America Cereal Bars Market in South America Revenue (Million), by Export Market Analysis (Value & Volume) 2024 & 2032
                                                                    20. Figure 20: North America Cereal Bars Market in South America Volume (K Units), by Export Market Analysis (Value & Volume) 2024 & 2032
                                                                    21. Figure 21: North America Cereal Bars Market in South America Revenue Share (%), by Export Market Analysis (Value & Volume) 2024 & 2032
                                                                    22. Figure 22: North America Cereal Bars Market in South America Volume Share (%), by Export Market Analysis (Value & Volume) 2024 & 2032
                                                                    23. Figure 23: North America Cereal Bars Market in South America Revenue (Million), by Price Trend Analysis 2024 & 2032
                                                                    24. Figure 24: North America Cereal Bars Market in South America Volume (K Units), by Price Trend Analysis 2024 & 2032
                                                                    25. Figure 25: North America Cereal Bars Market in South America Revenue Share (%), by Price Trend Analysis 2024 & 2032
                                                                    26. Figure 26: North America Cereal Bars Market in South America Volume Share (%), by Price Trend Analysis 2024 & 2032
                                                                    27. Figure 27: North America Cereal Bars Market in South America Revenue (Million), by Country 2024 & 2032
                                                                    28. Figure 28: North America Cereal Bars Market in South America Volume (K Units), by Country 2024 & 2032
                                                                    29. Figure 29: North America Cereal Bars Market in South America Revenue Share (%), by Country 2024 & 2032
                                                                    30. Figure 30: North America Cereal Bars Market in South America Volume Share (%), by Country 2024 & 2032
                                                                    31. Figure 31: South America Cereal Bars Market in South America Revenue (Million), by Production Analysis 2024 & 2032
                                                                    32. Figure 32: South America Cereal Bars Market in South America Volume (K Units), by Production Analysis 2024 & 2032
                                                                    33. Figure 33: South America Cereal Bars Market in South America Revenue Share (%), by Production Analysis 2024 & 2032
                                                                    34. Figure 34: South America Cereal Bars Market in South America Volume Share (%), by Production Analysis 2024 & 2032
                                                                    35. Figure 35: South America Cereal Bars Market in South America Revenue (Million), by Consumption Analysis 2024 & 2032
                                                                    36. Figure 36: South America Cereal Bars Market in South America Volume (K Units), by Consumption Analysis 2024 & 2032
                                                                    37. Figure 37: South America Cereal Bars Market in South America Revenue Share (%), by Consumption Analysis 2024 & 2032
                                                                    38. Figure 38: South America Cereal Bars Market in South America Volume Share (%), by Consumption Analysis 2024 & 2032
                                                                    39. Figure 39: South America Cereal Bars Market in South America Revenue (Million), by Import Market Analysis (Value & Volume) 2024 & 2032
                                                                    40. Figure 40: South America Cereal Bars Market in South America Volume (K Units), by Import Market Analysis (Value & Volume) 2024 & 2032
                                                                    41. Figure 41: South America Cereal Bars Market in South America Revenue Share (%), by Import Market Analysis (Value & Volume) 2024 & 2032
                                                                    42. Figure 42: South America Cereal Bars Market in South America Volume Share (%), by Import Market Analysis (Value & Volume) 2024 & 2032
                                                                    43. Figure 43: South America Cereal Bars Market in South America Revenue (Million), by Export Market Analysis (Value & Volume) 2024 & 2032
                                                                    44. Figure 44: South America Cereal Bars Market in South America Volume (K Units), by Export Market Analysis (Value & Volume) 2024 & 2032
                                                                    45. Figure 45: South America Cereal Bars Market in South America Revenue Share (%), by Export Market Analysis (Value & Volume) 2024 & 2032
                                                                    46. Figure 46: South America Cereal Bars Market in South America Volume Share (%), by Export Market Analysis (Value & Volume) 2024 & 2032
                                                                    47. Figure 47: South America Cereal Bars Market in South America Revenue (Million), by Price Trend Analysis 2024 & 2032
                                                                    48. Figure 48: South America Cereal Bars Market in South America Volume (K Units), by Price Trend Analysis 2024 & 2032
                                                                    49. Figure 49: South America Cereal Bars Market in South America Revenue Share (%), by Price Trend Analysis 2024 & 2032
                                                                    50. Figure 50: South America Cereal Bars Market in South America Volume Share (%), by Price Trend Analysis 2024 & 2032
                                                                    51. Figure 51: South America Cereal Bars Market in South America Revenue (Million), by Country 2024 & 2032
                                                                    52. Figure 52: South America Cereal Bars Market in South America Volume (K Units), by Country 2024 & 2032
                                                                    53. Figure 53: South America Cereal Bars Market in South America Revenue Share (%), by Country 2024 & 2032
                                                                    54. Figure 54: South America Cereal Bars Market in South America Volume Share (%), by Country 2024 & 2032
                                                                    55. Figure 55: Europe Cereal Bars Market in South America Revenue (Million), by Production Analysis 2024 & 2032
                                                                    56. Figure 56: Europe Cereal Bars Market in South America Volume (K Units), by Production Analysis 2024 & 2032
                                                                    57. Figure 57: Europe Cereal Bars Market in South America Revenue Share (%), by Production Analysis 2024 & 2032
                                                                    58. Figure 58: Europe Cereal Bars Market in South America Volume Share (%), by Production Analysis 2024 & 2032
                                                                    59. Figure 59: Europe Cereal Bars Market in South America Revenue (Million), by Consumption Analysis 2024 & 2032
                                                                    60. Figure 60: Europe Cereal Bars Market in South America Volume (K Units), by Consumption Analysis 2024 & 2032
                                                                    61. Figure 61: Europe Cereal Bars Market in South America Revenue Share (%), by Consumption Analysis 2024 & 2032
                                                                    62. Figure 62: Europe Cereal Bars Market in South America Volume Share (%), by Consumption Analysis 2024 & 2032
                                                                    63. Figure 63: Europe Cereal Bars Market in South America Revenue (Million), by Import Market Analysis (Value & Volume) 2024 & 2032
                                                                    64. Figure 64: Europe Cereal Bars Market in South America Volume (K Units), by Import Market Analysis (Value & Volume) 2024 & 2032
                                                                    65. Figure 65: Europe Cereal Bars Market in South America Revenue Share (%), by Import Market Analysis (Value & Volume) 2024 & 2032
                                                                    66. Figure 66: Europe Cereal Bars Market in South America Volume Share (%), by Import Market Analysis (Value & Volume) 2024 & 2032
                                                                    67. Figure 67: Europe Cereal Bars Market in South America Revenue (Million), by Export Market Analysis (Value & Volume) 2024 & 2032
                                                                    68. Figure 68: Europe Cereal Bars Market in South America Volume (K Units), by Export Market Analysis (Value & Volume) 2024 & 2032
                                                                    69. Figure 69: Europe Cereal Bars Market in South America Revenue Share (%), by Export Market Analysis (Value & Volume) 2024 & 2032
                                                                    70. Figure 70: Europe Cereal Bars Market in South America Volume Share (%), by Export Market Analysis (Value & Volume) 2024 & 2032
                                                                    71. Figure 71: Europe Cereal Bars Market in South America Revenue (Million), by Price Trend Analysis 2024 & 2032
                                                                    72. Figure 72: Europe Cereal Bars Market in South America Volume (K Units), by Price Trend Analysis 2024 & 2032
                                                                    73. Figure 73: Europe Cereal Bars Market in South America Revenue Share (%), by Price Trend Analysis 2024 & 2032
                                                                    74. Figure 74: Europe Cereal Bars Market in South America Volume Share (%), by Price Trend Analysis 2024 & 2032
                                                                    75. Figure 75: Europe Cereal Bars Market in South America Revenue (Million), by Country 2024 & 2032
                                                                    76. Figure 76: Europe Cereal Bars Market in South America Volume (K Units), by Country 2024 & 2032
                                                                    77. Figure 77: Europe Cereal Bars Market in South America Revenue Share (%), by Country 2024 & 2032
                                                                    78. Figure 78: Europe Cereal Bars Market in South America Volume Share (%), by Country 2024 & 2032
                                                                    79. Figure 79: Middle East & Africa Cereal Bars Market in South America Revenue (Million), by Production Analysis 2024 & 2032
                                                                    80. Figure 80: Middle East & Africa Cereal Bars Market in South America Volume (K Units), by Production Analysis 2024 & 2032
                                                                    81. Figure 81: Middle East & Africa Cereal Bars Market in South America Revenue Share (%), by Production Analysis 2024 & 2032
                                                                    82. Figure 82: Middle East & Africa Cereal Bars Market in South America Volume Share (%), by Production Analysis 2024 & 2032
                                                                    83. Figure 83: Middle East & Africa Cereal Bars Market in South America Revenue (Million), by Consumption Analysis 2024 & 2032
                                                                    84. Figure 84: Middle East & Africa Cereal Bars Market in South America Volume (K Units), by Consumption Analysis 2024 & 2032
                                                                    85. Figure 85: Middle East & Africa Cereal Bars Market in South America Revenue Share (%), by Consumption Analysis 2024 & 2032
                                                                    86. Figure 86: Middle East & Africa Cereal Bars Market in South America Volume Share (%), by Consumption Analysis 2024 & 2032
                                                                    87. Figure 87: Middle East & Africa Cereal Bars Market in South America Revenue (Million), by Import Market Analysis (Value & Volume) 2024 & 2032
                                                                    88. Figure 88: Middle East & Africa Cereal Bars Market in South America Volume (K Units), by Import Market Analysis (Value & Volume) 2024 & 2032
                                                                    89. Figure 89: Middle East & Africa Cereal Bars Market in South America Revenue Share (%), by Import Market Analysis (Value & Volume) 2024 & 2032
                                                                    90. Figure 90: Middle East & Africa Cereal Bars Market in South America Volume Share (%), by Import Market Analysis (Value & Volume) 2024 & 2032
                                                                    91. Figure 91: Middle East & Africa Cereal Bars Market in South America Revenue (Million), by Export Market Analysis (Value & Volume) 2024 & 2032
                                                                    92. Figure 92: Middle East & Africa Cereal Bars Market in South America Volume (K Units), by Export Market Analysis (Value & Volume) 2024 & 2032
                                                                    93. Figure 93: Middle East & Africa Cereal Bars Market in South America Revenue Share (%), by Export Market Analysis (Value & Volume) 2024 & 2032
                                                                    94. Figure 94: Middle East & Africa Cereal Bars Market in South America Volume Share (%), by Export Market Analysis (Value & Volume) 2024 & 2032
                                                                    95. Figure 95: Middle East & Africa Cereal Bars Market in South America Revenue (Million), by Price Trend Analysis 2024 & 2032
                                                                    96. Figure 96: Middle East & Africa Cereal Bars Market in South America Volume (K Units), by Price Trend Analysis 2024 & 2032
                                                                    97. Figure 97: Middle East & Africa Cereal Bars Market in South America Revenue Share (%), by Price Trend Analysis 2024 & 2032
                                                                    98. Figure 98: Middle East & Africa Cereal Bars Market in South America Volume Share (%), by Price Trend Analysis 2024 & 2032
                                                                    99. Figure 99: Middle East & Africa Cereal Bars Market in South America Revenue (Million), by Country 2024 & 2032
                                                                    100. Figure 100: Middle East & Africa Cereal Bars Market in South America Volume (K Units), by Country 2024 & 2032
                                                                    101. Figure 101: Middle East & Africa Cereal Bars Market in South America Revenue Share (%), by Country 2024 & 2032
                                                                    102. Figure 102: Middle East & Africa Cereal Bars Market in South America Volume Share (%), by Country 2024 & 2032
                                                                    103. Figure 103: Asia Pacific Cereal Bars Market in South America Revenue (Million), by Production Analysis 2024 & 2032
                                                                    104. Figure 104: Asia Pacific Cereal Bars Market in South America Volume (K Units), by Production Analysis 2024 & 2032
                                                                    105. Figure 105: Asia Pacific Cereal Bars Market in South America Revenue Share (%), by Production Analysis 2024 & 2032
                                                                    106. Figure 106: Asia Pacific Cereal Bars Market in South America Volume Share (%), by Production Analysis 2024 & 2032
                                                                    107. Figure 107: Asia Pacific Cereal Bars Market in South America Revenue (Million), by Consumption Analysis 2024 & 2032
                                                                    108. Figure 108: Asia Pacific Cereal Bars Market in South America Volume (K Units), by Consumption Analysis 2024 & 2032
                                                                    109. Figure 109: Asia Pacific Cereal Bars Market in South America Revenue Share (%), by Consumption Analysis 2024 & 2032
                                                                    110. Figure 110: Asia Pacific Cereal Bars Market in South America Volume Share (%), by Consumption Analysis 2024 & 2032
                                                                    111. Figure 111: Asia Pacific Cereal Bars Market in South America Revenue (Million), by Import Market Analysis (Value & Volume) 2024 & 2032
                                                                    112. Figure 112: Asia Pacific Cereal Bars Market in South America Volume (K Units), by Import Market Analysis (Value & Volume) 2024 & 2032
                                                                    113. Figure 113: Asia Pacific Cereal Bars Market in South America Revenue Share (%), by Import Market Analysis (Value & Volume) 2024 & 2032
                                                                    114. Figure 114: Asia Pacific Cereal Bars Market in South America Volume Share (%), by Import Market Analysis (Value & Volume) 2024 & 2032
                                                                    115. Figure 115: Asia Pacific Cereal Bars Market in South America Revenue (Million), by Export Market Analysis (Value & Volume) 2024 & 2032
                                                                    116. Figure 116: Asia Pacific Cereal Bars Market in South America Volume (K Units), by Export Market Analysis (Value & Volume) 2024 & 2032
                                                                    117. Figure 117: Asia Pacific Cereal Bars Market in South America Revenue Share (%), by Export Market Analysis (Value & Volume) 2024 & 2032
                                                                    118. Figure 118: Asia Pacific Cereal Bars Market in South America Volume Share (%), by Export Market Analysis (Value & Volume) 2024 & 2032
                                                                    119. Figure 119: Asia Pacific Cereal Bars Market in South America Revenue (Million), by Price Trend Analysis 2024 & 2032
                                                                    120. Figure 120: Asia Pacific Cereal Bars Market in South America Volume (K Units), by Price Trend Analysis 2024 & 2032
                                                                    121. Figure 121: Asia Pacific Cereal Bars Market in South America Revenue Share (%), by Price Trend Analysis 2024 & 2032
                                                                    122. Figure 122: Asia Pacific Cereal Bars Market in South America Volume Share (%), by Price Trend Analysis 2024 & 2032
                                                                    123. Figure 123: Asia Pacific Cereal Bars Market in South America Revenue (Million), by Country 2024 & 2032
                                                                    124. Figure 124: Asia Pacific Cereal Bars Market in South America Volume (K Units), by Country 2024 & 2032
                                                                    125. Figure 125: Asia Pacific Cereal Bars Market in South America Revenue Share (%), by Country 2024 & 2032
                                                                    126. Figure 126: Asia Pacific Cereal Bars Market in South America Volume Share (%), by Country 2024 & 2032

                                                                    List of Tables

                                                                    1. Table 1: Global Cereal Bars Market in South America Revenue Million Forecast, by Region 2019 & 2032
                                                                    2. Table 2: Global Cereal Bars Market in South America Volume K Units Forecast, by Region 2019 & 2032
                                                                    3. Table 3: Global Cereal Bars Market in South America Revenue Million Forecast, by Production Analysis 2019 & 2032
                                                                    4. Table 4: Global Cereal Bars Market in South America Volume K Units Forecast, by Production Analysis 2019 & 2032
                                                                    5. Table 5: Global Cereal Bars Market in South America Revenue Million Forecast, by Consumption Analysis 2019 & 2032
                                                                    6. Table 6: Global Cereal Bars Market in South America Volume K Units Forecast, by Consumption Analysis 2019 & 2032
                                                                    7. Table 7: Global Cereal Bars Market in South America Revenue Million Forecast, by Import Market Analysis (Value & Volume) 2019 & 2032
                                                                    8. Table 8: Global Cereal Bars Market in South America Volume K Units Forecast, by Import Market Analysis (Value & Volume) 2019 & 2032
                                                                    9. Table 9: Global Cereal Bars Market in South America Revenue Million Forecast, by Export Market Analysis (Value & Volume) 2019 & 2032
                                                                    10. Table 10: Global Cereal Bars Market in South America Volume K Units Forecast, by Export Market Analysis (Value & Volume) 2019 & 2032
                                                                    11. Table 11: Global Cereal Bars Market in South America Revenue Million Forecast, by Price Trend Analysis 2019 & 2032
                                                                    12. Table 12: Global Cereal Bars Market in South America Volume K Units Forecast, by Price Trend Analysis 2019 & 2032
                                                                    13. Table 13: Global Cereal Bars Market in South America Revenue Million Forecast, by Region 2019 & 2032
                                                                    14. Table 14: Global Cereal Bars Market in South America Volume K Units Forecast, by Region 2019 & 2032
                                                                    15. Table 15: Global Cereal Bars Market in South America Revenue Million Forecast, by Country 2019 & 2032
                                                                    16. Table 16: Global Cereal Bars Market in South America Volume K Units Forecast, by Country 2019 & 2032
                                                                    17. Table 17: Brazil Cereal Bars Market in South America Revenue (Million) Forecast, by Application 2019 & 2032
                                                                    18. Table 18: Brazil Cereal Bars Market in South America Volume (K Units) Forecast, by Application 2019 & 2032
                                                                    19. Table 19: Argentina Cereal Bars Market in South America Revenue (Million) Forecast, by Application 2019 & 2032
                                                                    20. Table 20: Argentina Cereal Bars Market in South America Volume (K Units) Forecast, by Application 2019 & 2032
                                                                    21. Table 21: Rest of South America Cereal Bars Market in South America Revenue (Million) Forecast, by Application 2019 & 2032
                                                                    22. Table 22: Rest of South America Cereal Bars Market in South America Volume (K Units) Forecast, by Application 2019 & 2032
                                                                    23. Table 23: Global Cereal Bars Market in South America Revenue Million Forecast, by Production Analysis 2019 & 2032
                                                                    24. Table 24: Global Cereal Bars Market in South America Volume K Units Forecast, by Production Analysis 2019 & 2032
                                                                    25. Table 25: Global Cereal Bars Market in South America Revenue Million Forecast, by Consumption Analysis 2019 & 2032
                                                                    26. Table 26: Global Cereal Bars Market in South America Volume K Units Forecast, by Consumption Analysis 2019 & 2032
                                                                    27. Table 27: Global Cereal Bars Market in South America Revenue Million Forecast, by Import Market Analysis (Value & Volume) 2019 & 2032
                                                                    28. Table 28: Global Cereal Bars Market in South America Volume K Units Forecast, by Import Market Analysis (Value & Volume) 2019 & 2032
                                                                    29. Table 29: Global Cereal Bars Market in South America Revenue Million Forecast, by Export Market Analysis (Value & Volume) 2019 & 2032
                                                                    30. Table 30: Global Cereal Bars Market in South America Volume K Units Forecast, by Export Market Analysis (Value & Volume) 2019 & 2032
                                                                    31. Table 31: Global Cereal Bars Market in South America Revenue Million Forecast, by Price Trend Analysis 2019 & 2032
                                                                    32. Table 32: Global Cereal Bars Market in South America Volume K Units Forecast, by Price Trend Analysis 2019 & 2032
                                                                    33. Table 33: Global Cereal Bars Market in South America Revenue Million Forecast, by Country 2019 & 2032
                                                                    34. Table 34: Global Cereal Bars Market in South America Volume K Units Forecast, by Country 2019 & 2032
                                                                    35. Table 35: United States Cereal Bars Market in South America Revenue (Million) Forecast, by Application 2019 & 2032
                                                                    36. Table 36: United States Cereal Bars Market in South America Volume (K Units) Forecast, by Application 2019 & 2032
                                                                    37. Table 37: Canada Cereal Bars Market in South America Revenue (Million) Forecast, by Application 2019 & 2032
                                                                    38. Table 38: Canada Cereal Bars Market in South America Volume (K Units) Forecast, by Application 2019 & 2032
                                                                    39. Table 39: Mexico Cereal Bars Market in South America Revenue (Million) Forecast, by Application 2019 & 2032
                                                                    40. Table 40: Mexico Cereal Bars Market in South America Volume (K Units) Forecast, by Application 2019 & 2032
                                                                    41. Table 41: Global Cereal Bars Market in South America Revenue Million Forecast, by Production Analysis 2019 & 2032
                                                                    42. Table 42: Global Cereal Bars Market in South America Volume K Units Forecast, by Production Analysis 2019 & 2032
                                                                    43. Table 43: Global Cereal Bars Market in South America Revenue Million Forecast, by Consumption Analysis 2019 & 2032
                                                                    44. Table 44: Global Cereal Bars Market in South America Volume K Units Forecast, by Consumption Analysis 2019 & 2032
                                                                    45. Table 45: Global Cereal Bars Market in South America Revenue Million Forecast, by Import Market Analysis (Value & Volume) 2019 & 2032
                                                                    46. Table 46: Global Cereal Bars Market in South America Volume K Units Forecast, by Import Market Analysis (Value & Volume) 2019 & 2032
                                                                    47. Table 47: Global Cereal Bars Market in South America Revenue Million Forecast, by Export Market Analysis (Value & Volume) 2019 & 2032
                                                                    48. Table 48: Global Cereal Bars Market in South America Volume K Units Forecast, by Export Market Analysis (Value & Volume) 2019 & 2032
                                                                    49. Table 49: Global Cereal Bars Market in South America Revenue Million Forecast, by Price Trend Analysis 2019 & 2032
                                                                    50. Table 50: Global Cereal Bars Market in South America Volume K Units Forecast, by Price Trend Analysis 2019 & 2032
                                                                    51. Table 51: Global Cereal Bars Market in South America Revenue Million Forecast, by Country 2019 & 2032
                                                                    52. Table 52: Global Cereal Bars Market in South America Volume K Units Forecast, by Country 2019 & 2032
                                                                    53. Table 53: Brazil Cereal Bars Market in South America Revenue (Million) Forecast, by Application 2019 & 2032
                                                                    54. Table 54: Brazil Cereal Bars Market in South America Volume (K Units) Forecast, by Application 2019 & 2032
                                                                    55. Table 55: Argentina Cereal Bars Market in South America Revenue (Million) Forecast, by Application 2019 & 2032
                                                                    56. Table 56: Argentina Cereal Bars Market in South America Volume (K Units) Forecast, by Application 2019 & 2032
                                                                    57. Table 57: Rest of South America Cereal Bars Market in South America Revenue (Million) Forecast, by Application 2019 & 2032
                                                                    58. Table 58: Rest of South America Cereal Bars Market in South America Volume (K Units) Forecast, by Application 2019 & 2032
                                                                    59. Table 59: Global Cereal Bars Market in South America Revenue Million Forecast, by Production Analysis 2019 & 2032
                                                                    60. Table 60: Global Cereal Bars Market in South America Volume K Units Forecast, by Production Analysis 2019 & 2032
                                                                    61. Table 61: Global Cereal Bars Market in South America Revenue Million Forecast, by Consumption Analysis 2019 & 2032
                                                                    62. Table 62: Global Cereal Bars Market in South America Volume K Units Forecast, by Consumption Analysis 2019 & 2032
                                                                    63. Table 63: Global Cereal Bars Market in South America Revenue Million Forecast, by Import Market Analysis (Value & Volume) 2019 & 2032
                                                                    64. Table 64: Global Cereal Bars Market in South America Volume K Units Forecast, by Import Market Analysis (Value & Volume) 2019 & 2032
                                                                    65. Table 65: Global Cereal Bars Market in South America Revenue Million Forecast, by Export Market Analysis (Value & Volume) 2019 & 2032
                                                                    66. Table 66: Global Cereal Bars Market in South America Volume K Units Forecast, by Export Market Analysis (Value & Volume) 2019 & 2032
                                                                    67. Table 67: Global Cereal Bars Market in South America Revenue Million Forecast, by Price Trend Analysis 2019 & 2032
                                                                    68. Table 68: Global Cereal Bars Market in South America Volume K Units Forecast, by Price Trend Analysis 2019 & 2032
                                                                    69. Table 69: Global Cereal Bars Market in South America Revenue Million Forecast, by Country 2019 & 2032
                                                                    70. Table 70: Global Cereal Bars Market in South America Volume K Units Forecast, by Country 2019 & 2032
                                                                    71. Table 71: United Kingdom Cereal Bars Market in South America Revenue (Million) Forecast, by Application 2019 & 2032
                                                                    72. Table 72: United Kingdom Cereal Bars Market in South America Volume (K Units) Forecast, by Application 2019 & 2032
                                                                    73. Table 73: Germany Cereal Bars Market in South America Revenue (Million) Forecast, by Application 2019 & 2032
                                                                    74. Table 74: Germany Cereal Bars Market in South America Volume (K Units) Forecast, by Application 2019 & 2032
                                                                    75. Table 75: France Cereal Bars Market in South America Revenue (Million) Forecast, by Application 2019 & 2032
                                                                    76. Table 76: France Cereal Bars Market in South America Volume (K Units) Forecast, by Application 2019 & 2032
                                                                    77. Table 77: Italy Cereal Bars Market in South America Revenue (Million) Forecast, by Application 2019 & 2032
                                                                    78. Table 78: Italy Cereal Bars Market in South America Volume (K Units) Forecast, by Application 2019 & 2032
                                                                    79. Table 79: Spain Cereal Bars Market in South America Revenue (Million) Forecast, by Application 2019 & 2032
                                                                    80. Table 80: Spain Cereal Bars Market in South America Volume (K Units) Forecast, by Application 2019 & 2032
                                                                    81. Table 81: Russia Cereal Bars Market in South America Revenue (Million) Forecast, by Application 2019 & 2032
                                                                    82. Table 82: Russia Cereal Bars Market in South America Volume (K Units) Forecast, by Application 2019 & 2032
                                                                    83. Table 83: Benelux Cereal Bars Market in South America Revenue (Million) Forecast, by Application 2019 & 2032
                                                                    84. Table 84: Benelux Cereal Bars Market in South America Volume (K Units) Forecast, by Application 2019 & 2032
                                                                    85. Table 85: Nordics Cereal Bars Market in South America Revenue (Million) Forecast, by Application 2019 & 2032
                                                                    86. Table 86: Nordics Cereal Bars Market in South America Volume (K Units) Forecast, by Application 2019 & 2032
                                                                    87. Table 87: Rest of Europe Cereal Bars Market in South America Revenue (Million) Forecast, by Application 2019 & 2032
                                                                    88. Table 88: Rest of Europe Cereal Bars Market in South America Volume (K Units) Forecast, by Application 2019 & 2032
                                                                    89. Table 89: Global Cereal Bars Market in South America Revenue Million Forecast, by Production Analysis 2019 & 2032
                                                                    90. Table 90: Global Cereal Bars Market in South America Volume K Units Forecast, by Production Analysis 2019 & 2032
                                                                    91. Table 91: Global Cereal Bars Market in South America Revenue Million Forecast, by Consumption Analysis 2019 & 2032
                                                                    92. Table 92: Global Cereal Bars Market in South America Volume K Units Forecast, by Consumption Analysis 2019 & 2032
                                                                    93. Table 93: Global Cereal Bars Market in South America Revenue Million Forecast, by Import Market Analysis (Value & Volume) 2019 & 2032
                                                                    94. Table 94: Global Cereal Bars Market in South America Volume K Units Forecast, by Import Market Analysis (Value & Volume) 2019 & 2032
                                                                    95. Table 95: Global Cereal Bars Market in South America Revenue Million Forecast, by Export Market Analysis (Value & Volume) 2019 & 2032
                                                                    96. Table 96: Global Cereal Bars Market in South America Volume K Units Forecast, by Export Market Analysis (Value & Volume) 2019 & 2032
                                                                    97. Table 97: Global Cereal Bars Market in South America Revenue Million Forecast, by Price Trend Analysis 2019 & 2032
                                                                    98. Table 98: Global Cereal Bars Market in South America Volume K Units Forecast, by Price Trend Analysis 2019 & 2032
                                                                    99. Table 99: Global Cereal Bars Market in South America Revenue Million Forecast, by Country 2019 & 2032
                                                                    100. Table 100: Global Cereal Bars Market in South America Volume K Units Forecast, by Country 2019 & 2032
                                                                    101. Table 101: Turkey Cereal Bars Market in South America Revenue (Million) Forecast, by Application 2019 & 2032
                                                                    102. Table 102: Turkey Cereal Bars Market in South America Volume (K Units) Forecast, by Application 2019 & 2032
                                                                    103. Table 103: Israel Cereal Bars Market in South America Revenue (Million) Forecast, by Application 2019 & 2032
                                                                    104. Table 104: Israel Cereal Bars Market in South America Volume (K Units) Forecast, by Application 2019 & 2032
                                                                    105. Table 105: GCC Cereal Bars Market in South America Revenue (Million) Forecast, by Application 2019 & 2032
                                                                    106. Table 106: GCC Cereal Bars Market in South America Volume (K Units) Forecast, by Application 2019 & 2032
                                                                    107. Table 107: North Africa Cereal Bars Market in South America Revenue (Million) Forecast, by Application 2019 & 2032
                                                                    108. Table 108: North Africa Cereal Bars Market in South America Volume (K Units) Forecast, by Application 2019 & 2032
                                                                    109. Table 109: South Africa Cereal Bars Market in South America Revenue (Million) Forecast, by Application 2019 & 2032
                                                                    110. Table 110: South Africa Cereal Bars Market in South America Volume (K Units) Forecast, by Application 2019 & 2032
                                                                    111. Table 111: Rest of Middle East & Africa Cereal Bars Market in South America Revenue (Million) Forecast, by Application 2019 & 2032
                                                                    112. Table 112: Rest of Middle East & Africa Cereal Bars Market in South America Volume (K Units) Forecast, by Application 2019 & 2032
                                                                    113. Table 113: Global Cereal Bars Market in South America Revenue Million Forecast, by Production Analysis 2019 & 2032
                                                                    114. Table 114: Global Cereal Bars Market in South America Volume K Units Forecast, by Production Analysis 2019 & 2032
                                                                    115. Table 115: Global Cereal Bars Market in South America Revenue Million Forecast, by Consumption Analysis 2019 & 2032
                                                                    116. Table 116: Global Cereal Bars Market in South America Volume K Units Forecast, by Consumption Analysis 2019 & 2032
                                                                    117. Table 117: Global Cereal Bars Market in South America Revenue Million Forecast, by Import Market Analysis (Value & Volume) 2019 & 2032
                                                                    118. Table 118: Global Cereal Bars Market in South America Volume K Units Forecast, by Import Market Analysis (Value & Volume) 2019 & 2032
                                                                    119. Table 119: Global Cereal Bars Market in South America Revenue Million Forecast, by Export Market Analysis (Value & Volume) 2019 & 2032
                                                                    120. Table 120: Global Cereal Bars Market in South America Volume K Units Forecast, by Export Market Analysis (Value & Volume) 2019 & 2032
                                                                    121. Table 121: Global Cereal Bars Market in South America Revenue Million Forecast, by Price Trend Analysis 2019 & 2032
                                                                    122. Table 122: Global Cereal Bars Market in South America Volume K Units Forecast, by Price Trend Analysis 2019 & 2032
                                                                    123. Table 123: Global Cereal Bars Market in South America Revenue Million Forecast, by Country 2019 & 2032
                                                                    124. Table 124: Global Cereal Bars Market in South America Volume K Units Forecast, by Country 2019 & 2032
                                                                    125. Table 125: China Cereal Bars Market in South America Revenue (Million) Forecast, by Application 2019 & 2032
                                                                    126. Table 126: China Cereal Bars Market in South America Volume (K Units) Forecast, by Application 2019 & 2032
                                                                    127. Table 127: India Cereal Bars Market in South America Revenue (Million) Forecast, by Application 2019 & 2032
                                                                    128. Table 128: India Cereal Bars Market in South America Volume (K Units) Forecast, by Application 2019 & 2032
                                                                    129. Table 129: Japan Cereal Bars Market in South America Revenue (Million) Forecast, by Application 2019 & 2032
                                                                    130. Table 130: Japan Cereal Bars Market in South America Volume (K Units) Forecast, by Application 2019 & 2032
                                                                    131. Table 131: South Korea Cereal Bars Market in South America Revenue (Million) Forecast, by Application 2019 & 2032
                                                                    132. Table 132: South Korea Cereal Bars Market in South America Volume (K Units) Forecast, by Application 2019 & 2032
                                                                    133. Table 133: ASEAN Cereal Bars Market in South America Revenue (Million) Forecast, by Application 2019 & 2032
                                                                    134. Table 134: ASEAN Cereal Bars Market in South America Volume (K Units) Forecast, by Application 2019 & 2032
                                                                    135. Table 135: Oceania Cereal Bars Market in South America Revenue (Million) Forecast, by Application 2019 & 2032
                                                                    136. Table 136: Oceania Cereal Bars Market in South America Volume (K Units) Forecast, by Application 2019 & 2032
                                                                    137. Table 137: Rest of Asia Pacific Cereal Bars Market in South America Revenue (Million) Forecast, by Application 2019 & 2032
                                                                    138. Table 138: Rest of Asia Pacific Cereal Bars Market in South America Volume (K Units) Forecast, by Application 2019 & 2032


                                                                    Frequently Asked Questions

                                                                    1. What is the projected Compound Annual Growth Rate (CAGR) of the Cereal Bars Market in South America?

                                                                    The projected CAGR is approximately 4.30%.

                                                                    2. Which companies are prominent players in the Cereal Bars Market in South America?

                                                                    Key companies in the market include The Kellogg Company, Nestle S A, General Mills Inc, PepsiCo Inc, Kind LLC*List Not Exhaustive, Clif Bar & Company, Mondelez International Inc.

                                                                    3. What are the main segments of the Cereal Bars Market in South America?

                                                                    The market segments include Production Analysis, Consumption Analysis, Import Market Analysis (Value & Volume), Export Market Analysis (Value & Volume), Price Trend Analysis.

                                                                    4. Can you provide details about the market size?

                                                                    The market size is estimated to be USD 10380 Million as of 2022.

                                                                    5. What are some drivers contributing to market growth?

                                                                    Popularity of Convenient Food Products; Expansion of Cold Chain Logistics.

                                                                    6. What are the notable trends driving market growth?

                                                                    Surge In The Consumption Of Healthy Food.

                                                                    7. Are there any restraints impacting market growth?

                                                                    Concerns Over Food Safety and Quality.

                                                                    8. Can you provide examples of recent developments in the market?

                                                                    N/A

                                                                    9. What pricing options are available for accessing the report?

                                                                    Pricing options include single-user, multi-user, and enterprise licenses priced at USD 4750, USD 4950, and USD 6800 respectively.

                                                                    10. Is the market size provided in terms of value or volume?

                                                                    The market size is provided in terms of value, measured in Million and volume, measured in K Units.

                                                                    11. Are there any specific market keywords associated with the report?

                                                                    Yes, the market keyword associated with the report is "Cereal Bars Market in South America," which aids in identifying and referencing the specific market segment covered.

                                                                    12. How do I determine which pricing option suits my needs best?

                                                                    The pricing options vary based on user requirements and access needs. Individual users may opt for single-user licenses, while businesses requiring broader access may choose multi-user or enterprise licenses for cost-effective access to the report.

                                                                    13. Are there any additional resources or data provided in the Cereal Bars Market in South America report?

                                                                    While the report offers comprehensive insights, it's advisable to review the specific contents or supplementary materials provided to ascertain if additional resources or data are available.

                                                                    14. How can I stay updated on further developments or reports in the Cereal Bars Market in South America?

                                                                    To stay informed about further developments, trends, and reports in the Cereal Bars Market in South America, consider subscribing to industry newsletters, following relevant companies and organizations, or regularly checking reputable industry news sources and publications.


                                                                    Methodology

                                                                    Step 1 - Identification of Relevant Samples Size from Population Database

                                                                    Step Chart
                                                                    Bar Chart
                                                                    Method Chart

                                                                    Step 2 - Approaches for Defining Global Market Size (Value, Volume* & Price*)

                                                                    Approach Chart
                                                                    Top-down and bottom-up approaches are used to validate the global market size and estimate the market size for manufactures, regional segments, product, and application.

                                                                    Note*: In applicable scenarios

                                                                    Step 3 - Data Sources

                                                                    Primary Research

                                                                    • Web Analytics
                                                                    • Survey Reports
                                                                    • Research Institute
                                                                    • Latest Research Reports
                                                                    • Opinion Leaders

                                                                    Secondary Research

                                                                    • Annual Reports
                                                                    • White Paper
                                                                    • Latest Press Release
                                                                    • Industry Association
                                                                    • Paid Database
                                                                    • Investor Presentations
                                                                    Analyst Chart

                                                                    Step 4 - Data Triangulation

                                                                    Involves using different sources of information in order to increase the validity of a study

                                                                    These sources are likely to be stakeholders in a program - participants, other researchers, program staff, other community members, and so on.

                                                                    Then we put all data in single framework & apply various statistical tools to find out the dynamic on the market.

                                                                    During the analysis stage, feedback from the stakeholder groups would be compared to determine areas of agreement as well as areas of divergence

                                                                    Additionally, after gathering mixed and scattered data from a wide range of sources, data is triangulated and correlated to come up with estimated figures which are further validated through primary mediums or industry experts, opinion leaders.

                                                                    About Precision Market View

                                                                    Precision Market View offers precise market research, industry intelligence, and data analysis for healthcare, manufacturing, technology, and energy. Our reports provide the clarity you need to make informed decisions and drive growth.

                                                                    Our team combines primary research, advanced analytics, and industry expertise to deliver actionable intelligence. We offer syndicated reports, custom research, and consulting services tailored to your business needs.

                                                                    At Precision Market View, we are committed to quality, transparency, and client satisfaction. Every report is rigorously validated to ensure accuracy and relevance. Our global perspective and local expertise help you understand both the big picture and the finer details of your market.

                                                                    Stay informed with Precision Market View. Subscribe to our newsletter for the latest updates and research highlights, and follow us on social media for real-time insights.

                                                                    Precision Market View – Clarity for Your Strategic Decisions.

                                                                    artwork spiralartwork spiralRelated Reports
                                                                    artwork underline

                                                                    Exploring Opportunities in Cereal Bars Market in South America Sector

                                                                    Discover the booming South American cereal bar market! This in-depth analysis reveals key trends, growth drivers, and market forecasts (2025-2033) for granola bars, muesli bars, and other cereal bars across Brazil, Argentina, and the wider region. Learn about leading brands and emerging opportunities in this dynamic market.

                                                                    July 2025
                                                                    Base Year: 2024
                                                                    No Of Pages: 210
                                                                    Price: $4750

                                                                    MEA Fruits and Vegetable Juice Market 2025-2033 Analysis: Trends, Competitor Dynamics, and Growth Opportunities

                                                                    Discover the booming MEA fruits & vegetable juice market! This comprehensive analysis reveals a CAGR of 6.24%, driven by health trends and rising disposable incomes. Explore market size, segmentation, key players (Almarai, Pran Foods, Coca-Cola), and future growth projections until 2033. Learn about regional variations and opportunities within this dynamic sector.

                                                                    July 2025
                                                                    Base Year: 2024
                                                                    No Of Pages: 234
                                                                    Price: $4750

                                                                    Germany Poultry Meat Market Analysis 2025 and Forecasts 2033: Unveiling Growth Opportunities

                                                                    Discover the latest insights into the booming German poultry meat market. This comprehensive analysis reveals key growth drivers, market trends, and competitive dynamics, projecting robust expansion through 2033. Explore market segmentation, regional variations, and leading companies shaping this vital sector.

                                                                    July 2025
                                                                    Base Year: 2024
                                                                    No Of Pages: 197
                                                                    Price: $3800

                                                                    Italian Protein Powder Industry in North America: Market Dynamics and Forecasts 2025-2033

                                                                    Discover the booming Italian protein powder market! This in-depth analysis reveals key trends, growth projections (CAGR), leading companies, and segment analysis for 2025-2033. Learn about the market size, drivers, and challenges shaping this lucrative industry.

                                                                    July 2025
                                                                    Base Year: 2024
                                                                    No Of Pages: 180
                                                                    Price: $3800

                                                                    Growth Catalysts in Antioxidant Beverages Market Market

                                                                    Discover the booming antioxidant beverage market! This comprehensive analysis reveals key trends, growth drivers, and leading companies, projecting a significant market expansion to [estimated market size in 2033] by 2033 with a CAGR of 8.70%. Explore regional insights and market segmentation data for informed business decisions.

                                                                    July 2025
                                                                    Base Year: 2024
                                                                    No Of Pages: 234
                                                                    Price: $4750

                                                                    Opportunities in Emerging Gelatin Industry Industry Markets

                                                                    The global gelatin market is booming, projected to reach $XX million by 2033 with a CAGR of 5.11%. Driven by food & beverage, pharmaceutical, and personal care demand, this comprehensive analysis explores market trends, key players (Darling Ingredients, Gelita AG), and regional growth forecasts. Discover the opportunities and challenges shaping this dynamic industry.

                                                                    July 2025
                                                                    Base Year: 2024
                                                                    No Of Pages: 197
                                                                    Price: $3800

                                                                    Food 3D Printing Market Market Growth Fueled by CAGR to XXX Million by 2033

                                                                    The food 3D printing market is booming, projected to reach $5.96 billion by 2033 with a CAGR of 31.57%. This report analyzes market size, growth drivers, trends, restraints, and regional segmentation, featuring key players like TNO and Modern Meadow. Discover the future of personalized food and innovative culinary experiences.

                                                                    July 2025
                                                                    Base Year: 2024
                                                                    No Of Pages: 234
                                                                    Price: $4750

                                                                    China Dairy Market Market Size and Trends 2025-2033: Comprehensive Outlook

                                                                    Discover the booming China dairy market! Our analysis reveals a CAGR of 3.44% to 2033, driven by rising incomes and health consciousness. Learn about key players, market segments, and future trends impacting this lucrative sector.

                                                                    July 2025
                                                                    Base Year: 2024
                                                                    No Of Pages: 197
                                                                    Price: $3800

                                                                    Middle East & Africa Rice Protein Market Strategic Market Roadmap: Analysis and Forecasts 2025-2033

                                                                    Discover the booming Middle East & Africa rice protein market! This comprehensive analysis reveals a CAGR of 5.76%, driven by plant-based trends and health consciousness. Explore market size, segmentation, key players, and future growth projections.

                                                                    July 2025
                                                                    Base Year: 2024
                                                                    No Of Pages: 180
                                                                    Price: $4750

                                                                    MEA Chocolate Industry Market Growth Fueled by CAGR to XXX Million by 2033

                                                                    Discover the booming MEA chocolate market! Our in-depth analysis reveals a CAGR of 6.72% through 2033, driven by rising incomes and changing consumer preferences. Explore market size, segmentation, key players (Nestlé, Ferrero, Mondelez), and future trends in this dynamic region.

                                                                    July 2025
                                                                    Base Year: 2024
                                                                    No Of Pages: 234
                                                                    Price: $4750

                                                                    United States Milk Protein Market Comprehensive Market Study: Trends and Predictions 2025-2033

                                                                    Discover the booming US milk protein market, projected to reach $4B+ by 2033! This in-depth analysis reveals key drivers, trends, and market segmentation, featuring insights into leading companies and regional performance. Learn about growth opportunities in food & beverage, animal feed, and sports nutrition.

                                                                    July 2025
                                                                    Base Year: 2024
                                                                    No Of Pages: 197
                                                                    Price: $3800

                                                                    Future Forecasts for India Breakfast Cereal Market Industry Growth

                                                                    Discover the booming India breakfast cereal market! Learn about its ₹25 billion valuation, 8.20% CAGR growth, key players like Kellogg's & Nestle, and the trends shaping this dynamic sector. Explore market segmentation, regional insights, and future projections for 2025-2033.

                                                                    July 2025
                                                                    Base Year: 2024
                                                                    No Of Pages: 197
                                                                    Price: $3800

                                                                    Asia-Pacific Free-dried Fruits and Vegetables Market Market Valuation to Hit XXX Million by 2033

                                                                    Discover the booming Asia-Pacific free-dried fruits and vegetables market. Explore key trends, growth drivers, leading companies, and regional insights for this dynamic sector projected to reach [estimated 2033 market size in millions] by 2033. Learn more about the opportunities and challenges in this rapidly expanding market.

                                                                    July 2025
                                                                    Base Year: 2024
                                                                    No Of Pages: 234
                                                                    Price: $4750

                                                                    Spirulina Extracts Market Drivers of Growth: Opportunities to 2033

                                                                    Discover the booming Spirulina Extracts Market! Projected to reach over $1.5 billion by 2033, this market is fueled by rising health consciousness and diverse applications in nutraceuticals, food, and cosmetics. Learn about key trends, drivers, and leading companies shaping this exciting sector.

                                                                    July 2025
                                                                    Base Year: 2024
                                                                    No Of Pages: 234
                                                                    Price: $4750

                                                                    Emerging Opportunities in South Africa Beverages Market Market

                                                                    Discover the booming South African beverage market! This comprehensive analysis reveals key trends, growth drivers, and challenges impacting alcoholic & non-alcoholic drinks from 2019-2033, featuring major players like Coca-Cola, Red Bull, and local brands. Explore market size, CAGR, and regional insights for informed business decisions.

                                                                    July 2025
                                                                    Base Year: 2024
                                                                    No Of Pages: 197
                                                                    Price: $3800

                                                                    GCC Edible Meat Market Strategic Insights: Analysis 2025 and Forecasts 2033

                                                                    Discover the booming GCC edible meat market! This comprehensive analysis reveals key trends, growth drivers (population growth, disposable income rise), restraints (price fluctuations, health consciousness), and leading players from 2019-2033. Learn about market segmentation (beef, mutton, poultry, etc.) and regional insights.

                                                                    July 2025
                                                                    Base Year: 2024
                                                                    No Of Pages: 197
                                                                    Price: $3800

                                                                    United Kingdom Tofu Industry Industry Overview and Projections

                                                                    The UK tofu market is booming, projected to reach £413.83 million by 2033, driven by veganism, health consciousness, and sustainable food trends. Discover key market insights, growth projections, and leading players in this rapidly expanding sector.

                                                                    July 2025
                                                                    Base Year: 2024
                                                                    No Of Pages: 197
                                                                    Price: $3800

                                                                    Strategic Growth Drivers for Food Service in Korean Industry Market

                                                                    Discover the booming Korean food service industry! This in-depth analysis reveals market size, growth trends (CAGR 5.60%), key players (Shinsegae Food, Yum! Brands), and regional insights for 2019-2033. Learn about driving forces, restraints, and future opportunities in the Korean QSR, cafes, and restaurant sectors.

                                                                    July 2025
                                                                    Base Year: 2024
                                                                    No Of Pages: 197
                                                                    Price: $3800

                                                                    APAC Collagen Market Market Demand Dynamics: Insights 2025-2033

                                                                    Discover the booming APAC collagen market! This in-depth analysis reveals key trends, growth drivers (like rising health consciousness and booming beauty industry), and challenges impacting this lucrative sector from 2025-2033. Explore market size, CAGR, and regional breakdowns. Learn about leading companies and invest wisely.

                                                                    July 2025
                                                                    Base Year: 2024
                                                                    No Of Pages: 234
                                                                    Price: $4750

                                                                    Global Gluten-Free Ready Meals Market Size, Share, and Growth Report: In-Depth Analysis and Forecast to 2033

                                                                    Discover the booming global gluten-free ready meals market! This comprehensive analysis reveals market size, CAGR (9.50%), key drivers, trends, and regional insights. Learn about leading companies and explore the future of convenient, healthy eating for those with dietary restrictions.

                                                                    July 2025
                                                                    Base Year: 2024
                                                                    No Of Pages: 180
                                                                    Price: $4750

                                                                    Business Address

                                                                    Head Office

                                                                    Office no. A 5010, fifth floor, Solitaire Business Hub, Near Phoenix mall, Pune, Maharashtra 411014

                                                                    Contact Information

                                                                    Craig Francis

                                                                    Business Development Head

                                                                    +17162654855

                                                                    [email protected]

                                                                    Connect With Us

                                                                    Secure Payment Partners

                                                                    payment image
                                                                    RetailLogisticsPackagingAutomotiveHealthcareAgricultureEnergy & PowerFood & BeverageAerospace & DefenseChemicals & MaterialsHospitality and TourismAnimal Nutrition & WellnessConsumer Goods and ServicesReal Estate and ConstructionHome and Property ImprovementTechnology, Media and TelecomManufacturing Products and ServicesFinancial Services and Investment Intelligence

                                                                    © 2025 All rights reserved


                                                                    Privacy Policy
                                                                    Terms and Conditions
                                                                    FAQ
                                                                    • Home
                                                                    • About Us
                                                                    • Industries
                                                                      • Aerospace & Defense
                                                                      • Agriculture
                                                                      • Animal Nutrition & Wellness
                                                                      • Automotive
                                                                      • Chemicals & Materials
                                                                      • Consumer Goods and Services
                                                                      • Energy & Power
                                                                      • Financial Services and Investment Intelligence
                                                                      • Food & Beverage
                                                                      • Home and Property Improvement
                                                                      • Hospitality and Tourism
                                                                      • Logistics
                                                                      • Manufacturing Products and Services
                                                                      • Packaging
                                                                      • Professional and Commercial Services
                                                                      • Real Estate and Construction
                                                                      • Retail
                                                                      • Technology, Media and Telecom
                                                                      • Healthcare
                                                                    • Services
                                                                    • Contact
                                                                    Main Logo
                                                                    • Home
                                                                    • About Us
                                                                    • Industries
                                                                      • Aerospace & Defense
                                                                      • Agriculture
                                                                      • Animal Nutrition & Wellness
                                                                      • Automotive
                                                                      • Chemicals & Materials
                                                                      • Consumer Goods and Services
                                                                      • Energy & Power
                                                                      • Financial Services and Investment Intelligence
                                                                      • Food & Beverage
                                                                      • Home and Property Improvement
                                                                      • Hospitality and Tourism
                                                                      • Logistics
                                                                      • Manufacturing Products and Services
                                                                      • Packaging
                                                                      • Professional and Commercial Services
                                                                      • Real Estate and Construction
                                                                      • Retail
                                                                      • Technology, Media and Telecom
                                                                      • Healthcare
                                                                    • Services
                                                                    • Contact
                                                                    +17162654855
                                                                    [email protected]

                                                                    +17162654855

                                                                    [email protected]