
Key Insights
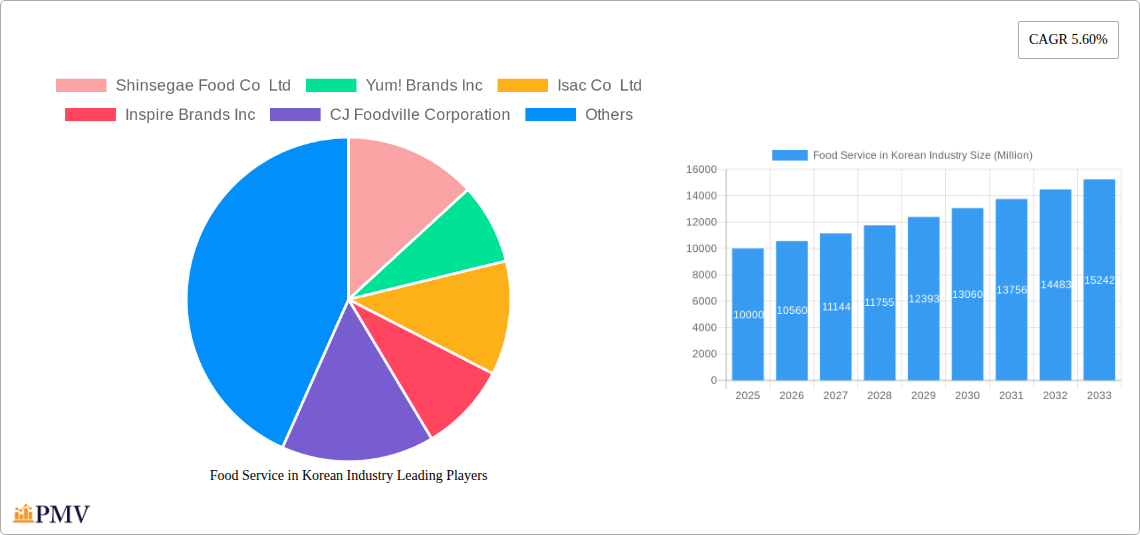
The Korean food service industry, exhibiting a Compound Annual Growth Rate (CAGR) of 5.60% from 2019-2024, presents a dynamic and lucrative market. Driven by increasing disposable incomes, evolving consumer preferences towards diverse culinary experiences, and a burgeoning tourism sector, the industry is experiencing robust growth. The market segmentation reveals a diverse landscape, encompassing various cuisines (including the prominent Korean QSR segment), diverse outlet types (ranging from independent eateries to large chains), and varied locations (from standalone restaurants to those integrated into leisure, lodging, and travel hubs). Key players like Shinsegae Food Co Ltd, Yum! Brands Inc, and CJ Foodville Corporation dominate the market, leveraging strong brand recognition and extensive distribution networks. However, challenges exist, including increasing operating costs, intense competition, and fluctuating raw material prices which may act as restraints. The future growth trajectory is expected to be influenced by innovative menu offerings, technological advancements in food delivery and ordering systems, and the successful adaptation to changing consumer behavior.
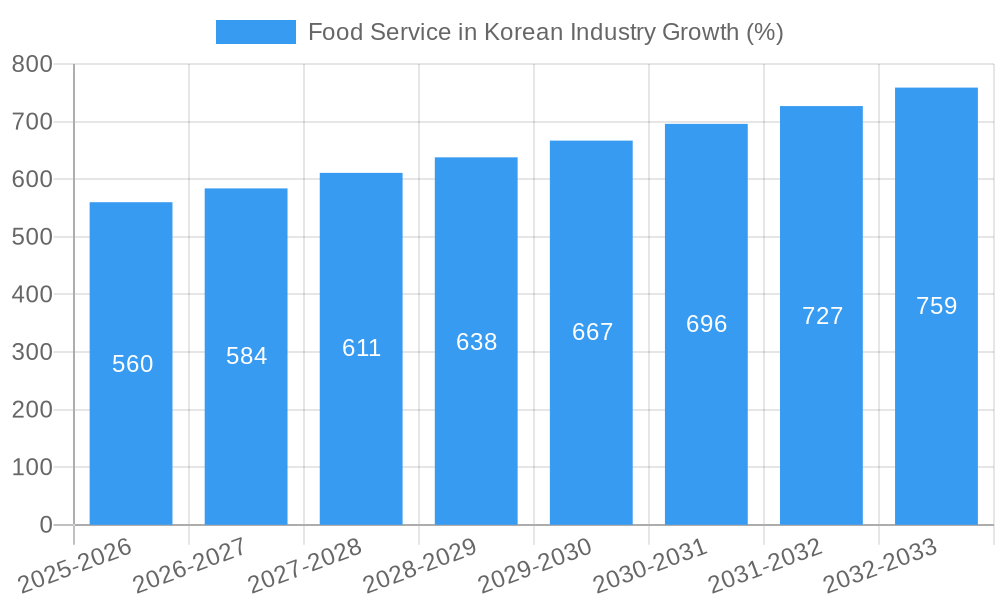
Growth in the sector is further fueled by the expanding popularity of Korean cuisine globally. The rise of food delivery apps and online ordering platforms has significantly altered consumer behavior, leading to an increase in demand for convenience and customization. This trend presents both opportunities and challenges for food service businesses, requiring them to invest in robust online ordering systems and delivery infrastructure. Moreover, the industry is witnessing a growing emphasis on sustainability and ethical sourcing, with consumers increasingly demanding environmentally friendly practices. Businesses that effectively integrate these elements into their operations are expected to gain a competitive edge. The forecast period of 2025-2033 suggests continued expansion, driven by these factors, though careful management of operational costs and adaptation to evolving consumer preferences remains crucial for sustained success.
Food Service in Korean Industry: Market Analysis & Forecast Report (2019-2033)
This comprehensive report provides a detailed analysis of the Food Service in Korean Industry, offering invaluable insights for businesses, investors, and stakeholders seeking to understand and capitalize on this dynamic market. The report covers the period from 2019 to 2033, with a focus on the base year 2025 and a forecast period of 2025-2033. The market is segmented by cuisine type (including Other QSR Cuisines), outlet type (Chained Outlets and Independent Outlets), location (Leisure, Lodging, Retail, Standalone, Travel), and foodservice type (Cafes & Bars). The report analyzes key players such as Shinsegae Food Co Ltd, Yum! Brands Inc, and McDonald's Corporation, among others, providing a granular understanding of market structure, competitive dynamics, and future growth potential. The estimated market size in 2025 is xx Million.
Food Service in Korean Industry Market Structure & Competitive Dynamics
The Korean food service industry exhibits a complex interplay of established players and emerging entrants, shaping a dynamic competitive landscape. Market concentration is moderate, with several large chains holding significant market share, while numerous smaller, independent operators cater to niche segments. Innovation ecosystems are driven by technological advancements in food preparation, delivery, and customer engagement. The regulatory framework, encompassing food safety regulations and licensing procedures, influences operational costs and market entry barriers. Product substitutes, such as home-cooked meals and meal delivery kits, pose a constant competitive threat. End-user trends, particularly shifting preferences towards healthier options and convenient dining experiences, are reshaping product offerings and operational strategies. Mergers and acquisitions (M&A) activity has been significant in recent years, with deals valued at xx Million driving consolidation and expansion.
- Market Share: The top 5 players account for an estimated xx% of the market share in 2025.
- M&A Activity (2019-2024): Total M&A deal value estimated at xx Million. Notable deals include Yum! Brands Inc.'s acquisition of KFC Korea.
- Innovation: Significant investments are being made in areas like automation, personalized meal customization and digital ordering.
Food Service in Korean Industry Industry Trends & Insights
The Korean food service industry is characterized by robust growth fueled by several key factors. Rising disposable incomes and a burgeoning middle class are driving increased demand for dining out and convenient food options. Rapid urbanization and changing lifestyles are contributing to the popularity of quick-service restaurants (QSRs) and casual dining establishments. Technological disruptions, including online ordering, mobile payment systems, and delivery platforms, are transforming consumer behavior and industry operations. Consumer preferences are shifting towards healthier and more diverse food choices, creating opportunities for specialized restaurants and innovative menu offerings. Competitive dynamics remain intense, with companies vying for market share through strategic expansions, product innovations, and brand building. The Compound Annual Growth Rate (CAGR) for the period 2025-2033 is projected at xx%, with market penetration of xx% by 2033.
Dominant Markets & Segments in Food Service in Korean Industry
The Chained Outlets segment dominates the Korean food service market, accounting for xx Million in revenue in 2025. This is primarily driven by the high concentration of large, established restaurant chains and their extensive reach across the country. The Standalone location type is also significant, reflecting the prevalence of independent restaurants catering to local communities. Within food service types, Cafes & Bars demonstrate strong growth, driven by consumer preferences for diverse culinary experiences and social gathering places.
- Key Drivers for Chained Outlets:
- Strong brand recognition and established customer loyalty.
- Economies of scale in sourcing, operations, and marketing.
- Effective franchising and expansion strategies.
- Key Drivers for Standalone Outlets:
- Ability to cater to niche markets and local preferences.
- Flexible menu offerings and personalized customer service.
- Proximity to residential areas and local communities.
- Key Drivers for Cafes & Bars:
- Growing demand for social gathering spaces.
- Increasing disposable incomes and willingness to spend on experiences.
- Diverse menu offerings catering to evolving consumer tastes.
Food Service in Korean Industry Product Innovations
Recent innovations in the Korean food service industry focus on incorporating plant-based options, such as Shinsegae Food's Better Burger launch, and leveraging technology to enhance the customer experience, including mobile ordering and personalized recommendations. This reflects an increasing market demand for healthier and sustainable choices, along with a growing preference for streamlined and convenient services. The successful integration of these new product developments into existing market offerings indicates an understanding of consumer trends and a strong ability to innovate within the industry.
Report Segmentation & Scope
The report segments the Korean food service market across several key parameters:
- Cuisine Type: Other QSR Cuisines displays substantial growth due to the rising popularity of international cuisines.
- Outlet Type: Chained Outlets segment holds a significant market share, while Independent Outlets showcase potential for growth through specialized offerings.
- Location: The Standalone segment accounts for a substantial portion of the market. Growth is expected in the Leisure and Travel segments.
- Foodservice Type: Cafes & Bars are showing robust growth, driven by consumer preferences for diverse dining experiences.
Each segment's growth projections are detailed within the full report, along with respective market sizes and competitive analyses.
Key Drivers of Food Service in Korean Industry Growth
Several key factors are driving growth in the Korean food service industry. These include the rising disposable incomes and changing lifestyles fueling demand for convenient dining options. Furthermore, the strong growth of e-commerce and food delivery platforms has significantly expanded market access and convenience. Government initiatives supporting the hospitality sector and regulatory reforms facilitating business development further contribute to the growth trajectory.
Challenges in the Food Service in Korean Industry Sector
The Korean food service industry faces several challenges. These include rising labor costs, increasing competition, and maintaining consistent food quality amidst fluctuating ingredient prices and supply chain issues. Additionally, strict health and safety regulations pose compliance costs, and adapting to evolving consumer preferences requires ongoing investment in innovation and marketing. The impact of these challenges on profitability is estimated at xx Million annually.
Leading Players in the Food Service in Korean Industry Market
- Shinsegae Food Co Ltd
- Yum! Brands Inc
- Isac Co Ltd
- Inspire Brands Inc
- CJ Foodville Corporation
- Seven & I Holdings Co Ltd
- Kyochon Food&Beverage Co Ltd
- Doctor's Associate Inc
- MP DAESAN Inc
- Genesis Co Ltd
- Domino's Pizza Inc
- Starbucks Corporation
- Restaurant Brands International Inc
- Royal T Group Pte Ltd
- McDonald's Corporation
- Mom's Touch & Co
Key Developments in Food Service in Korean Industry Sector
- April 2023: Shinsegae Food introduced a 100% plant-based burger, indicating a shift towards healthier and more sustainable options.
- March 2023: Yum! Brands Inc.'s acquisition of KFC Korea signifies market consolidation and expansion strategies.
- February 2023: McDonald's Korea's collaboration with NewJeans highlights the importance of strategic partnerships and targeted marketing campaigns in engaging younger demographics.
Strategic Food Service in Korean Industry Market Outlook
The Korean food service industry is poised for continued growth, driven by evolving consumer preferences, technological advancements, and strategic investments. Opportunities lie in expanding into underserved markets, catering to diverse culinary tastes, and leveraging technology to enhance customer experience and operational efficiency. The focus on sustainability and health-conscious choices will further shape future market trends and strategic opportunities. The market is projected to reach xx Million by 2033, representing substantial growth potential for established players and new entrants alike.
Food Service in Korean Industry Segmentation
-
1. Foodservice Type
-
1.1. Cafes & Bars
-
1.1.1. By Cuisine
- 1.1.1.1. Bars & Pubs
- 1.1.1.2. Juice/Smoothie/Desserts Bars
- 1.1.1.3. Specialist Coffee & Tea Shops
-
1.1.1. By Cuisine
- 1.2. Cloud Kitchen
-
1.3. Full Service Restaurants
- 1.3.1. Asian
- 1.3.2. European
- 1.3.3. Latin American
- 1.3.4. Middle Eastern
- 1.3.5. North American
- 1.3.6. Other FSR Cuisines
-
1.4. Quick Service Restaurants
- 1.4.1. Bakeries
- 1.4.2. Burger
- 1.4.3. Ice Cream
- 1.4.4. Meat-based Cuisines
- 1.4.5. Pizza
- 1.4.6. Other QSR Cuisines
-
1.1. Cafes & Bars
-
2. Outlet
- 2.1. Chained Outlets
- 2.2. Independent Outlets
-
3. Location
- 3.1. Leisure
- 3.2. Lodging
- 3.3. Retail
- 3.4. Standalone
- 3.5. Travel
Food Service in Korean Industry Segmentation By Geography
-
1. North America
- 1.1. United States
- 1.2. Canada
- 1.3. Mexico
-
2. South America
- 2.1. Brazil
- 2.2. Argentina
- 2.3. Rest of South America
-
3. Europe
- 3.1. United Kingdom
- 3.2. Germany
- 3.3. France
- 3.4. Italy
- 3.5. Spain
- 3.6. Russia
- 3.7. Benelux
- 3.8. Nordics
- 3.9. Rest of Europe
-
4. Middle East & Africa
- 4.1. Turkey
- 4.2. Israel
- 4.3. GCC
- 4.4. North Africa
- 4.5. South Africa
- 4.6. Rest of Middle East & Africa
-
5. Asia Pacific
- 5.1. China
- 5.2. India
- 5.3. Japan
- 5.4. South Korea
- 5.5. ASEAN
- 5.6. Oceania
- 5.7. Rest of Asia Pacific
Food Service in Korean Industry REPORT HIGHLIGHTS
| Aspects | Details |
|---|---|
| Study Period | 2019-2033 |
| Base Year | 2024 |
| Estimated Year | 2025 |
| Forecast Period | 2025-2033 |
| Historical Period | 2019-2024 |
| Growth Rate | CAGR of 5.60% from 2019-2033 |
| Segmentation |
|
Table of Contents
- 1. Introduction
- 1.1. Research Scope
- 1.2. Market Segmentation
- 1.3. Research Methodology
- 1.4. Definitions and Assumptions
- 2. Executive Summary
- 2.1. Introduction
- 3. Market Dynamics
- 3.1. Introduction
- 3.2. Market Drivers
- 3.2.1. Growing Demand for Cocoa Butter Equivalents Among Food Manufacturers; Rising Application in Food Industry
- 3.3. Market Restrains
- 3.3.1. Health Concerns Pertaining to the Excessive Consumption of Fats and Oils
- 3.4. Market Trends
- 3.4.1. High demand for traditional cuisines and increased spending on dining increase the sales
- 4. Market Factor Analysis
- 4.1. Porters Five Forces
- 4.2. Supply/Value Chain
- 4.3. PESTEL analysis
- 4.4. Market Entropy
- 4.5. Patent/Trademark Analysis
- 5. Global Food Service in Korean Industry Analysis, Insights and Forecast, 2019-2031
- 5.1. Market Analysis, Insights and Forecast - by Foodservice Type
- 5.1.1. Cafes & Bars
- 5.1.1.1. By Cuisine
- 5.1.1.1.1. Bars & Pubs
- 5.1.1.1.2. Juice/Smoothie/Desserts Bars
- 5.1.1.1.3. Specialist Coffee & Tea Shops
- 5.1.1.1. By Cuisine
- 5.1.2. Cloud Kitchen
- 5.1.3. Full Service Restaurants
- 5.1.3.1. Asian
- 5.1.3.2. European
- 5.1.3.3. Latin American
- 5.1.3.4. Middle Eastern
- 5.1.3.5. North American
- 5.1.3.6. Other FSR Cuisines
- 5.1.4. Quick Service Restaurants
- 5.1.4.1. Bakeries
- 5.1.4.2. Burger
- 5.1.4.3. Ice Cream
- 5.1.4.4. Meat-based Cuisines
- 5.1.4.5. Pizza
- 5.1.4.6. Other QSR Cuisines
- 5.1.1. Cafes & Bars
- 5.2. Market Analysis, Insights and Forecast - by Outlet
- 5.2.1. Chained Outlets
- 5.2.2. Independent Outlets
- 5.3. Market Analysis, Insights and Forecast - by Location
- 5.3.1. Leisure
- 5.3.2. Lodging
- 5.3.3. Retail
- 5.3.4. Standalone
- 5.3.5. Travel
- 5.4. Market Analysis, Insights and Forecast - by Region
- 5.4.1. North America
- 5.4.2. South America
- 5.4.3. Europe
- 5.4.4. Middle East & Africa
- 5.4.5. Asia Pacific
- 5.1. Market Analysis, Insights and Forecast - by Foodservice Type
- 6. North America Food Service in Korean Industry Analysis, Insights and Forecast, 2019-2031
- 6.1. Market Analysis, Insights and Forecast - by Foodservice Type
- 6.1.1. Cafes & Bars
- 6.1.1.1. By Cuisine
- 6.1.1.1.1. Bars & Pubs
- 6.1.1.1.2. Juice/Smoothie/Desserts Bars
- 6.1.1.1.3. Specialist Coffee & Tea Shops
- 6.1.1.1. By Cuisine
- 6.1.2. Cloud Kitchen
- 6.1.3. Full Service Restaurants
- 6.1.3.1. Asian
- 6.1.3.2. European
- 6.1.3.3. Latin American
- 6.1.3.4. Middle Eastern
- 6.1.3.5. North American
- 6.1.3.6. Other FSR Cuisines
- 6.1.4. Quick Service Restaurants
- 6.1.4.1. Bakeries
- 6.1.4.2. Burger
- 6.1.4.3. Ice Cream
- 6.1.4.4. Meat-based Cuisines
- 6.1.4.5. Pizza
- 6.1.4.6. Other QSR Cuisines
- 6.1.1. Cafes & Bars
- 6.2. Market Analysis, Insights and Forecast - by Outlet
- 6.2.1. Chained Outlets
- 6.2.2. Independent Outlets
- 6.3. Market Analysis, Insights and Forecast - by Location
- 6.3.1. Leisure
- 6.3.2. Lodging
- 6.3.3. Retail
- 6.3.4. Standalone
- 6.3.5. Travel
- 6.1. Market Analysis, Insights and Forecast - by Foodservice Type
- 7. South America Food Service in Korean Industry Analysis, Insights and Forecast, 2019-2031
- 7.1. Market Analysis, Insights and Forecast - by Foodservice Type
- 7.1.1. Cafes & Bars
- 7.1.1.1. By Cuisine
- 7.1.1.1.1. Bars & Pubs
- 7.1.1.1.2. Juice/Smoothie/Desserts Bars
- 7.1.1.1.3. Specialist Coffee & Tea Shops
- 7.1.1.1. By Cuisine
- 7.1.2. Cloud Kitchen
- 7.1.3. Full Service Restaurants
- 7.1.3.1. Asian
- 7.1.3.2. European
- 7.1.3.3. Latin American
- 7.1.3.4. Middle Eastern
- 7.1.3.5. North American
- 7.1.3.6. Other FSR Cuisines
- 7.1.4. Quick Service Restaurants
- 7.1.4.1. Bakeries
- 7.1.4.2. Burger
- 7.1.4.3. Ice Cream
- 7.1.4.4. Meat-based Cuisines
- 7.1.4.5. Pizza
- 7.1.4.6. Other QSR Cuisines
- 7.1.1. Cafes & Bars
- 7.2. Market Analysis, Insights and Forecast - by Outlet
- 7.2.1. Chained Outlets
- 7.2.2. Independent Outlets
- 7.3. Market Analysis, Insights and Forecast - by Location
- 7.3.1. Leisure
- 7.3.2. Lodging
- 7.3.3. Retail
- 7.3.4. Standalone
- 7.3.5. Travel
- 7.1. Market Analysis, Insights and Forecast - by Foodservice Type
- 8. Europe Food Service in Korean Industry Analysis, Insights and Forecast, 2019-2031
- 8.1. Market Analysis, Insights and Forecast - by Foodservice Type
- 8.1.1. Cafes & Bars
- 8.1.1.1. By Cuisine
- 8.1.1.1.1. Bars & Pubs
- 8.1.1.1.2. Juice/Smoothie/Desserts Bars
- 8.1.1.1.3. Specialist Coffee & Tea Shops
- 8.1.1.1. By Cuisine
- 8.1.2. Cloud Kitchen
- 8.1.3. Full Service Restaurants
- 8.1.3.1. Asian
- 8.1.3.2. European
- 8.1.3.3. Latin American
- 8.1.3.4. Middle Eastern
- 8.1.3.5. North American
- 8.1.3.6. Other FSR Cuisines
- 8.1.4. Quick Service Restaurants
- 8.1.4.1. Bakeries
- 8.1.4.2. Burger
- 8.1.4.3. Ice Cream
- 8.1.4.4. Meat-based Cuisines
- 8.1.4.5. Pizza
- 8.1.4.6. Other QSR Cuisines
- 8.1.1. Cafes & Bars
- 8.2. Market Analysis, Insights and Forecast - by Outlet
- 8.2.1. Chained Outlets
- 8.2.2. Independent Outlets
- 8.3. Market Analysis, Insights and Forecast - by Location
- 8.3.1. Leisure
- 8.3.2. Lodging
- 8.3.3. Retail
- 8.3.4. Standalone
- 8.3.5. Travel
- 8.1. Market Analysis, Insights and Forecast - by Foodservice Type
- 9. Middle East & Africa Food Service in Korean Industry Analysis, Insights and Forecast, 2019-2031
- 9.1. Market Analysis, Insights and Forecast - by Foodservice Type
- 9.1.1. Cafes & Bars
- 9.1.1.1. By Cuisine
- 9.1.1.1.1. Bars & Pubs
- 9.1.1.1.2. Juice/Smoothie/Desserts Bars
- 9.1.1.1.3. Specialist Coffee & Tea Shops
- 9.1.1.1. By Cuisine
- 9.1.2. Cloud Kitchen
- 9.1.3. Full Service Restaurants
- 9.1.3.1. Asian
- 9.1.3.2. European
- 9.1.3.3. Latin American
- 9.1.3.4. Middle Eastern
- 9.1.3.5. North American
- 9.1.3.6. Other FSR Cuisines
- 9.1.4. Quick Service Restaurants
- 9.1.4.1. Bakeries
- 9.1.4.2. Burger
- 9.1.4.3. Ice Cream
- 9.1.4.4. Meat-based Cuisines
- 9.1.4.5. Pizza
- 9.1.4.6. Other QSR Cuisines
- 9.1.1. Cafes & Bars
- 9.2. Market Analysis, Insights and Forecast - by Outlet
- 9.2.1. Chained Outlets
- 9.2.2. Independent Outlets
- 9.3. Market Analysis, Insights and Forecast - by Location
- 9.3.1. Leisure
- 9.3.2. Lodging
- 9.3.3. Retail
- 9.3.4. Standalone
- 9.3.5. Travel
- 9.1. Market Analysis, Insights and Forecast - by Foodservice Type
- 10. Asia Pacific Food Service in Korean Industry Analysis, Insights and Forecast, 2019-2031
- 10.1. Market Analysis, Insights and Forecast - by Foodservice Type
- 10.1.1. Cafes & Bars
- 10.1.1.1. By Cuisine
- 10.1.1.1.1. Bars & Pubs
- 10.1.1.1.2. Juice/Smoothie/Desserts Bars
- 10.1.1.1.3. Specialist Coffee & Tea Shops
- 10.1.1.1. By Cuisine
- 10.1.2. Cloud Kitchen
- 10.1.3. Full Service Restaurants
- 10.1.3.1. Asian
- 10.1.3.2. European
- 10.1.3.3. Latin American
- 10.1.3.4. Middle Eastern
- 10.1.3.5. North American
- 10.1.3.6. Other FSR Cuisines
- 10.1.4. Quick Service Restaurants
- 10.1.4.1. Bakeries
- 10.1.4.2. Burger
- 10.1.4.3. Ice Cream
- 10.1.4.4. Meat-based Cuisines
- 10.1.4.5. Pizza
- 10.1.4.6. Other QSR Cuisines
- 10.1.1. Cafes & Bars
- 10.2. Market Analysis, Insights and Forecast - by Outlet
- 10.2.1. Chained Outlets
- 10.2.2. Independent Outlets
- 10.3. Market Analysis, Insights and Forecast - by Location
- 10.3.1. Leisure
- 10.3.2. Lodging
- 10.3.3. Retail
- 10.3.4. Standalone
- 10.3.5. Travel
- 10.1. Market Analysis, Insights and Forecast - by Foodservice Type
- 11. North America Food Service in Korean Industry Analysis, Insights and Forecast, 2019-2031
- 11.1. Market Analysis, Insights and Forecast - By Country/Sub-region
- 11.1.1 United States
- 11.1.2 Canada
- 11.1.3 Mexico
- 11.1.4 Rest of North America
- 12. Europe Food Service in Korean Industry Analysis, Insights and Forecast, 2019-2031
- 12.1. Market Analysis, Insights and Forecast - By Country/Sub-region
- 12.1.1 Germany
- 12.1.2 United Kingdom
- 12.1.3 Italy
- 12.1.4 Spain
- 12.1.5 France
- 12.1.6 Russia
- 12.1.7 Rest of Europe
- 13. Asia Pacific Food Service in Korean Industry Analysis, Insights and Forecast, 2019-2031
- 13.1. Market Analysis, Insights and Forecast - By Country/Sub-region
- 13.1.1 China
- 13.1.2 Japan
- 13.1.3 India
- 13.1.4 Australia
- 13.1.5 Rest of Asia Pacific
- 14. South America Food Service in Korean Industry Analysis, Insights and Forecast, 2019-2031
- 14.1. Market Analysis, Insights and Forecast - By Country/Sub-region
- 14.1.1 Brazil
- 14.1.2 Argentina
- 14.1.3 Rest of South America
- 15. Middle East and Africa Food Service in Korean Industry Analysis, Insights and Forecast, 2019-2031
- 15.1. Market Analysis, Insights and Forecast - By Country/Sub-region
- 15.1.1 Saudi Arabia
- 15.1.2 South Africa
- 15.1.3 Rest of Middle East and Africa
- 16. Competitive Analysis
- 16.1. Global Market Share Analysis 2024
- 16.2. Company Profiles
- 16.2.1 Shinsegae Food Co Ltd
- 16.2.1.1. Overview
- 16.2.1.2. Products
- 16.2.1.3. SWOT Analysis
- 16.2.1.4. Recent Developments
- 16.2.1.5. Financials (Based on Availability)
- 16.2.2 Yum! Brands Inc
- 16.2.2.1. Overview
- 16.2.2.2. Products
- 16.2.2.3. SWOT Analysis
- 16.2.2.4. Recent Developments
- 16.2.2.5. Financials (Based on Availability)
- 16.2.3 Isac Co Ltd
- 16.2.3.1. Overview
- 16.2.3.2. Products
- 16.2.3.3. SWOT Analysis
- 16.2.3.4. Recent Developments
- 16.2.3.5. Financials (Based on Availability)
- 16.2.4 Inspire Brands Inc
- 16.2.4.1. Overview
- 16.2.4.2. Products
- 16.2.4.3. SWOT Analysis
- 16.2.4.4. Recent Developments
- 16.2.4.5. Financials (Based on Availability)
- 16.2.5 CJ Foodville Corporation
- 16.2.5.1. Overview
- 16.2.5.2. Products
- 16.2.5.3. SWOT Analysis
- 16.2.5.4. Recent Developments
- 16.2.5.5. Financials (Based on Availability)
- 16.2.6 Seven & I Holdings Co Ltd
- 16.2.6.1. Overview
- 16.2.6.2. Products
- 16.2.6.3. SWOT Analysis
- 16.2.6.4. Recent Developments
- 16.2.6.5. Financials (Based on Availability)
- 16.2.7 Kyochon Food&Beverage Co Ltd
- 16.2.7.1. Overview
- 16.2.7.2. Products
- 16.2.7.3. SWOT Analysis
- 16.2.7.4. Recent Developments
- 16.2.7.5. Financials (Based on Availability)
- 16.2.8 Doctor's Associate Inc
- 16.2.8.1. Overview
- 16.2.8.2. Products
- 16.2.8.3. SWOT Analysis
- 16.2.8.4. Recent Developments
- 16.2.8.5. Financials (Based on Availability)
- 16.2.9 MP DAESAN Inc
- 16.2.9.1. Overview
- 16.2.9.2. Products
- 16.2.9.3. SWOT Analysis
- 16.2.9.4. Recent Developments
- 16.2.9.5. Financials (Based on Availability)
- 16.2.10 Genesis Co Ltd
- 16.2.10.1. Overview
- 16.2.10.2. Products
- 16.2.10.3. SWOT Analysis
- 16.2.10.4. Recent Developments
- 16.2.10.5. Financials (Based on Availability)
- 16.2.11 Domino's Pizza Inc
- 16.2.11.1. Overview
- 16.2.11.2. Products
- 16.2.11.3. SWOT Analysis
- 16.2.11.4. Recent Developments
- 16.2.11.5. Financials (Based on Availability)
- 16.2.12 Starbucks Corporation
- 16.2.12.1. Overview
- 16.2.12.2. Products
- 16.2.12.3. SWOT Analysis
- 16.2.12.4. Recent Developments
- 16.2.12.5. Financials (Based on Availability)
- 16.2.13 Restaurant Brands International Inc
- 16.2.13.1. Overview
- 16.2.13.2. Products
- 16.2.13.3. SWOT Analysis
- 16.2.13.4. Recent Developments
- 16.2.13.5. Financials (Based on Availability)
- 16.2.14 Royal T Group Pte Ltd
- 16.2.14.1. Overview
- 16.2.14.2. Products
- 16.2.14.3. SWOT Analysis
- 16.2.14.4. Recent Developments
- 16.2.14.5. Financials (Based on Availability)
- 16.2.15 McDonald's Corporation
- 16.2.15.1. Overview
- 16.2.15.2. Products
- 16.2.15.3. SWOT Analysis
- 16.2.15.4. Recent Developments
- 16.2.15.5. Financials (Based on Availability)
- 16.2.16 Mom's Touch & Co
- 16.2.16.1. Overview
- 16.2.16.2. Products
- 16.2.16.3. SWOT Analysis
- 16.2.16.4. Recent Developments
- 16.2.16.5. Financials (Based on Availability)
- 16.2.1 Shinsegae Food Co Ltd
List of Figures
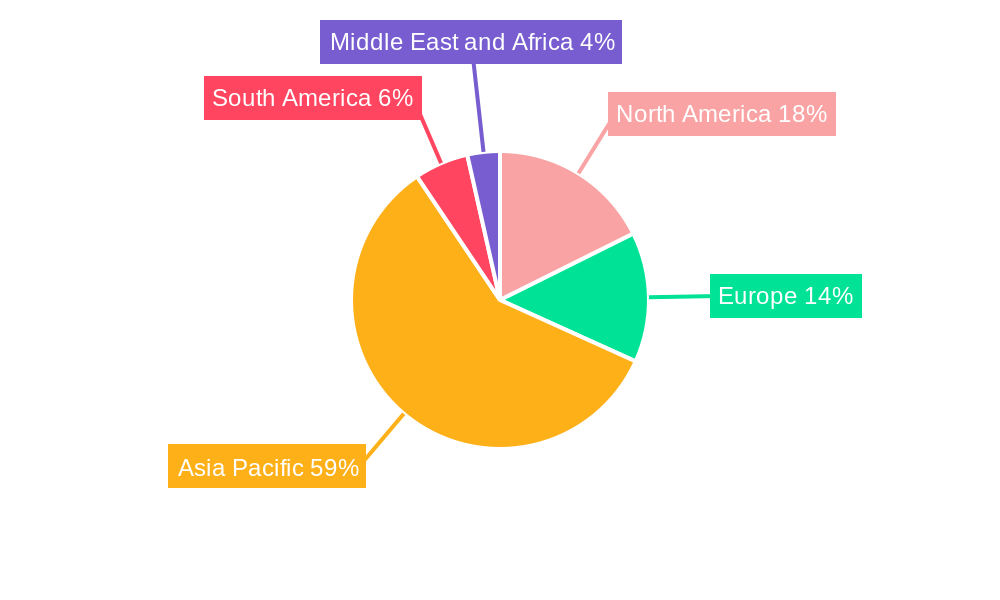
- Figure 1: Global Food Service in Korean Industry Revenue Breakdown (Million, %) by Region 2024 & 2032
- Figure 2: North America Food Service in Korean Industry Revenue (Million), by Country 2024 & 2032
- Figure 3: North America Food Service in Korean Industry Revenue Share (%), by Country 2024 & 2032
- Figure 4: Europe Food Service in Korean Industry Revenue (Million), by Country 2024 & 2032
- Figure 5: Europe Food Service in Korean Industry Revenue Share (%), by Country 2024 & 2032
- Figure 6: Asia Pacific Food Service in Korean Industry Revenue (Million), by Country 2024 & 2032
- Figure 7: Asia Pacific Food Service in Korean Industry Revenue Share (%), by Country 2024 & 2032
- Figure 8: South America Food Service in Korean Industry Revenue (Million), by Country 2024 & 2032
- Figure 9: South America Food Service in Korean Industry Revenue Share (%), by Country 2024 & 2032
- Figure 10: Middle East and Africa Food Service in Korean Industry Revenue (Million), by Country 2024 & 2032
- Figure 11: Middle East and Africa Food Service in Korean Industry Revenue Share (%), by Country 2024 & 2032
- Figure 12: North America Food Service in Korean Industry Revenue (Million), by Foodservice Type 2024 & 2032
- Figure 13: North America Food Service in Korean Industry Revenue Share (%), by Foodservice Type 2024 & 2032
- Figure 14: North America Food Service in Korean Industry Revenue (Million), by Outlet 2024 & 2032
- Figure 15: North America Food Service in Korean Industry Revenue Share (%), by Outlet 2024 & 2032
- Figure 16: North America Food Service in Korean Industry Revenue (Million), by Location 2024 & 2032
- Figure 17: North America Food Service in Korean Industry Revenue Share (%), by Location 2024 & 2032
- Figure 18: North America Food Service in Korean Industry Revenue (Million), by Country 2024 & 2032
- Figure 19: North America Food Service in Korean Industry Revenue Share (%), by Country 2024 & 2032
- Figure 20: South America Food Service in Korean Industry Revenue (Million), by Foodservice Type 2024 & 2032
- Figure 21: South America Food Service in Korean Industry Revenue Share (%), by Foodservice Type 2024 & 2032
- Figure 22: South America Food Service in Korean Industry Revenue (Million), by Outlet 2024 & 2032
- Figure 23: South America Food Service in Korean Industry Revenue Share (%), by Outlet 2024 & 2032
- Figure 24: South America Food Service in Korean Industry Revenue (Million), by Location 2024 & 2032
- Figure 25: South America Food Service in Korean Industry Revenue Share (%), by Location 2024 & 2032
- Figure 26: South America Food Service in Korean Industry Revenue (Million), by Country 2024 & 2032
- Figure 27: South America Food Service in Korean Industry Revenue Share (%), by Country 2024 & 2032
- Figure 28: Europe Food Service in Korean Industry Revenue (Million), by Foodservice Type 2024 & 2032
- Figure 29: Europe Food Service in Korean Industry Revenue Share (%), by Foodservice Type 2024 & 2032
- Figure 30: Europe Food Service in Korean Industry Revenue (Million), by Outlet 2024 & 2032
- Figure 31: Europe Food Service in Korean Industry Revenue Share (%), by Outlet 2024 & 2032
- Figure 32: Europe Food Service in Korean Industry Revenue (Million), by Location 2024 & 2032
- Figure 33: Europe Food Service in Korean Industry Revenue Share (%), by Location 2024 & 2032
- Figure 34: Europe Food Service in Korean Industry Revenue (Million), by Country 2024 & 2032
- Figure 35: Europe Food Service in Korean Industry Revenue Share (%), by Country 2024 & 2032
- Figure 36: Middle East & Africa Food Service in Korean Industry Revenue (Million), by Foodservice Type 2024 & 2032
- Figure 37: Middle East & Africa Food Service in Korean Industry Revenue Share (%), by Foodservice Type 2024 & 2032
- Figure 38: Middle East & Africa Food Service in Korean Industry Revenue (Million), by Outlet 2024 & 2032
- Figure 39: Middle East & Africa Food Service in Korean Industry Revenue Share (%), by Outlet 2024 & 2032
- Figure 40: Middle East & Africa Food Service in Korean Industry Revenue (Million), by Location 2024 & 2032
- Figure 41: Middle East & Africa Food Service in Korean Industry Revenue Share (%), by Location 2024 & 2032
- Figure 42: Middle East & Africa Food Service in Korean Industry Revenue (Million), by Country 2024 & 2032
- Figure 43: Middle East & Africa Food Service in Korean Industry Revenue Share (%), by Country 2024 & 2032
- Figure 44: Asia Pacific Food Service in Korean Industry Revenue (Million), by Foodservice Type 2024 & 2032
- Figure 45: Asia Pacific Food Service in Korean Industry Revenue Share (%), by Foodservice Type 2024 & 2032
- Figure 46: Asia Pacific Food Service in Korean Industry Revenue (Million), by Outlet 2024 & 2032
- Figure 47: Asia Pacific Food Service in Korean Industry Revenue Share (%), by Outlet 2024 & 2032
- Figure 48: Asia Pacific Food Service in Korean Industry Revenue (Million), by Location 2024 & 2032
- Figure 49: Asia Pacific Food Service in Korean Industry Revenue Share (%), by Location 2024 & 2032
- Figure 50: Asia Pacific Food Service in Korean Industry Revenue (Million), by Country 2024 & 2032
- Figure 51: Asia Pacific Food Service in Korean Industry Revenue Share (%), by Country 2024 & 2032
List of Tables
- Table 1: Global Food Service in Korean Industry Revenue Million Forecast, by Region 2019 & 2032
- Table 2: Global Food Service in Korean Industry Revenue Million Forecast, by Foodservice Type 2019 & 2032
- Table 3: Global Food Service in Korean Industry Revenue Million Forecast, by Outlet 2019 & 2032
- Table 4: Global Food Service in Korean Industry Revenue Million Forecast, by Location 2019 & 2032
- Table 5: Global Food Service in Korean Industry Revenue Million Forecast, by Region 2019 & 2032
- Table 6: Global Food Service in Korean Industry Revenue Million Forecast, by Country 2019 & 2032
- Table 7: United States Food Service in Korean Industry Revenue (Million) Forecast, by Application 2019 & 2032
- Table 8: Canada Food Service in Korean Industry Revenue (Million) Forecast, by Application 2019 & 2032
- Table 9: Mexico Food Service in Korean Industry Revenue (Million) Forecast, by Application 2019 & 2032
- Table 10: Rest of North America Food Service in Korean Industry Revenue (Million) Forecast, by Application 2019 & 2032
- Table 11: Global Food Service in Korean Industry Revenue Million Forecast, by Country 2019 & 2032
- Table 12: Germany Food Service in Korean Industry Revenue (Million) Forecast, by Application 2019 & 2032
- Table 13: United Kingdom Food Service in Korean Industry Revenue (Million) Forecast, by Application 2019 & 2032
- Table 14: Italy Food Service in Korean Industry Revenue (Million) Forecast, by Application 2019 & 2032
- Table 15: Spain Food Service in Korean Industry Revenue (Million) Forecast, by Application 2019 & 2032
- Table 16: France Food Service in Korean Industry Revenue (Million) Forecast, by Application 2019 & 2032
- Table 17: Russia Food Service in Korean Industry Revenue (Million) Forecast, by Application 2019 & 2032
- Table 18: Rest of Europe Food Service in Korean Industry Revenue (Million) Forecast, by Application 2019 & 2032
- Table 19: Global Food Service in Korean Industry Revenue Million Forecast, by Country 2019 & 2032
- Table 20: China Food Service in Korean Industry Revenue (Million) Forecast, by Application 2019 & 2032
- Table 21: Japan Food Service in Korean Industry Revenue (Million) Forecast, by Application 2019 & 2032
- Table 22: India Food Service in Korean Industry Revenue (Million) Forecast, by Application 2019 & 2032
- Table 23: Australia Food Service in Korean Industry Revenue (Million) Forecast, by Application 2019 & 2032
- Table 24: Rest of Asia Pacific Food Service in Korean Industry Revenue (Million) Forecast, by Application 2019 & 2032
- Table 25: Global Food Service in Korean Industry Revenue Million Forecast, by Country 2019 & 2032
- Table 26: Brazil Food Service in Korean Industry Revenue (Million) Forecast, by Application 2019 & 2032
- Table 27: Argentina Food Service in Korean Industry Revenue (Million) Forecast, by Application 2019 & 2032
- Table 28: Rest of South America Food Service in Korean Industry Revenue (Million) Forecast, by Application 2019 & 2032
- Table 29: Global Food Service in Korean Industry Revenue Million Forecast, by Country 2019 & 2032
- Table 30: Saudi Arabia Food Service in Korean Industry Revenue (Million) Forecast, by Application 2019 & 2032
- Table 31: South Africa Food Service in Korean Industry Revenue (Million) Forecast, by Application 2019 & 2032
- Table 32: Rest of Middle East and Africa Food Service in Korean Industry Revenue (Million) Forecast, by Application 2019 & 2032
- Table 33: Global Food Service in Korean Industry Revenue Million Forecast, by Foodservice Type 2019 & 2032
- Table 34: Global Food Service in Korean Industry Revenue Million Forecast, by Outlet 2019 & 2032
- Table 35: Global Food Service in Korean Industry Revenue Million Forecast, by Location 2019 & 2032
- Table 36: Global Food Service in Korean Industry Revenue Million Forecast, by Country 2019 & 2032
- Table 37: United States Food Service in Korean Industry Revenue (Million) Forecast, by Application 2019 & 2032
- Table 38: Canada Food Service in Korean Industry Revenue (Million) Forecast, by Application 2019 & 2032
- Table 39: Mexico Food Service in Korean Industry Revenue (Million) Forecast, by Application 2019 & 2032
- Table 40: Global Food Service in Korean Industry Revenue Million Forecast, by Foodservice Type 2019 & 2032
- Table 41: Global Food Service in Korean Industry Revenue Million Forecast, by Outlet 2019 & 2032
- Table 42: Global Food Service in Korean Industry Revenue Million Forecast, by Location 2019 & 2032
- Table 43: Global Food Service in Korean Industry Revenue Million Forecast, by Country 2019 & 2032
- Table 44: Brazil Food Service in Korean Industry Revenue (Million) Forecast, by Application 2019 & 2032
- Table 45: Argentina Food Service in Korean Industry Revenue (Million) Forecast, by Application 2019 & 2032
- Table 46: Rest of South America Food Service in Korean Industry Revenue (Million) Forecast, by Application 2019 & 2032
- Table 47: Global Food Service in Korean Industry Revenue Million Forecast, by Foodservice Type 2019 & 2032
- Table 48: Global Food Service in Korean Industry Revenue Million Forecast, by Outlet 2019 & 2032
- Table 49: Global Food Service in Korean Industry Revenue Million Forecast, by Location 2019 & 2032
- Table 50: Global Food Service in Korean Industry Revenue Million Forecast, by Country 2019 & 2032
- Table 51: United Kingdom Food Service in Korean Industry Revenue (Million) Forecast, by Application 2019 & 2032
- Table 52: Germany Food Service in Korean Industry Revenue (Million) Forecast, by Application 2019 & 2032
- Table 53: France Food Service in Korean Industry Revenue (Million) Forecast, by Application 2019 & 2032
- Table 54: Italy Food Service in Korean Industry Revenue (Million) Forecast, by Application 2019 & 2032
- Table 55: Spain Food Service in Korean Industry Revenue (Million) Forecast, by Application 2019 & 2032
- Table 56: Russia Food Service in Korean Industry Revenue (Million) Forecast, by Application 2019 & 2032
- Table 57: Benelux Food Service in Korean Industry Revenue (Million) Forecast, by Application 2019 & 2032
- Table 58: Nordics Food Service in Korean Industry Revenue (Million) Forecast, by Application 2019 & 2032
- Table 59: Rest of Europe Food Service in Korean Industry Revenue (Million) Forecast, by Application 2019 & 2032
- Table 60: Global Food Service in Korean Industry Revenue Million Forecast, by Foodservice Type 2019 & 2032
- Table 61: Global Food Service in Korean Industry Revenue Million Forecast, by Outlet 2019 & 2032
- Table 62: Global Food Service in Korean Industry Revenue Million Forecast, by Location 2019 & 2032
- Table 63: Global Food Service in Korean Industry Revenue Million Forecast, by Country 2019 & 2032
- Table 64: Turkey Food Service in Korean Industry Revenue (Million) Forecast, by Application 2019 & 2032
- Table 65: Israel Food Service in Korean Industry Revenue (Million) Forecast, by Application 2019 & 2032
- Table 66: GCC Food Service in Korean Industry Revenue (Million) Forecast, by Application 2019 & 2032
- Table 67: North Africa Food Service in Korean Industry Revenue (Million) Forecast, by Application 2019 & 2032
- Table 68: South Africa Food Service in Korean Industry Revenue (Million) Forecast, by Application 2019 & 2032
- Table 69: Rest of Middle East & Africa Food Service in Korean Industry Revenue (Million) Forecast, by Application 2019 & 2032
- Table 70: Global Food Service in Korean Industry Revenue Million Forecast, by Foodservice Type 2019 & 2032
- Table 71: Global Food Service in Korean Industry Revenue Million Forecast, by Outlet 2019 & 2032
- Table 72: Global Food Service in Korean Industry Revenue Million Forecast, by Location 2019 & 2032
- Table 73: Global Food Service in Korean Industry Revenue Million Forecast, by Country 2019 & 2032
- Table 74: China Food Service in Korean Industry Revenue (Million) Forecast, by Application 2019 & 2032
- Table 75: India Food Service in Korean Industry Revenue (Million) Forecast, by Application 2019 & 2032
- Table 76: Japan Food Service in Korean Industry Revenue (Million) Forecast, by Application 2019 & 2032
- Table 77: South Korea Food Service in Korean Industry Revenue (Million) Forecast, by Application 2019 & 2032
- Table 78: ASEAN Food Service in Korean Industry Revenue (Million) Forecast, by Application 2019 & 2032
- Table 79: Oceania Food Service in Korean Industry Revenue (Million) Forecast, by Application 2019 & 2032
- Table 80: Rest of Asia Pacific Food Service in Korean Industry Revenue (Million) Forecast, by Application 2019 & 2032
Frequently Asked Questions
1. What is the projected Compound Annual Growth Rate (CAGR) of the Food Service in Korean Industry?
The projected CAGR is approximately 5.60%.
2. Which companies are prominent players in the Food Service in Korean Industry?
Key companies in the market include Shinsegae Food Co Ltd, Yum! Brands Inc, Isac Co Ltd, Inspire Brands Inc, CJ Foodville Corporation, Seven & I Holdings Co Ltd, Kyochon Food&Beverage Co Ltd, Doctor's Associate Inc, MP DAESAN Inc, Genesis Co Ltd, Domino's Pizza Inc, Starbucks Corporation, Restaurant Brands International Inc, Royal T Group Pte Ltd, McDonald's Corporation, Mom's Touch & Co.
3. What are the main segments of the Food Service in Korean Industry?
The market segments include Foodservice Type, Outlet, Location.
4. Can you provide details about the market size?
The market size is estimated to be USD XX Million as of 2022.
5. What are some drivers contributing to market growth?
Growing Demand for Cocoa Butter Equivalents Among Food Manufacturers; Rising Application in Food Industry.
6. What are the notable trends driving market growth?
High demand for traditional cuisines and increased spending on dining increase the sales.
7. Are there any restraints impacting market growth?
Health Concerns Pertaining to the Excessive Consumption of Fats and Oils.
8. Can you provide examples of recent developments in the market?
April 2023: Shinsegae Food introduced a 100% plant-based burger called Better Burger. Instead of using animal products like milk and eggs, the burger uses substitute meat, cheese, and buns created from plant-based proteins like soybeans and cashew nuts.March 2023: Yum! Brands Inc. teamed up with a Korean private equity fund to acquire KFC Korea Co.February 2023: McDonald's Korea collaborated with NewJeans and introduced a special crispy chicken sandwich meal.
9. What pricing options are available for accessing the report?
Pricing options include single-user, multi-user, and enterprise licenses priced at USD 3800, USD 4500, and USD 5800 respectively.
10. Is the market size provided in terms of value or volume?
The market size is provided in terms of value, measured in Million.
11. Are there any specific market keywords associated with the report?
Yes, the market keyword associated with the report is "Food Service in Korean Industry," which aids in identifying and referencing the specific market segment covered.
12. How do I determine which pricing option suits my needs best?
The pricing options vary based on user requirements and access needs. Individual users may opt for single-user licenses, while businesses requiring broader access may choose multi-user or enterprise licenses for cost-effective access to the report.
13. Are there any additional resources or data provided in the Food Service in Korean Industry report?
While the report offers comprehensive insights, it's advisable to review the specific contents or supplementary materials provided to ascertain if additional resources or data are available.
14. How can I stay updated on further developments or reports in the Food Service in Korean Industry?
To stay informed about further developments, trends, and reports in the Food Service in Korean Industry, consider subscribing to industry newsletters, following relevant companies and organizations, or regularly checking reputable industry news sources and publications.
Methodology
Step 1 - Identification of Relevant Samples Size from Population Database


Step 2 - Approaches for Defining Global Market Size (Value, Volume* & Price*)

Note*: In applicable scenarios
Step 3 - Data Sources
Primary Research
- Web Analytics
- Survey Reports
- Research Institute
- Latest Research Reports
- Opinion Leaders
Secondary Research
- Annual Reports
- White Paper
- Latest Press Release
- Industry Association
- Paid Database
- Investor Presentations

Step 4 - Data Triangulation
Involves using different sources of information in order to increase the validity of a study
These sources are likely to be stakeholders in a program - participants, other researchers, program staff, other community members, and so on.
Then we put all data in single framework & apply various statistical tools to find out the dynamic on the market.
During the analysis stage, feedback from the stakeholder groups would be compared to determine areas of agreement as well as areas of divergence


