
Key Insights
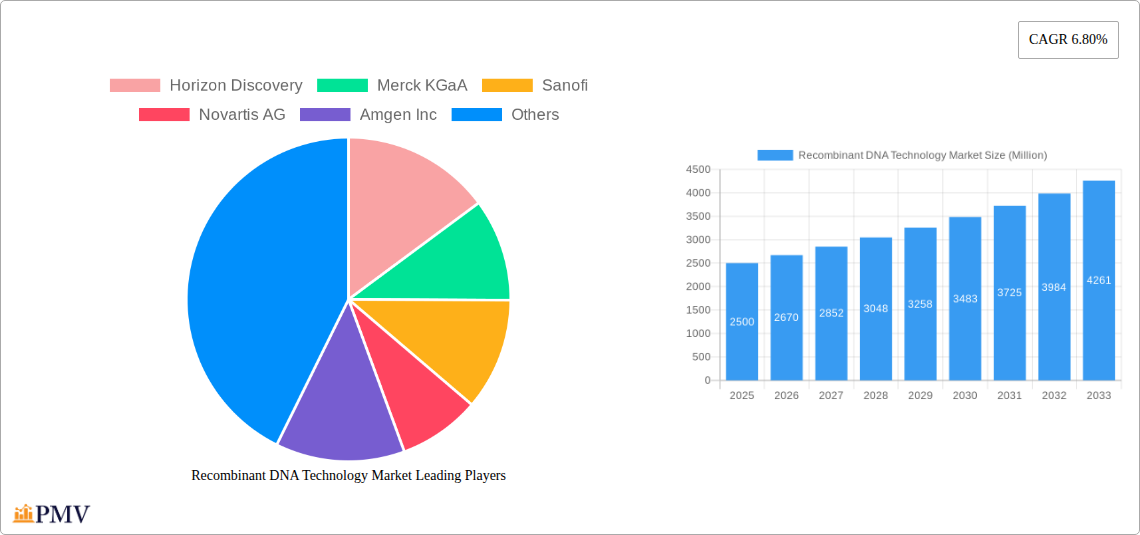
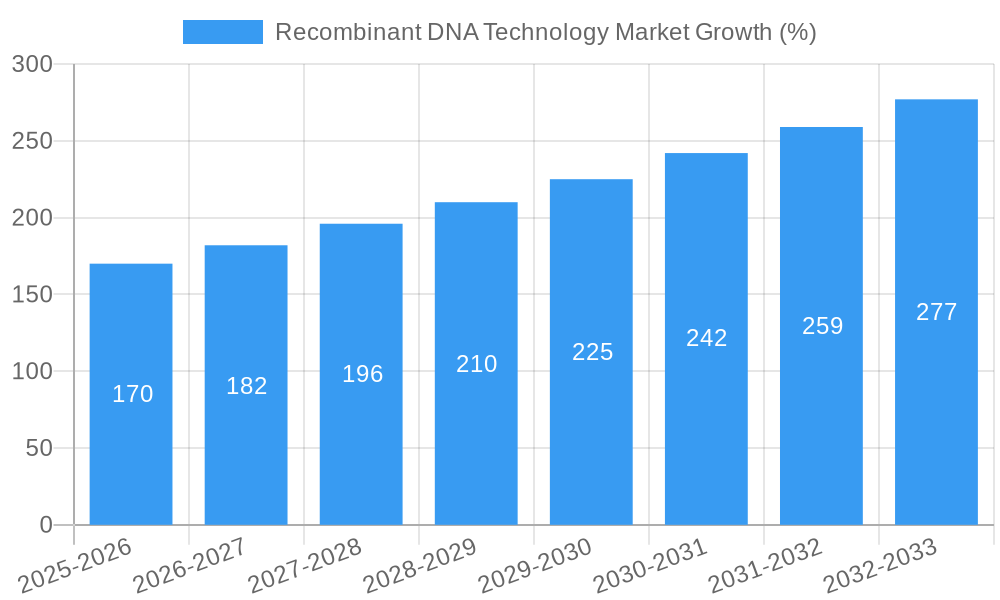
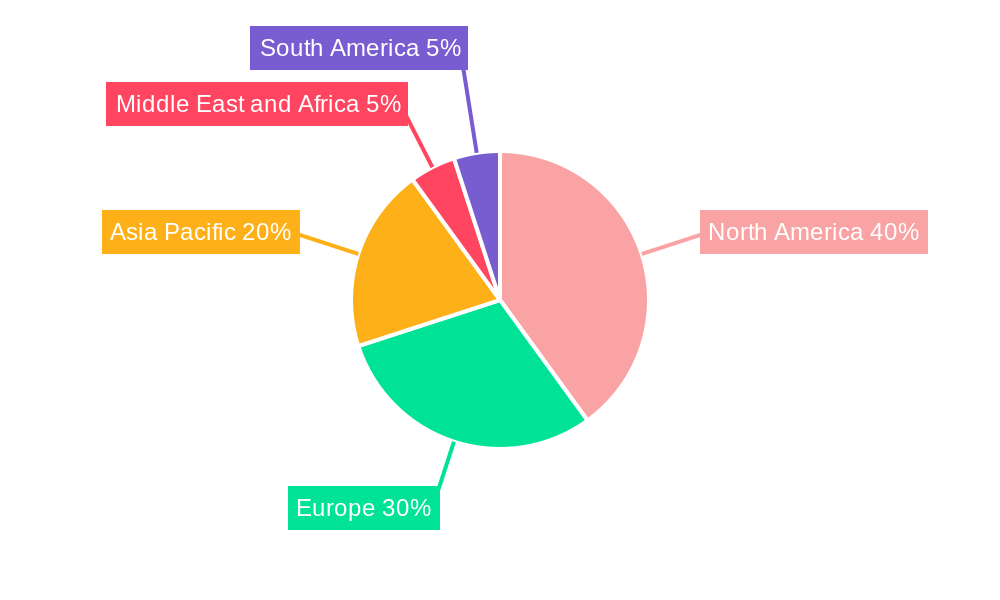
The Recombinant DNA Technology market is experiencing robust growth, projected to reach a substantial size by 2033. A 6.80% CAGR indicates a consistently expanding market driven by several key factors. The increasing prevalence of chronic diseases necessitates advanced therapeutic development, fueling demand for recombinant DNA technology in the pharmaceutical and biotechnology sectors. Furthermore, advancements in gene editing techniques and the rising adoption of personalized medicine are significantly boosting market expansion. Academic and government research institutions are major contributors to the market's growth, driving innovation in areas like vaccine development and agricultural biotechnology. The segment breakdown reveals a strong emphasis on medical applications within the product category, while the expression system and cloning vector components are crucial for driving the technology forward. Geographic analysis reveals North America as a dominant market player, attributable to its robust healthcare infrastructure and substantial investments in biotechnology research. However, Asia Pacific is poised for significant growth owing to expanding economies and increasing government support for research and development initiatives. While regulatory hurdles and ethical concerns might present some challenges, the overall market trajectory remains positive, supported by continuous technological advancements and the escalating need for effective solutions in healthcare and other sectors. The diverse applications of recombinant DNA technology across various sectors ensure sustained demand and ongoing market expansion throughout the forecast period.
The market's segmentation highlights the pivotal role of biotechnology and pharmaceutical companies as key end-users, driving demand for recombinant DNA technologies to develop novel therapeutics and vaccines. The "Medical" product segment dominates, showcasing the significant contribution of recombinant DNA technology in treating a wide range of diseases. Within applications, "Health and Disease" commands a substantial share, followed by "Food and Agriculture," underscoring the technology's versatility across sectors. The forecast period (2025-2033) suggests continued growth, with North America and Europe maintaining their leading positions, but significant growth potential in Asia-Pacific due to expanding research capabilities and the rising focus on improving healthcare outcomes in developing nations. The competitive landscape is characterized by both large multinational corporations and smaller specialized firms, driving innovation and product diversification within the market.
Recombinant DNA Technology Market: A Comprehensive Report (2019-2033)
This detailed report provides a comprehensive analysis of the Recombinant DNA Technology market, offering invaluable insights for industry stakeholders. Covering the period from 2019 to 2033, with a base year of 2025 and a forecast period of 2025-2033, this report meticulously examines market dynamics, growth drivers, competitive landscapes, and future opportunities. The study period includes the historical period (2019-2024) and the forecast period (2025-2033). The report is structured to deliver actionable intelligence across key market segments, empowering informed decision-making. The total market size is projected to reach xx Million by 2033.
Recombinant DNA Technology Market Market Structure & Competitive Dynamics
The Recombinant DNA Technology market exhibits a moderately consolidated structure, with a few major players holding significant market share. The market's competitive landscape is characterized by intense innovation, driven by the continuous development of novel expression systems, cloning vectors, and applications. Regulatory frameworks, particularly concerning safety and ethical considerations, significantly influence market dynamics. Several successful mergers and acquisitions (M&A) have shaped the competitive landscape, with deal values averaging xx Million in recent years. Product substitutes, such as traditional methods of protein production, pose a challenge, but the superior efficiency and precision of recombinant DNA technology sustain its market dominance. End-user trends show a growing preference for customized solutions and increased demand from the biotechnology and pharmaceutical sectors.
- Market Concentration: Moderately consolidated, with top 5 players holding approximately xx% of the market share in 2024.
- Innovation Ecosystems: Robust, characterized by collaborations between academic institutions, research organizations, and industry players.
- Regulatory Frameworks: Stringent regulations concerning safety, efficacy, and intellectual property rights influence market access and growth.
- M&A Activity: Significant activity in recent years, with an estimated xx deals valued at a total of xx Million between 2020 and 2024. Examples include (include specific examples if available, otherwise use "strategic acquisitions aimed at expanding product portfolios and geographic reach").
- End-User Trends: Increasing demand from biotechnology and pharmaceutical companies for customized solutions and large-scale production capacities.
Recombinant DNA Technology Market Industry Trends & Insights
The Recombinant DNA Technology market is experiencing robust growth, driven by a confluence of factors. The increasing prevalence of chronic diseases globally is fueling the demand for innovative therapies produced using recombinant DNA technology. Technological advancements, such as CRISPR-Cas9 gene editing, are further enhancing the precision and efficiency of recombinant DNA techniques. Consumer preferences are increasingly aligned with personalized medicine and targeted therapies, which often rely on this technology. The market's competitive dynamics are characterized by ongoing innovation, strategic alliances, and aggressive product launches. The Compound Annual Growth Rate (CAGR) during the forecast period (2025-2033) is estimated to be xx%, with significant market penetration expected in emerging economies.
Dominant Markets & Segments in Recombinant DNA Technology Market
The North American region currently holds the largest market share in recombinant DNA technology, driven by substantial investments in research and development, a robust regulatory framework, and the presence of major pharmaceutical and biotechnology companies. Within the segments, the Biotechnology and Pharmaceutical Companies end-user segment dominates, accounting for approximately xx% of the market. The Medical product segment holds the largest share within the product category. The Health and Disease application segment dominates application-wise, with strong growth anticipated for the Food and Agriculture and Environmental sectors.
Key Drivers for North American Dominance:
- High R&D investments.
- Presence of major pharmaceutical and biotechnology firms.
- Supportive regulatory environment.
Dominant End-User Segment: Biotechnology and Pharmaceutical Companies, driven by their substantial R&D budgets and need for large-scale production.
Dominant Product Segment: Medical products, due to their extensive application across various therapeutic areas.
Dominant Application Segment: Health and Disease, representing the largest market share, driven by increasing prevalence of chronic diseases and rising demand for biopharmaceuticals.
Recombinant DNA Technology Market Product Innovations
Recent product innovations include advanced expression systems enabling high-yield protein production and novel cloning vectors designed for increased efficiency and versatility. These advancements cater to the growing need for faster development timelines and customized solutions in the pharmaceutical and biotechnology industries. The market is witnessing a clear shift towards automation and high-throughput screening to enhance production efficiency and cost-effectiveness. Such innovations enhance market competitiveness and drive adoption across various applications.
Report Segmentation & Scope
This report segments the Recombinant DNA Technology market by end-user (Biotechnology and Pharmaceutical Companies, Academic and Government Research Institutes, Other End Users), product (Medical, Non-medical Vaccines), component (Expression System, Cloning Vector), and application (Food and Agriculture, Health and Disease, Environment, Other Applications). Each segment's growth trajectory, market size, and competitive dynamics are analyzed in detail, providing a granular understanding of the market landscape. For example, the Biotechnology and Pharmaceutical Companies segment is expected to witness a CAGR of xx% during the forecast period, while the Medical products segment is projected to account for xx Million in revenue by 2033. Competitive dynamics vary across segments, with some characterized by intense competition and others exhibiting niche players.
Key Drivers of Recombinant DNA Technology Market Growth
Technological advancements, such as CRISPR-Cas9 gene editing and improved expression systems, are key growth drivers. The rising prevalence of chronic diseases and the increasing demand for personalized medicine are further boosting market growth. Favorable regulatory environments in several regions are also supporting market expansion. Finally, strategic investments in R&D and the growing adoption of recombinant DNA technology in various sectors, including agriculture and environmental remediation, contribute to market expansion.
Challenges in the Recombinant DNA Technology Market Sector
Stringent regulatory approvals and high development costs pose significant challenges. Supply chain disruptions and the dependence on specialized expertise can impact production efficiency. Moreover, intense competition among established players and emerging startups necessitates continuous innovation to maintain market competitiveness. These factors can collectively limit the market's growth trajectory. For instance, regulatory delays can cause significant cost overruns, delaying the launch of new products.
Leading Players in the Recombinant DNA Technology Market Market
- Horizon Discovery
- Merck KGaA
- Sanofi
- Novartis AG
- Amgen Inc
- Eli Lilly and Company
- New England Biolabs
- F Hoffmann-La Roche Ltd (Genentech Inc)
- GenScript
- Novo Nordisk A/S
- Syngene International Limited
- Pfizer Inc
Key Developments in Recombinant DNA Technology Market Sector
- March 2022: VBI Vaccines Inc. launched PreHevbrio (Recombinant Hepatitis B Vaccine) in the United States.
- February 2022: VBI Vaccines Inc. received positive opinion from the European Medicines Agency for PreHevbri (Hepatitis B vaccine).
These launches signify a significant advancement in the prevention of Hepatitis B, showcasing the potential of recombinant DNA technology in vaccine development and highlighting the market's growth potential.
Strategic Recombinant DNA Technology Market Market Outlook
The Recombinant DNA Technology market is poised for significant growth, driven by continued technological advancements, increasing demand for personalized medicine, and expanding applications across various sectors. Strategic partnerships, collaborations, and investments in R&D are expected to further fuel market expansion. Emerging markets present significant opportunities for growth, and companies focusing on innovation and efficient production processes are well-positioned to capture substantial market share. The market's future is bright, with promising potential for novel therapeutics and technological breakthroughs.
Recombinant DNA Technology Market Segmentation
-
1. Product
-
1.1. Medical
- 1.1.1. Therapeutic Agent
- 1.1.2. Human Protein
- 1.1.3. Vaccine
-
1.2. Non-medical
- 1.2.1. Biotech Crops
- 1.2.2. Specialty Chemicals
- 1.2.3. Other Non-medical Products
-
1.1. Medical
-
2. Component
- 2.1. Expression System
- 2.2. Cloning Vector
-
3. Application
- 3.1. Food and Agriculture
- 3.2. Health and Disease
- 3.3. Environment
- 3.4. Other Applications
-
4. End User
- 4.1. Biotechnology and Pharmaceutical Companies
- 4.2. Academic and Government Research Institutes
- 4.3. Other End Users
Recombinant DNA Technology Market Segmentation By Geography
-
1. North America
- 1.1. United States
- 1.2. Canada
- 1.3. Mexico
-
2. Europe
- 2.1. Germany
- 2.2. United Kingdom
- 2.3. France
- 2.4. Italy
- 2.5. Spain
- 2.6. Rest of Europe
-
3. Asia Pacific
- 3.1. China
- 3.2. Japan
- 3.3. India
- 3.4. Australia
- 3.5. South korea
- 3.6. Rest of Asia Pacific
-
4. Middle East and Africa
- 4.1. GCC
- 4.2. South Africa
- 4.3. Rest of Middle East and Africa
-
5. South America
- 5.1. Brazil
- 5.2. Argentina
- 5.3. Rest of South America
Recombinant DNA Technology Market REPORT HIGHLIGHTS
| Aspects | Details |
|---|---|
| Study Period | 2019-2033 |
| Base Year | 2024 |
| Estimated Year | 2025 |
| Forecast Period | 2025-2033 |
| Historical Period | 2019-2024 |
| Growth Rate | CAGR of 6.80% from 2019-2033 |
| Segmentation |
|
Table of Contents
- 1. Introduction
- 1.1. Research Scope
- 1.2. Market Segmentation
- 1.3. Research Methodology
- 1.4. Definitions and Assumptions
- 2. Executive Summary
- 2.1. Introduction
- 3. Market Dynamics
- 3.1. Introduction
- 3.2. Market Drivers
- 3.2.1. Technological Advancements in Genomics; Expansion of Biopharmaceutical Industry; Increasing Demand and Applications of Recombinant/ Genetically Modified Products
- 3.3. Market Restrains
- 3.3.1 Regulatory
- 3.3.2 Scientific
- 3.3.3 and Ethical Challenges Associated with Gene Therapy
- 3.4. Market Trends
- 3.4.1. The Food and Agriculture Segment is Expected to Register the High CAGR Over the Forecast Period
- 4. Market Factor Analysis
- 4.1. Porters Five Forces
- 4.2. Supply/Value Chain
- 4.3. PESTEL analysis
- 4.4. Market Entropy
- 4.5. Patent/Trademark Analysis
- 5. Global Recombinant DNA Technology Market Analysis, Insights and Forecast, 2019-2031
- 5.1. Market Analysis, Insights and Forecast - by Product
- 5.1.1. Medical
- 5.1.1.1. Therapeutic Agent
- 5.1.1.2. Human Protein
- 5.1.1.3. Vaccine
- 5.1.2. Non-medical
- 5.1.2.1. Biotech Crops
- 5.1.2.2. Specialty Chemicals
- 5.1.2.3. Other Non-medical Products
- 5.1.1. Medical
- 5.2. Market Analysis, Insights and Forecast - by Component
- 5.2.1. Expression System
- 5.2.2. Cloning Vector
- 5.3. Market Analysis, Insights and Forecast - by Application
- 5.3.1. Food and Agriculture
- 5.3.2. Health and Disease
- 5.3.3. Environment
- 5.3.4. Other Applications
- 5.4. Market Analysis, Insights and Forecast - by End User
- 5.4.1. Biotechnology and Pharmaceutical Companies
- 5.4.2. Academic and Government Research Institutes
- 5.4.3. Other End Users
- 5.5. Market Analysis, Insights and Forecast - by Region
- 5.5.1. North America
- 5.5.2. Europe
- 5.5.3. Asia Pacific
- 5.5.4. Middle East and Africa
- 5.5.5. South America
- 5.1. Market Analysis, Insights and Forecast - by Product
- 6. North America Recombinant DNA Technology Market Analysis, Insights and Forecast, 2019-2031
- 6.1. Market Analysis, Insights and Forecast - by Product
- 6.1.1. Medical
- 6.1.1.1. Therapeutic Agent
- 6.1.1.2. Human Protein
- 6.1.1.3. Vaccine
- 6.1.2. Non-medical
- 6.1.2.1. Biotech Crops
- 6.1.2.2. Specialty Chemicals
- 6.1.2.3. Other Non-medical Products
- 6.1.1. Medical
- 6.2. Market Analysis, Insights and Forecast - by Component
- 6.2.1. Expression System
- 6.2.2. Cloning Vector
- 6.3. Market Analysis, Insights and Forecast - by Application
- 6.3.1. Food and Agriculture
- 6.3.2. Health and Disease
- 6.3.3. Environment
- 6.3.4. Other Applications
- 6.4. Market Analysis, Insights and Forecast - by End User
- 6.4.1. Biotechnology and Pharmaceutical Companies
- 6.4.2. Academic and Government Research Institutes
- 6.4.3. Other End Users
- 6.1. Market Analysis, Insights and Forecast - by Product
- 7. Europe Recombinant DNA Technology Market Analysis, Insights and Forecast, 2019-2031
- 7.1. Market Analysis, Insights and Forecast - by Product
- 7.1.1. Medical
- 7.1.1.1. Therapeutic Agent
- 7.1.1.2. Human Protein
- 7.1.1.3. Vaccine
- 7.1.2. Non-medical
- 7.1.2.1. Biotech Crops
- 7.1.2.2. Specialty Chemicals
- 7.1.2.3. Other Non-medical Products
- 7.1.1. Medical
- 7.2. Market Analysis, Insights and Forecast - by Component
- 7.2.1. Expression System
- 7.2.2. Cloning Vector
- 7.3. Market Analysis, Insights and Forecast - by Application
- 7.3.1. Food and Agriculture
- 7.3.2. Health and Disease
- 7.3.3. Environment
- 7.3.4. Other Applications
- 7.4. Market Analysis, Insights and Forecast - by End User
- 7.4.1. Biotechnology and Pharmaceutical Companies
- 7.4.2. Academic and Government Research Institutes
- 7.4.3. Other End Users
- 7.1. Market Analysis, Insights and Forecast - by Product
- 8. Asia Pacific Recombinant DNA Technology Market Analysis, Insights and Forecast, 2019-2031
- 8.1. Market Analysis, Insights and Forecast - by Product
- 8.1.1. Medical
- 8.1.1.1. Therapeutic Agent
- 8.1.1.2. Human Protein
- 8.1.1.3. Vaccine
- 8.1.2. Non-medical
- 8.1.2.1. Biotech Crops
- 8.1.2.2. Specialty Chemicals
- 8.1.2.3. Other Non-medical Products
- 8.1.1. Medical
- 8.2. Market Analysis, Insights and Forecast - by Component
- 8.2.1. Expression System
- 8.2.2. Cloning Vector
- 8.3. Market Analysis, Insights and Forecast - by Application
- 8.3.1. Food and Agriculture
- 8.3.2. Health and Disease
- 8.3.3. Environment
- 8.3.4. Other Applications
- 8.4. Market Analysis, Insights and Forecast - by End User
- 8.4.1. Biotechnology and Pharmaceutical Companies
- 8.4.2. Academic and Government Research Institutes
- 8.4.3. Other End Users
- 8.1. Market Analysis, Insights and Forecast - by Product
- 9. Middle East and Africa Recombinant DNA Technology Market Analysis, Insights and Forecast, 2019-2031
- 9.1. Market Analysis, Insights and Forecast - by Product
- 9.1.1. Medical
- 9.1.1.1. Therapeutic Agent
- 9.1.1.2. Human Protein
- 9.1.1.3. Vaccine
- 9.1.2. Non-medical
- 9.1.2.1. Biotech Crops
- 9.1.2.2. Specialty Chemicals
- 9.1.2.3. Other Non-medical Products
- 9.1.1. Medical
- 9.2. Market Analysis, Insights and Forecast - by Component
- 9.2.1. Expression System
- 9.2.2. Cloning Vector
- 9.3. Market Analysis, Insights and Forecast - by Application
- 9.3.1. Food and Agriculture
- 9.3.2. Health and Disease
- 9.3.3. Environment
- 9.3.4. Other Applications
- 9.4. Market Analysis, Insights and Forecast - by End User
- 9.4.1. Biotechnology and Pharmaceutical Companies
- 9.4.2. Academic and Government Research Institutes
- 9.4.3. Other End Users
- 9.1. Market Analysis, Insights and Forecast - by Product
- 10. South America Recombinant DNA Technology Market Analysis, Insights and Forecast, 2019-2031
- 10.1. Market Analysis, Insights and Forecast - by Product
- 10.1.1. Medical
- 10.1.1.1. Therapeutic Agent
- 10.1.1.2. Human Protein
- 10.1.1.3. Vaccine
- 10.1.2. Non-medical
- 10.1.2.1. Biotech Crops
- 10.1.2.2. Specialty Chemicals
- 10.1.2.3. Other Non-medical Products
- 10.1.1. Medical
- 10.2. Market Analysis, Insights and Forecast - by Component
- 10.2.1. Expression System
- 10.2.2. Cloning Vector
- 10.3. Market Analysis, Insights and Forecast - by Application
- 10.3.1. Food and Agriculture
- 10.3.2. Health and Disease
- 10.3.3. Environment
- 10.3.4. Other Applications
- 10.4. Market Analysis, Insights and Forecast - by End User
- 10.4.1. Biotechnology and Pharmaceutical Companies
- 10.4.2. Academic and Government Research Institutes
- 10.4.3. Other End Users
- 10.1. Market Analysis, Insights and Forecast - by Product
- 11. North America Recombinant DNA Technology Market Analysis, Insights and Forecast, 2019-2031
- 11.1. Market Analysis, Insights and Forecast - By Country/Sub-region
- 11.1.1 United States
- 11.1.2 Canada
- 11.1.3 Mexico
- 12. Europe Recombinant DNA Technology Market Analysis, Insights and Forecast, 2019-2031
- 12.1. Market Analysis, Insights and Forecast - By Country/Sub-region
- 12.1.1 Germany
- 12.1.2 United Kingdom
- 12.1.3 France
- 12.1.4 Italy
- 12.1.5 Spain
- 12.1.6 Rest of Europe
- 13. Asia Pacific Recombinant DNA Technology Market Analysis, Insights and Forecast, 2019-2031
- 13.1. Market Analysis, Insights and Forecast - By Country/Sub-region
- 13.1.1 China
- 13.1.2 Japan
- 13.1.3 India
- 13.1.4 Australia
- 13.1.5 South korea
- 13.1.6 Rest of Asia Pacific
- 14. Middle East and Africa Recombinant DNA Technology Market Analysis, Insights and Forecast, 2019-2031
- 14.1. Market Analysis, Insights and Forecast - By Country/Sub-region
- 14.1.1 GCC
- 14.1.2 South Africa
- 14.1.3 Rest of Middle East and Africa
- 15. South America Recombinant DNA Technology Market Analysis, Insights and Forecast, 2019-2031
- 15.1. Market Analysis, Insights and Forecast - By Country/Sub-region
- 15.1.1 Brazil
- 15.1.2 Argentina
- 15.1.3 Rest of South America
- 16. Competitive Analysis
- 16.1. Global Market Share Analysis 2024
- 16.2. Company Profiles
- 16.2.1 Horizon Discovery
- 16.2.1.1. Overview
- 16.2.1.2. Products
- 16.2.1.3. SWOT Analysis
- 16.2.1.4. Recent Developments
- 16.2.1.5. Financials (Based on Availability)
- 16.2.2 Merck KGaA
- 16.2.2.1. Overview
- 16.2.2.2. Products
- 16.2.2.3. SWOT Analysis
- 16.2.2.4. Recent Developments
- 16.2.2.5. Financials (Based on Availability)
- 16.2.3 Sanofi
- 16.2.3.1. Overview
- 16.2.3.2. Products
- 16.2.3.3. SWOT Analysis
- 16.2.3.4. Recent Developments
- 16.2.3.5. Financials (Based on Availability)
- 16.2.4 Novartis AG
- 16.2.4.1. Overview
- 16.2.4.2. Products
- 16.2.4.3. SWOT Analysis
- 16.2.4.4. Recent Developments
- 16.2.4.5. Financials (Based on Availability)
- 16.2.5 Amgen Inc
- 16.2.5.1. Overview
- 16.2.5.2. Products
- 16.2.5.3. SWOT Analysis
- 16.2.5.4. Recent Developments
- 16.2.5.5. Financials (Based on Availability)
- 16.2.6 Eli Lilly and Company
- 16.2.6.1. Overview
- 16.2.6.2. Products
- 16.2.6.3. SWOT Analysis
- 16.2.6.4. Recent Developments
- 16.2.6.5. Financials (Based on Availability)
- 16.2.7 New England Biolabs
- 16.2.7.1. Overview
- 16.2.7.2. Products
- 16.2.7.3. SWOT Analysis
- 16.2.7.4. Recent Developments
- 16.2.7.5. Financials (Based on Availability)
- 16.2.8 F Hoffmann-La Roche Ltd (Genentech Inc )
- 16.2.8.1. Overview
- 16.2.8.2. Products
- 16.2.8.3. SWOT Analysis
- 16.2.8.4. Recent Developments
- 16.2.8.5. Financials (Based on Availability)
- 16.2.9 GenScript
- 16.2.9.1. Overview
- 16.2.9.2. Products
- 16.2.9.3. SWOT Analysis
- 16.2.9.4. Recent Developments
- 16.2.9.5. Financials (Based on Availability)
- 16.2.10 Novo Nordisk A/S
- 16.2.10.1. Overview
- 16.2.10.2. Products
- 16.2.10.3. SWOT Analysis
- 16.2.10.4. Recent Developments
- 16.2.10.5. Financials (Based on Availability)
- 16.2.11 Syngene International Limited
- 16.2.11.1. Overview
- 16.2.11.2. Products
- 16.2.11.3. SWOT Analysis
- 16.2.11.4. Recent Developments
- 16.2.11.5. Financials (Based on Availability)
- 16.2.12 Pfizer Inc
- 16.2.12.1. Overview
- 16.2.12.2. Products
- 16.2.12.3. SWOT Analysis
- 16.2.12.4. Recent Developments
- 16.2.12.5. Financials (Based on Availability)
- 16.2.1 Horizon Discovery
List of Figures
- Figure 1: Global Recombinant DNA Technology Market Revenue Breakdown (Million, %) by Region 2024 & 2032
- Figure 2: Global Recombinant DNA Technology Market Volume Breakdown (K Unit, %) by Region 2024 & 2032
- Figure 3: North America Recombinant DNA Technology Market Revenue (Million), by Country 2024 & 2032
- Figure 4: North America Recombinant DNA Technology Market Volume (K Unit), by Country 2024 & 2032
- Figure 5: North America Recombinant DNA Technology Market Revenue Share (%), by Country 2024 & 2032
- Figure 6: North America Recombinant DNA Technology Market Volume Share (%), by Country 2024 & 2032
- Figure 7: Europe Recombinant DNA Technology Market Revenue (Million), by Country 2024 & 2032
- Figure 8: Europe Recombinant DNA Technology Market Volume (K Unit), by Country 2024 & 2032
- Figure 9: Europe Recombinant DNA Technology Market Revenue Share (%), by Country 2024 & 2032
- Figure 10: Europe Recombinant DNA Technology Market Volume Share (%), by Country 2024 & 2032
- Figure 11: Asia Pacific Recombinant DNA Technology Market Revenue (Million), by Country 2024 & 2032
- Figure 12: Asia Pacific Recombinant DNA Technology Market Volume (K Unit), by Country 2024 & 2032
- Figure 13: Asia Pacific Recombinant DNA Technology Market Revenue Share (%), by Country 2024 & 2032
- Figure 14: Asia Pacific Recombinant DNA Technology Market Volume Share (%), by Country 2024 & 2032
- Figure 15: Middle East and Africa Recombinant DNA Technology Market Revenue (Million), by Country 2024 & 2032
- Figure 16: Middle East and Africa Recombinant DNA Technology Market Volume (K Unit), by Country 2024 & 2032
- Figure 17: Middle East and Africa Recombinant DNA Technology Market Revenue Share (%), by Country 2024 & 2032
- Figure 18: Middle East and Africa Recombinant DNA Technology Market Volume Share (%), by Country 2024 & 2032
- Figure 19: South America Recombinant DNA Technology Market Revenue (Million), by Country 2024 & 2032
- Figure 20: South America Recombinant DNA Technology Market Volume (K Unit), by Country 2024 & 2032
- Figure 21: South America Recombinant DNA Technology Market Revenue Share (%), by Country 2024 & 2032
- Figure 22: South America Recombinant DNA Technology Market Volume Share (%), by Country 2024 & 2032
- Figure 23: North America Recombinant DNA Technology Market Revenue (Million), by Product 2024 & 2032
- Figure 24: North America Recombinant DNA Technology Market Volume (K Unit), by Product 2024 & 2032
- Figure 25: North America Recombinant DNA Technology Market Revenue Share (%), by Product 2024 & 2032
- Figure 26: North America Recombinant DNA Technology Market Volume Share (%), by Product 2024 & 2032
- Figure 27: North America Recombinant DNA Technology Market Revenue (Million), by Component 2024 & 2032
- Figure 28: North America Recombinant DNA Technology Market Volume (K Unit), by Component 2024 & 2032
- Figure 29: North America Recombinant DNA Technology Market Revenue Share (%), by Component 2024 & 2032
- Figure 30: North America Recombinant DNA Technology Market Volume Share (%), by Component 2024 & 2032
- Figure 31: North America Recombinant DNA Technology Market Revenue (Million), by Application 2024 & 2032
- Figure 32: North America Recombinant DNA Technology Market Volume (K Unit), by Application 2024 & 2032
- Figure 33: North America Recombinant DNA Technology Market Revenue Share (%), by Application 2024 & 2032
- Figure 34: North America Recombinant DNA Technology Market Volume Share (%), by Application 2024 & 2032
- Figure 35: North America Recombinant DNA Technology Market Revenue (Million), by End User 2024 & 2032
- Figure 36: North America Recombinant DNA Technology Market Volume (K Unit), by End User 2024 & 2032
- Figure 37: North America Recombinant DNA Technology Market Revenue Share (%), by End User 2024 & 2032
- Figure 38: North America Recombinant DNA Technology Market Volume Share (%), by End User 2024 & 2032
- Figure 39: North America Recombinant DNA Technology Market Revenue (Million), by Country 2024 & 2032
- Figure 40: North America Recombinant DNA Technology Market Volume (K Unit), by Country 2024 & 2032
- Figure 41: North America Recombinant DNA Technology Market Revenue Share (%), by Country 2024 & 2032
- Figure 42: North America Recombinant DNA Technology Market Volume Share (%), by Country 2024 & 2032
- Figure 43: Europe Recombinant DNA Technology Market Revenue (Million), by Product 2024 & 2032
- Figure 44: Europe Recombinant DNA Technology Market Volume (K Unit), by Product 2024 & 2032
- Figure 45: Europe Recombinant DNA Technology Market Revenue Share (%), by Product 2024 & 2032
- Figure 46: Europe Recombinant DNA Technology Market Volume Share (%), by Product 2024 & 2032
- Figure 47: Europe Recombinant DNA Technology Market Revenue (Million), by Component 2024 & 2032
- Figure 48: Europe Recombinant DNA Technology Market Volume (K Unit), by Component 2024 & 2032
- Figure 49: Europe Recombinant DNA Technology Market Revenue Share (%), by Component 2024 & 2032
- Figure 50: Europe Recombinant DNA Technology Market Volume Share (%), by Component 2024 & 2032
- Figure 51: Europe Recombinant DNA Technology Market Revenue (Million), by Application 2024 & 2032
- Figure 52: Europe Recombinant DNA Technology Market Volume (K Unit), by Application 2024 & 2032
- Figure 53: Europe Recombinant DNA Technology Market Revenue Share (%), by Application 2024 & 2032
- Figure 54: Europe Recombinant DNA Technology Market Volume Share (%), by Application 2024 & 2032
- Figure 55: Europe Recombinant DNA Technology Market Revenue (Million), by End User 2024 & 2032
- Figure 56: Europe Recombinant DNA Technology Market Volume (K Unit), by End User 2024 & 2032
- Figure 57: Europe Recombinant DNA Technology Market Revenue Share (%), by End User 2024 & 2032
- Figure 58: Europe Recombinant DNA Technology Market Volume Share (%), by End User 2024 & 2032
- Figure 59: Europe Recombinant DNA Technology Market Revenue (Million), by Country 2024 & 2032
- Figure 60: Europe Recombinant DNA Technology Market Volume (K Unit), by Country 2024 & 2032
- Figure 61: Europe Recombinant DNA Technology Market Revenue Share (%), by Country 2024 & 2032
- Figure 62: Europe Recombinant DNA Technology Market Volume Share (%), by Country 2024 & 2032
- Figure 63: Asia Pacific Recombinant DNA Technology Market Revenue (Million), by Product 2024 & 2032
- Figure 64: Asia Pacific Recombinant DNA Technology Market Volume (K Unit), by Product 2024 & 2032
- Figure 65: Asia Pacific Recombinant DNA Technology Market Revenue Share (%), by Product 2024 & 2032
- Figure 66: Asia Pacific Recombinant DNA Technology Market Volume Share (%), by Product 2024 & 2032
- Figure 67: Asia Pacific Recombinant DNA Technology Market Revenue (Million), by Component 2024 & 2032
- Figure 68: Asia Pacific Recombinant DNA Technology Market Volume (K Unit), by Component 2024 & 2032
- Figure 69: Asia Pacific Recombinant DNA Technology Market Revenue Share (%), by Component 2024 & 2032
- Figure 70: Asia Pacific Recombinant DNA Technology Market Volume Share (%), by Component 2024 & 2032
- Figure 71: Asia Pacific Recombinant DNA Technology Market Revenue (Million), by Application 2024 & 2032
- Figure 72: Asia Pacific Recombinant DNA Technology Market Volume (K Unit), by Application 2024 & 2032
- Figure 73: Asia Pacific Recombinant DNA Technology Market Revenue Share (%), by Application 2024 & 2032
- Figure 74: Asia Pacific Recombinant DNA Technology Market Volume Share (%), by Application 2024 & 2032
- Figure 75: Asia Pacific Recombinant DNA Technology Market Revenue (Million), by End User 2024 & 2032
- Figure 76: Asia Pacific Recombinant DNA Technology Market Volume (K Unit), by End User 2024 & 2032
- Figure 77: Asia Pacific Recombinant DNA Technology Market Revenue Share (%), by End User 2024 & 2032
- Figure 78: Asia Pacific Recombinant DNA Technology Market Volume Share (%), by End User 2024 & 2032
- Figure 79: Asia Pacific Recombinant DNA Technology Market Revenue (Million), by Country 2024 & 2032
- Figure 80: Asia Pacific Recombinant DNA Technology Market Volume (K Unit), by Country 2024 & 2032
- Figure 81: Asia Pacific Recombinant DNA Technology Market Revenue Share (%), by Country 2024 & 2032
- Figure 82: Asia Pacific Recombinant DNA Technology Market Volume Share (%), by Country 2024 & 2032
- Figure 83: Middle East and Africa Recombinant DNA Technology Market Revenue (Million), by Product 2024 & 2032
- Figure 84: Middle East and Africa Recombinant DNA Technology Market Volume (K Unit), by Product 2024 & 2032
- Figure 85: Middle East and Africa Recombinant DNA Technology Market Revenue Share (%), by Product 2024 & 2032
- Figure 86: Middle East and Africa Recombinant DNA Technology Market Volume Share (%), by Product 2024 & 2032
- Figure 87: Middle East and Africa Recombinant DNA Technology Market Revenue (Million), by Component 2024 & 2032
- Figure 88: Middle East and Africa Recombinant DNA Technology Market Volume (K Unit), by Component 2024 & 2032
- Figure 89: Middle East and Africa Recombinant DNA Technology Market Revenue Share (%), by Component 2024 & 2032
- Figure 90: Middle East and Africa Recombinant DNA Technology Market Volume Share (%), by Component 2024 & 2032
- Figure 91: Middle East and Africa Recombinant DNA Technology Market Revenue (Million), by Application 2024 & 2032
- Figure 92: Middle East and Africa Recombinant DNA Technology Market Volume (K Unit), by Application 2024 & 2032
- Figure 93: Middle East and Africa Recombinant DNA Technology Market Revenue Share (%), by Application 2024 & 2032
- Figure 94: Middle East and Africa Recombinant DNA Technology Market Volume Share (%), by Application 2024 & 2032
- Figure 95: Middle East and Africa Recombinant DNA Technology Market Revenue (Million), by End User 2024 & 2032
- Figure 96: Middle East and Africa Recombinant DNA Technology Market Volume (K Unit), by End User 2024 & 2032
- Figure 97: Middle East and Africa Recombinant DNA Technology Market Revenue Share (%), by End User 2024 & 2032
- Figure 98: Middle East and Africa Recombinant DNA Technology Market Volume Share (%), by End User 2024 & 2032
- Figure 99: Middle East and Africa Recombinant DNA Technology Market Revenue (Million), by Country 2024 & 2032
- Figure 100: Middle East and Africa Recombinant DNA Technology Market Volume (K Unit), by Country 2024 & 2032
- Figure 101: Middle East and Africa Recombinant DNA Technology Market Revenue Share (%), by Country 2024 & 2032
- Figure 102: Middle East and Africa Recombinant DNA Technology Market Volume Share (%), by Country 2024 & 2032
- Figure 103: South America Recombinant DNA Technology Market Revenue (Million), by Product 2024 & 2032
- Figure 104: South America Recombinant DNA Technology Market Volume (K Unit), by Product 2024 & 2032
- Figure 105: South America Recombinant DNA Technology Market Revenue Share (%), by Product 2024 & 2032
- Figure 106: South America Recombinant DNA Technology Market Volume Share (%), by Product 2024 & 2032
- Figure 107: South America Recombinant DNA Technology Market Revenue (Million), by Component 2024 & 2032
- Figure 108: South America Recombinant DNA Technology Market Volume (K Unit), by Component 2024 & 2032
- Figure 109: South America Recombinant DNA Technology Market Revenue Share (%), by Component 2024 & 2032
- Figure 110: South America Recombinant DNA Technology Market Volume Share (%), by Component 2024 & 2032
- Figure 111: South America Recombinant DNA Technology Market Revenue (Million), by Application 2024 & 2032
- Figure 112: South America Recombinant DNA Technology Market Volume (K Unit), by Application 2024 & 2032
- Figure 113: South America Recombinant DNA Technology Market Revenue Share (%), by Application 2024 & 2032
- Figure 114: South America Recombinant DNA Technology Market Volume Share (%), by Application 2024 & 2032
- Figure 115: South America Recombinant DNA Technology Market Revenue (Million), by End User 2024 & 2032
- Figure 116: South America Recombinant DNA Technology Market Volume (K Unit), by End User 2024 & 2032
- Figure 117: South America Recombinant DNA Technology Market Revenue Share (%), by End User 2024 & 2032
- Figure 118: South America Recombinant DNA Technology Market Volume Share (%), by End User 2024 & 2032
- Figure 119: South America Recombinant DNA Technology Market Revenue (Million), by Country 2024 & 2032
- Figure 120: South America Recombinant DNA Technology Market Volume (K Unit), by Country 2024 & 2032
- Figure 121: South America Recombinant DNA Technology Market Revenue Share (%), by Country 2024 & 2032
- Figure 122: South America Recombinant DNA Technology Market Volume Share (%), by Country 2024 & 2032
List of Tables
- Table 1: Global Recombinant DNA Technology Market Revenue Million Forecast, by Region 2019 & 2032
- Table 2: Global Recombinant DNA Technology Market Volume K Unit Forecast, by Region 2019 & 2032
- Table 3: Global Recombinant DNA Technology Market Revenue Million Forecast, by Product 2019 & 2032
- Table 4: Global Recombinant DNA Technology Market Volume K Unit Forecast, by Product 2019 & 2032
- Table 5: Global Recombinant DNA Technology Market Revenue Million Forecast, by Component 2019 & 2032
- Table 6: Global Recombinant DNA Technology Market Volume K Unit Forecast, by Component 2019 & 2032
- Table 7: Global Recombinant DNA Technology Market Revenue Million Forecast, by Application 2019 & 2032
- Table 8: Global Recombinant DNA Technology Market Volume K Unit Forecast, by Application 2019 & 2032
- Table 9: Global Recombinant DNA Technology Market Revenue Million Forecast, by End User 2019 & 2032
- Table 10: Global Recombinant DNA Technology Market Volume K Unit Forecast, by End User 2019 & 2032
- Table 11: Global Recombinant DNA Technology Market Revenue Million Forecast, by Region 2019 & 2032
- Table 12: Global Recombinant DNA Technology Market Volume K Unit Forecast, by Region 2019 & 2032
- Table 13: Global Recombinant DNA Technology Market Revenue Million Forecast, by Country 2019 & 2032
- Table 14: Global Recombinant DNA Technology Market Volume K Unit Forecast, by Country 2019 & 2032
- Table 15: United States Recombinant DNA Technology Market Revenue (Million) Forecast, by Application 2019 & 2032
- Table 16: United States Recombinant DNA Technology Market Volume (K Unit) Forecast, by Application 2019 & 2032
- Table 17: Canada Recombinant DNA Technology Market Revenue (Million) Forecast, by Application 2019 & 2032
- Table 18: Canada Recombinant DNA Technology Market Volume (K Unit) Forecast, by Application 2019 & 2032
- Table 19: Mexico Recombinant DNA Technology Market Revenue (Million) Forecast, by Application 2019 & 2032
- Table 20: Mexico Recombinant DNA Technology Market Volume (K Unit) Forecast, by Application 2019 & 2032
- Table 21: Global Recombinant DNA Technology Market Revenue Million Forecast, by Country 2019 & 2032
- Table 22: Global Recombinant DNA Technology Market Volume K Unit Forecast, by Country 2019 & 2032
- Table 23: Germany Recombinant DNA Technology Market Revenue (Million) Forecast, by Application 2019 & 2032
- Table 24: Germany Recombinant DNA Technology Market Volume (K Unit) Forecast, by Application 2019 & 2032
- Table 25: United Kingdom Recombinant DNA Technology Market Revenue (Million) Forecast, by Application 2019 & 2032
- Table 26: United Kingdom Recombinant DNA Technology Market Volume (K Unit) Forecast, by Application 2019 & 2032
- Table 27: France Recombinant DNA Technology Market Revenue (Million) Forecast, by Application 2019 & 2032
- Table 28: France Recombinant DNA Technology Market Volume (K Unit) Forecast, by Application 2019 & 2032
- Table 29: Italy Recombinant DNA Technology Market Revenue (Million) Forecast, by Application 2019 & 2032
- Table 30: Italy Recombinant DNA Technology Market Volume (K Unit) Forecast, by Application 2019 & 2032
- Table 31: Spain Recombinant DNA Technology Market Revenue (Million) Forecast, by Application 2019 & 2032
- Table 32: Spain Recombinant DNA Technology Market Volume (K Unit) Forecast, by Application 2019 & 2032
- Table 33: Rest of Europe Recombinant DNA Technology Market Revenue (Million) Forecast, by Application 2019 & 2032
- Table 34: Rest of Europe Recombinant DNA Technology Market Volume (K Unit) Forecast, by Application 2019 & 2032
- Table 35: Global Recombinant DNA Technology Market Revenue Million Forecast, by Country 2019 & 2032
- Table 36: Global Recombinant DNA Technology Market Volume K Unit Forecast, by Country 2019 & 2032
- Table 37: China Recombinant DNA Technology Market Revenue (Million) Forecast, by Application 2019 & 2032
- Table 38: China Recombinant DNA Technology Market Volume (K Unit) Forecast, by Application 2019 & 2032
- Table 39: Japan Recombinant DNA Technology Market Revenue (Million) Forecast, by Application 2019 & 2032
- Table 40: Japan Recombinant DNA Technology Market Volume (K Unit) Forecast, by Application 2019 & 2032
- Table 41: India Recombinant DNA Technology Market Revenue (Million) Forecast, by Application 2019 & 2032
- Table 42: India Recombinant DNA Technology Market Volume (K Unit) Forecast, by Application 2019 & 2032
- Table 43: Australia Recombinant DNA Technology Market Revenue (Million) Forecast, by Application 2019 & 2032
- Table 44: Australia Recombinant DNA Technology Market Volume (K Unit) Forecast, by Application 2019 & 2032
- Table 45: South korea Recombinant DNA Technology Market Revenue (Million) Forecast, by Application 2019 & 2032
- Table 46: South korea Recombinant DNA Technology Market Volume (K Unit) Forecast, by Application 2019 & 2032
- Table 47: Rest of Asia Pacific Recombinant DNA Technology Market Revenue (Million) Forecast, by Application 2019 & 2032
- Table 48: Rest of Asia Pacific Recombinant DNA Technology Market Volume (K Unit) Forecast, by Application 2019 & 2032
- Table 49: Global Recombinant DNA Technology Market Revenue Million Forecast, by Country 2019 & 2032
- Table 50: Global Recombinant DNA Technology Market Volume K Unit Forecast, by Country 2019 & 2032
- Table 51: GCC Recombinant DNA Technology Market Revenue (Million) Forecast, by Application 2019 & 2032
- Table 52: GCC Recombinant DNA Technology Market Volume (K Unit) Forecast, by Application 2019 & 2032
- Table 53: South Africa Recombinant DNA Technology Market Revenue (Million) Forecast, by Application 2019 & 2032
- Table 54: South Africa Recombinant DNA Technology Market Volume (K Unit) Forecast, by Application 2019 & 2032
- Table 55: Rest of Middle East and Africa Recombinant DNA Technology Market Revenue (Million) Forecast, by Application 2019 & 2032
- Table 56: Rest of Middle East and Africa Recombinant DNA Technology Market Volume (K Unit) Forecast, by Application 2019 & 2032
- Table 57: Global Recombinant DNA Technology Market Revenue Million Forecast, by Country 2019 & 2032
- Table 58: Global Recombinant DNA Technology Market Volume K Unit Forecast, by Country 2019 & 2032
- Table 59: Brazil Recombinant DNA Technology Market Revenue (Million) Forecast, by Application 2019 & 2032
- Table 60: Brazil Recombinant DNA Technology Market Volume (K Unit) Forecast, by Application 2019 & 2032
- Table 61: Argentina Recombinant DNA Technology Market Revenue (Million) Forecast, by Application 2019 & 2032
- Table 62: Argentina Recombinant DNA Technology Market Volume (K Unit) Forecast, by Application 2019 & 2032
- Table 63: Rest of South America Recombinant DNA Technology Market Revenue (Million) Forecast, by Application 2019 & 2032
- Table 64: Rest of South America Recombinant DNA Technology Market Volume (K Unit) Forecast, by Application 2019 & 2032
- Table 65: Global Recombinant DNA Technology Market Revenue Million Forecast, by Product 2019 & 2032
- Table 66: Global Recombinant DNA Technology Market Volume K Unit Forecast, by Product 2019 & 2032
- Table 67: Global Recombinant DNA Technology Market Revenue Million Forecast, by Component 2019 & 2032
- Table 68: Global Recombinant DNA Technology Market Volume K Unit Forecast, by Component 2019 & 2032
- Table 69: Global Recombinant DNA Technology Market Revenue Million Forecast, by Application 2019 & 2032
- Table 70: Global Recombinant DNA Technology Market Volume K Unit Forecast, by Application 2019 & 2032
- Table 71: Global Recombinant DNA Technology Market Revenue Million Forecast, by End User 2019 & 2032
- Table 72: Global Recombinant DNA Technology Market Volume K Unit Forecast, by End User 2019 & 2032
- Table 73: Global Recombinant DNA Technology Market Revenue Million Forecast, by Country 2019 & 2032
- Table 74: Global Recombinant DNA Technology Market Volume K Unit Forecast, by Country 2019 & 2032
- Table 75: United States Recombinant DNA Technology Market Revenue (Million) Forecast, by Application 2019 & 2032
- Table 76: United States Recombinant DNA Technology Market Volume (K Unit) Forecast, by Application 2019 & 2032
- Table 77: Canada Recombinant DNA Technology Market Revenue (Million) Forecast, by Application 2019 & 2032
- Table 78: Canada Recombinant DNA Technology Market Volume (K Unit) Forecast, by Application 2019 & 2032
- Table 79: Mexico Recombinant DNA Technology Market Revenue (Million) Forecast, by Application 2019 & 2032
- Table 80: Mexico Recombinant DNA Technology Market Volume (K Unit) Forecast, by Application 2019 & 2032
- Table 81: Global Recombinant DNA Technology Market Revenue Million Forecast, by Product 2019 & 2032
- Table 82: Global Recombinant DNA Technology Market Volume K Unit Forecast, by Product 2019 & 2032
- Table 83: Global Recombinant DNA Technology Market Revenue Million Forecast, by Component 2019 & 2032
- Table 84: Global Recombinant DNA Technology Market Volume K Unit Forecast, by Component 2019 & 2032
- Table 85: Global Recombinant DNA Technology Market Revenue Million Forecast, by Application 2019 & 2032
- Table 86: Global Recombinant DNA Technology Market Volume K Unit Forecast, by Application 2019 & 2032
- Table 87: Global Recombinant DNA Technology Market Revenue Million Forecast, by End User 2019 & 2032
- Table 88: Global Recombinant DNA Technology Market Volume K Unit Forecast, by End User 2019 & 2032
- Table 89: Global Recombinant DNA Technology Market Revenue Million Forecast, by Country 2019 & 2032
- Table 90: Global Recombinant DNA Technology Market Volume K Unit Forecast, by Country 2019 & 2032
- Table 91: Germany Recombinant DNA Technology Market Revenue (Million) Forecast, by Application 2019 & 2032
- Table 92: Germany Recombinant DNA Technology Market Volume (K Unit) Forecast, by Application 2019 & 2032
- Table 93: United Kingdom Recombinant DNA Technology Market Revenue (Million) Forecast, by Application 2019 & 2032
- Table 94: United Kingdom Recombinant DNA Technology Market Volume (K Unit) Forecast, by Application 2019 & 2032
- Table 95: France Recombinant DNA Technology Market Revenue (Million) Forecast, by Application 2019 & 2032
- Table 96: France Recombinant DNA Technology Market Volume (K Unit) Forecast, by Application 2019 & 2032
- Table 97: Italy Recombinant DNA Technology Market Revenue (Million) Forecast, by Application 2019 & 2032
- Table 98: Italy Recombinant DNA Technology Market Volume (K Unit) Forecast, by Application 2019 & 2032
- Table 99: Spain Recombinant DNA Technology Market Revenue (Million) Forecast, by Application 2019 & 2032
- Table 100: Spain Recombinant DNA Technology Market Volume (K Unit) Forecast, by Application 2019 & 2032
- Table 101: Rest of Europe Recombinant DNA Technology Market Revenue (Million) Forecast, by Application 2019 & 2032
- Table 102: Rest of Europe Recombinant DNA Technology Market Volume (K Unit) Forecast, by Application 2019 & 2032
- Table 103: Global Recombinant DNA Technology Market Revenue Million Forecast, by Product 2019 & 2032
- Table 104: Global Recombinant DNA Technology Market Volume K Unit Forecast, by Product 2019 & 2032
- Table 105: Global Recombinant DNA Technology Market Revenue Million Forecast, by Component 2019 & 2032
- Table 106: Global Recombinant DNA Technology Market Volume K Unit Forecast, by Component 2019 & 2032
- Table 107: Global Recombinant DNA Technology Market Revenue Million Forecast, by Application 2019 & 2032
- Table 108: Global Recombinant DNA Technology Market Volume K Unit Forecast, by Application 2019 & 2032
- Table 109: Global Recombinant DNA Technology Market Revenue Million Forecast, by End User 2019 & 2032
- Table 110: Global Recombinant DNA Technology Market Volume K Unit Forecast, by End User 2019 & 2032
- Table 111: Global Recombinant DNA Technology Market Revenue Million Forecast, by Country 2019 & 2032
- Table 112: Global Recombinant DNA Technology Market Volume K Unit Forecast, by Country 2019 & 2032
- Table 113: China Recombinant DNA Technology Market Revenue (Million) Forecast, by Application 2019 & 2032
- Table 114: China Recombinant DNA Technology Market Volume (K Unit) Forecast, by Application 2019 & 2032
- Table 115: Japan Recombinant DNA Technology Market Revenue (Million) Forecast, by Application 2019 & 2032
- Table 116: Japan Recombinant DNA Technology Market Volume (K Unit) Forecast, by Application 2019 & 2032
- Table 117: India Recombinant DNA Technology Market Revenue (Million) Forecast, by Application 2019 & 2032
- Table 118: India Recombinant DNA Technology Market Volume (K Unit) Forecast, by Application 2019 & 2032
- Table 119: Australia Recombinant DNA Technology Market Revenue (Million) Forecast, by Application 2019 & 2032
- Table 120: Australia Recombinant DNA Technology Market Volume (K Unit) Forecast, by Application 2019 & 2032
- Table 121: South korea Recombinant DNA Technology Market Revenue (Million) Forecast, by Application 2019 & 2032
- Table 122: South korea Recombinant DNA Technology Market Volume (K Unit) Forecast, by Application 2019 & 2032
- Table 123: Rest of Asia Pacific Recombinant DNA Technology Market Revenue (Million) Forecast, by Application 2019 & 2032
- Table 124: Rest of Asia Pacific Recombinant DNA Technology Market Volume (K Unit) Forecast, by Application 2019 & 2032
- Table 125: Global Recombinant DNA Technology Market Revenue Million Forecast, by Product 2019 & 2032
- Table 126: Global Recombinant DNA Technology Market Volume K Unit Forecast, by Product 2019 & 2032
- Table 127: Global Recombinant DNA Technology Market Revenue Million Forecast, by Component 2019 & 2032
- Table 128: Global Recombinant DNA Technology Market Volume K Unit Forecast, by Component 2019 & 2032
- Table 129: Global Recombinant DNA Technology Market Revenue Million Forecast, by Application 2019 & 2032
- Table 130: Global Recombinant DNA Technology Market Volume K Unit Forecast, by Application 2019 & 2032
- Table 131: Global Recombinant DNA Technology Market Revenue Million Forecast, by End User 2019 & 2032
- Table 132: Global Recombinant DNA Technology Market Volume K Unit Forecast, by End User 2019 & 2032
- Table 133: Global Recombinant DNA Technology Market Revenue Million Forecast, by Country 2019 & 2032
- Table 134: Global Recombinant DNA Technology Market Volume K Unit Forecast, by Country 2019 & 2032
- Table 135: GCC Recombinant DNA Technology Market Revenue (Million) Forecast, by Application 2019 & 2032
- Table 136: GCC Recombinant DNA Technology Market Volume (K Unit) Forecast, by Application 2019 & 2032
- Table 137: South Africa Recombinant DNA Technology Market Revenue (Million) Forecast, by Application 2019 & 2032
- Table 138: South Africa Recombinant DNA Technology Market Volume (K Unit) Forecast, by Application 2019 & 2032
- Table 139: Rest of Middle East and Africa Recombinant DNA Technology Market Revenue (Million) Forecast, by Application 2019 & 2032
- Table 140: Rest of Middle East and Africa Recombinant DNA Technology Market Volume (K Unit) Forecast, by Application 2019 & 2032
- Table 141: Global Recombinant DNA Technology Market Revenue Million Forecast, by Product 2019 & 2032
- Table 142: Global Recombinant DNA Technology Market Volume K Unit Forecast, by Product 2019 & 2032
- Table 143: Global Recombinant DNA Technology Market Revenue Million Forecast, by Component 2019 & 2032
- Table 144: Global Recombinant DNA Technology Market Volume K Unit Forecast, by Component 2019 & 2032
- Table 145: Global Recombinant DNA Technology Market Revenue Million Forecast, by Application 2019 & 2032
- Table 146: Global Recombinant DNA Technology Market Volume K Unit Forecast, by Application 2019 & 2032
- Table 147: Global Recombinant DNA Technology Market Revenue Million Forecast, by End User 2019 & 2032
- Table 148: Global Recombinant DNA Technology Market Volume K Unit Forecast, by End User 2019 & 2032
- Table 149: Global Recombinant DNA Technology Market Revenue Million Forecast, by Country 2019 & 2032
- Table 150: Global Recombinant DNA Technology Market Volume K Unit Forecast, by Country 2019 & 2032
- Table 151: Brazil Recombinant DNA Technology Market Revenue (Million) Forecast, by Application 2019 & 2032
- Table 152: Brazil Recombinant DNA Technology Market Volume (K Unit) Forecast, by Application 2019 & 2032
- Table 153: Argentina Recombinant DNA Technology Market Revenue (Million) Forecast, by Application 2019 & 2032
- Table 154: Argentina Recombinant DNA Technology Market Volume (K Unit) Forecast, by Application 2019 & 2032
- Table 155: Rest of South America Recombinant DNA Technology Market Revenue (Million) Forecast, by Application 2019 & 2032
- Table 156: Rest of South America Recombinant DNA Technology Market Volume (K Unit) Forecast, by Application 2019 & 2032
Frequently Asked Questions
1. What is the projected Compound Annual Growth Rate (CAGR) of the Recombinant DNA Technology Market?
The projected CAGR is approximately 6.80%.
2. Which companies are prominent players in the Recombinant DNA Technology Market?
Key companies in the market include Horizon Discovery, Merck KGaA, Sanofi, Novartis AG, Amgen Inc, Eli Lilly and Company, New England Biolabs, F Hoffmann-La Roche Ltd (Genentech Inc ), GenScript, Novo Nordisk A/S, Syngene International Limited, Pfizer Inc.
3. What are the main segments of the Recombinant DNA Technology Market?
The market segments include Product, Component, Application, End User.
4. Can you provide details about the market size?
The market size is estimated to be USD XX Million as of 2022.
5. What are some drivers contributing to market growth?
Technological Advancements in Genomics; Expansion of Biopharmaceutical Industry; Increasing Demand and Applications of Recombinant/ Genetically Modified Products.
6. What are the notable trends driving market growth?
The Food and Agriculture Segment is Expected to Register the High CAGR Over the Forecast Period.
7. Are there any restraints impacting market growth?
Regulatory. Scientific. and Ethical Challenges Associated with Gene Therapy.
8. Can you provide examples of recent developments in the market?
In March 2022, VBI Vaccines Inc. launched PreHevbrio (Recombinant Hepatitis B Vaccine) in the United States for the prevention of infection caused by all known subtypes of hepatitis B virus (HBV) in adults age 18 years and older.
9. What pricing options are available for accessing the report?
Pricing options include single-user, multi-user, and enterprise licenses priced at USD 4750, USD 5250, and USD 8750 respectively.
10. Is the market size provided in terms of value or volume?
The market size is provided in terms of value, measured in Million and volume, measured in K Unit.
11. Are there any specific market keywords associated with the report?
Yes, the market keyword associated with the report is "Recombinant DNA Technology Market," which aids in identifying and referencing the specific market segment covered.
12. How do I determine which pricing option suits my needs best?
The pricing options vary based on user requirements and access needs. Individual users may opt for single-user licenses, while businesses requiring broader access may choose multi-user or enterprise licenses for cost-effective access to the report.
13. Are there any additional resources or data provided in the Recombinant DNA Technology Market report?
While the report offers comprehensive insights, it's advisable to review the specific contents or supplementary materials provided to ascertain if additional resources or data are available.
14. How can I stay updated on further developments or reports in the Recombinant DNA Technology Market?
To stay informed about further developments, trends, and reports in the Recombinant DNA Technology Market, consider subscribing to industry newsletters, following relevant companies and organizations, or regularly checking reputable industry news sources and publications.
Methodology
Step 1 - Identification of Relevant Samples Size from Population Database


Step 2 - Approaches for Defining Global Market Size (Value, Volume* & Price*)

Note*: In applicable scenarios
Step 3 - Data Sources
Primary Research
- Web Analytics
- Survey Reports
- Research Institute
- Latest Research Reports
- Opinion Leaders
Secondary Research
- Annual Reports
- White Paper
- Latest Press Release
- Industry Association
- Paid Database
- Investor Presentations

Step 4 - Data Triangulation
Involves using different sources of information in order to increase the validity of a study
These sources are likely to be stakeholders in a program - participants, other researchers, program staff, other community members, and so on.
Then we put all data in single framework & apply various statistical tools to find out the dynamic on the market.
During the analysis stage, feedback from the stakeholder groups would be compared to determine areas of agreement as well as areas of divergence


