
Key Insights
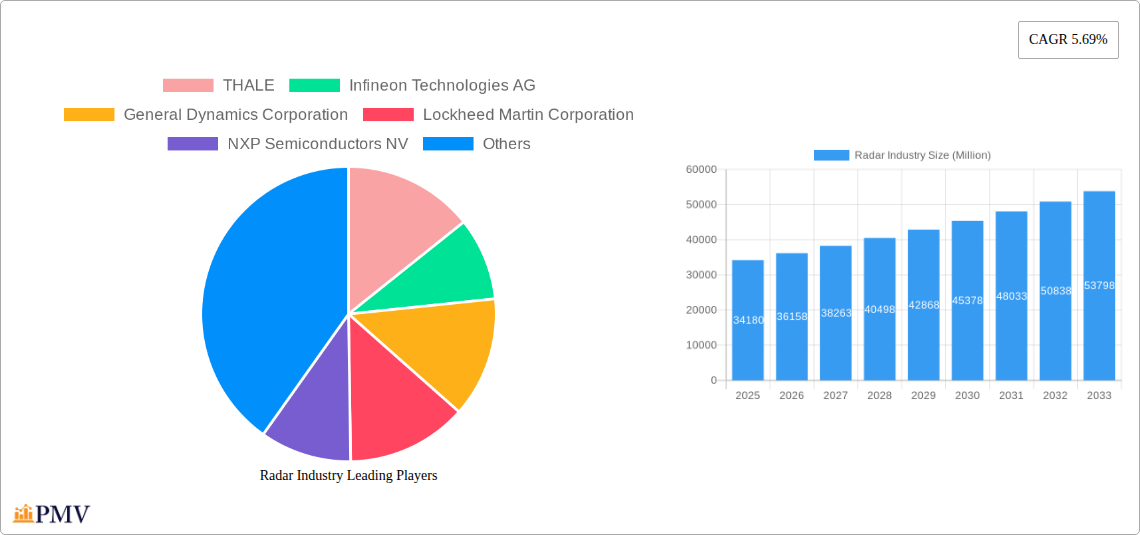
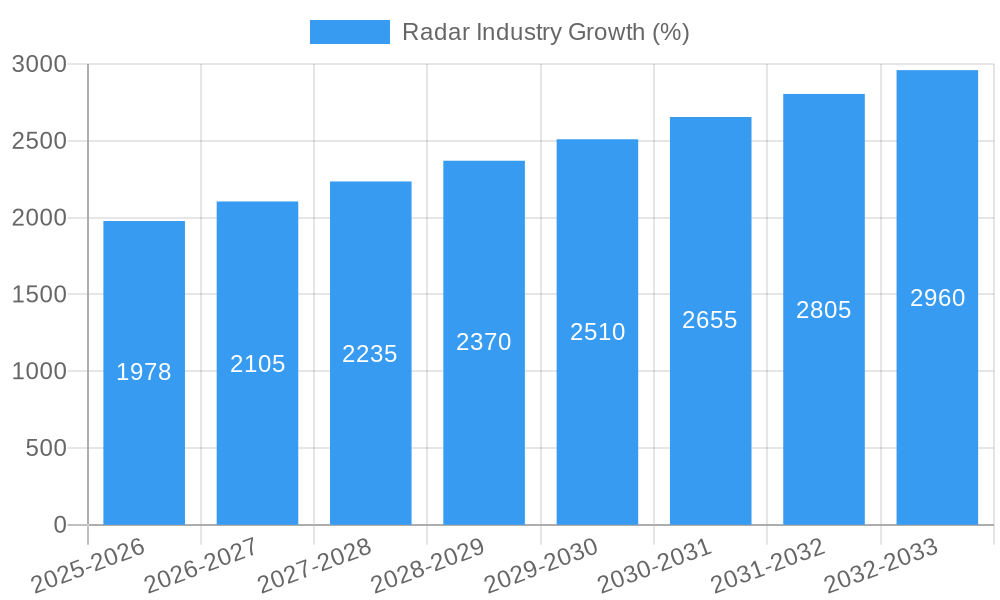
The global radar systems market, valued at $34.18 billion in 2025, is projected to experience robust growth, driven by increasing demand across diverse sectors. A compound annual growth rate (CAGR) of 5.69% from 2025 to 2033 indicates a significant expansion, fueled primarily by advancements in radar technology, including higher resolution imaging, improved target detection capabilities, and the integration of artificial intelligence (AI) for enhanced data processing and analysis. The defense and military sectors are major contributors to market growth, with substantial investments in advanced radar systems for surveillance, missile defense, and air traffic control. Furthermore, the burgeoning automotive industry's adoption of radar sensors for advanced driver-assistance systems (ADAS) and autonomous driving technologies is a key driver. Growth is also propelled by increasing investments in infrastructure development and modernization across various nations, leading to enhanced demand for air traffic management and weather monitoring radar systems. The maritime sector also contributes significantly, relying on radar technology for navigation, collision avoidance, and maritime surveillance.
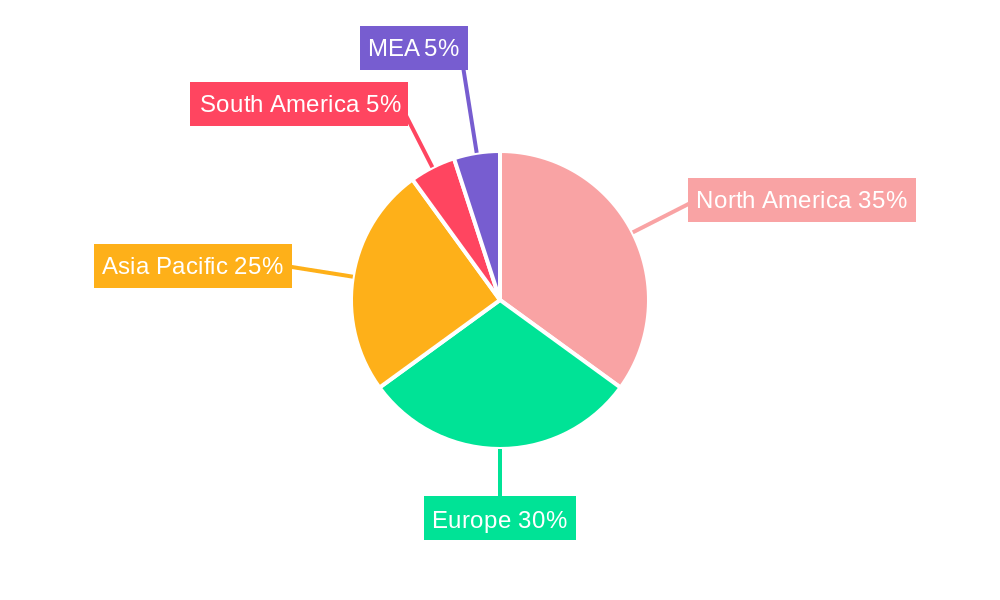
Market segmentation reveals significant opportunities within specific niches. Continuous wave radar systems are gaining traction due to their cost-effectiveness and high accuracy in certain applications, while pulsed wave radar systems maintain dominance in high-resolution imaging scenarios. Airborne radar systems are expected to witness substantial growth owing to increasing air travel and related safety concerns, coupled with defense modernization programs. Geographically, North America and Europe currently hold a significant market share, primarily driven by strong defense budgets and technological advancements. However, the Asia-Pacific region is poised for rapid expansion due to growing investments in infrastructure and defense, particularly from countries like China and India. While technological advancements drive growth, challenges such as high initial investment costs and the need for skilled personnel to operate and maintain these sophisticated systems could potentially impede market expansion to some degree.
Radar Industry Market Report: 2019-2033
This comprehensive report provides an in-depth analysis of the global Radar Industry, offering valuable insights for stakeholders across the value chain. With a study period spanning 2019-2033, a base year of 2025, and a forecast period of 2025-2033, this report projects a market valued at xx Million by 2033, exhibiting a CAGR of xx%. The report leverages extensive primary and secondary research to provide a granular understanding of market dynamics, competitive landscapes, and future growth trajectories.
Radar Industry Market Structure & Competitive Dynamics
The Radar Industry exhibits a moderately consolidated market structure, characterized by the presence of both large multinational corporations and specialized smaller players. Key players such as Thales, Lockheed Martin, and Raytheon Technologies hold significant market share, driven by their extensive technological expertise, robust product portfolios, and strong global presence. However, the market is also witnessing increased competition from emerging players, particularly in the automotive radar segment. The competitive landscape is shaped by factors such as innovation capabilities, technological advancements, strategic partnerships, and mergers & acquisitions (M&A) activities.
The estimated total value of M&A deals in the radar industry between 2019 and 2024 is estimated to be xx Million. These activities reflect the industry's consolidation trend and the quest for technological advancements and market expansion.
- Market Concentration: The top five players account for approximately xx% of the global market share.
- Innovation Ecosystems: Significant R&D investments are driving continuous product innovation, particularly in areas like 4D imaging radar and advanced sensor fusion.
- Regulatory Frameworks: Stringent regulations concerning safety and performance standards, particularly in the automotive and aviation sectors, influence market dynamics.
- Product Substitutes: Competition arises from alternative technologies such as lidar and vision systems, but radar's inherent advantages in various applications maintain its market dominance.
- End-User Trends: Growing demand for enhanced safety features in autonomous vehicles and increased surveillance needs in defense applications are key drivers.
Radar Industry Industry Trends & Insights
The Radar Industry is experiencing robust growth, propelled by several factors. The increasing demand for advanced driver-assistance systems (ADAS) in the automotive sector is a major growth catalyst. The automotive segment is expected to remain the dominant application area throughout the forecast period, showcasing impressive market penetration and substantial CAGR growth. Technological advancements such as the development of 4D imaging radar, improved sensor fusion capabilities, and the integration of artificial intelligence (AI) are further driving market expansion. Furthermore, the rising need for enhanced security and surveillance in various sectors, including defense and homeland security, contributes significantly to market growth. The growing adoption of radar technology in areas like weather forecasting, air traffic control, and industrial automation also presents significant opportunities. However, the market also faces challenges like the increasing complexity of radar systems and the high cost of development and deployment.
Dominant Markets & Segments in Radar Industry
The Automotive segment is currently the dominant end-user industry, accounting for approximately xx Million in revenue in 2024. This is fuelled by the increasing integration of ADAS in vehicles globally. The Military & Defense sector also holds a substantial market share, driven by the continuous demand for advanced surveillance and defense systems.
- By Type: Pulsated Wave RADAR Systems currently hold a larger market share than Continuous Wave RADAR Systems, due to their versatility and adaptability across various applications. Both segments, however, are expected to experience significant growth during the forecast period.
- By Application: The Airborne segment dominates, owing to the widespread use of radar in air traffic control and military aviation. However, the Land-based and Naval segments are also anticipated to exhibit strong growth, particularly with advancements in autonomous driving and maritime security.
- By End-user Industry: Key drivers for each segment include:
- Aviation: Stringent safety regulations and the demand for improved air traffic management systems.
- Maritime Applications: Enhanced security needs, navigation systems, and maritime surveillance.
- Automotive: Increased adoption of ADAS and autonomous driving technologies.
- Military & Defense: Continuous demand for advanced surveillance, target acquisition, and missile guidance systems.
Radar Industry Product Innovations
Recent years have witnessed significant advancements in radar technology, focusing on enhancing performance, reducing size and cost, and expanding applications. The introduction of 4D imaging radar, offering superior object detection and classification capabilities, represents a major technological leap. Moreover, the integration of AI and machine learning algorithms into radar systems has improved accuracy and decision-making capabilities. These innovations, along with the development of cost-effective solutions, are driving broader adoption across diverse sectors.
Report Segmentation & Scope
This report segments the Radar Industry comprehensively across various parameters:
By Type: Continuous Wave RADAR Systems and Pulsated Wave RADAR Systems, with detailed analysis of market size, growth projections, and competitive dynamics for each segment.
By Application: Airborne, Land-based, and Naval applications, providing insight into sector-specific market trends and growth drivers.
By End-user Industry: Aviation, Maritime Applications, Automotive, and Military & Defense, offering in-depth analyses of each industry's specific requirements and adoption rates of radar technology. Each segment's growth is projected based on factors such as technological advancements, regulatory changes, and economic conditions.
Key Drivers of Radar Industry Growth
Several key factors drive the growth of the Radar Industry. These include the increasing demand for enhanced safety and security features in various applications, technological advancements such as the development of 4D imaging radar, and the rising adoption of autonomous driving technologies. Government investments in defense and homeland security also contribute significantly to market growth. Furthermore, the expanding applications of radar in areas such as weather forecasting and industrial automation create further growth opportunities.
Challenges in the Radar Industry Sector
The Radar Industry faces challenges such as the high cost of research and development, complex system integration, and intense competition from alternative technologies. Regulatory hurdles and supply chain disruptions also pose significant obstacles. These challenges, however, are being addressed through innovation, strategic partnerships, and supply chain diversification.
Leading Players in the Radar Industry Market
- THALES
- Infineon Technologies AG
- General Dynamics Corporation
- Lockheed Martin Corporation
- NXP Semiconductors NV
- IAI
- RTX Corporation
- Leonardo S p A
- Airbus Defense and Space Inc (Airbus SE)
- BAE Systems plc
- Saab AB
Key Developments in Radar Industry Sector
January 2023: NXP Semiconductors launched a 28nm RFCMOS radar one-chip for safety-critical ADAS applications, enhancing autonomous driving capabilities. This development positions NXP as a key player in the automotive radar market.
December 2022: ZF introduced Imaging Radar technology to SAIC Motor Corporation, improving the safety and reliability of autonomous driving in challenging conditions. This signals an expansion of advanced radar technologies in the Chinese automotive market.
November 2022: Renesas Electronics Corporation entered the automotive radar market with new transceivers designed for 4D radar and satellite automotive radar systems, increasing competition and driving innovation in the segment.
Strategic Radar Industry Market Outlook
The Radar Industry is poised for continued growth, driven by technological advancements, increasing demand from diverse sectors, and rising investments in R&D. Future growth will be significantly influenced by the development and adoption of 4D imaging radar, sensor fusion, and AI-powered radar systems. Opportunities exist for companies that can effectively integrate these technologies into innovative products and services, focusing on improved safety, enhanced performance, and cost-effectiveness. The ongoing trend toward autonomous vehicles and advanced defense systems will further fuel market growth in the coming years.
Radar Industry Segmentation
-
1. Type
- 1.1. Continuous Wave RADAR Systems
- 1.2. Pulsated Wave RADAR Systems
-
2. Application
- 2.1. Airborne
- 2.2. Land-based
- 2.3. Naval
-
3. End-user Industry
- 3.1. Aviation
- 3.2. Maritime Applications
- 3.3. Automotive
- 3.4. Military & Defense
Radar Industry Segmentation By Geography
-
1. North America
- 1.1. United States
- 1.2. Canada
-
2. Europe
- 2.1. United Kingdom
- 2.2. Germany
- 2.3. France
- 2.4. Rest of Europe
-
3. Asia Pacific
- 3.1. China
- 3.2. Japan
- 3.3. India
- 3.4. Rest of Asia Pacific
-
4. Rest of the World
- 4.1. Latin America
- 4.2. Middle East and Africa
Radar Industry REPORT HIGHLIGHTS
| Aspects | Details |
|---|---|
| Study Period | 2019-2033 |
| Base Year | 2024 |
| Estimated Year | 2025 |
| Forecast Period | 2025-2033 |
| Historical Period | 2019-2024 |
| Growth Rate | CAGR of 5.69% from 2019-2033 |
| Segmentation |
|
Table of Contents
- 1. Introduction
- 1.1. Research Scope
- 1.2. Market Segmentation
- 1.3. Research Methodology
- 1.4. Definitions and Assumptions
- 2. Executive Summary
- 2.1. Introduction
- 3. Market Dynamics
- 3.1. Introduction
- 3.2. Market Drivers
- 3.2.1. Increasing Requirement for Efficient Monitoring of Vast Land Areas; Rising Smart City Initiatives; Big Data and Imagery Analytics
- 3.3. Market Restrains
- 3.3.1. Availability of Open-source Data for Various Countries
- 3.4. Market Trends
- 3.4.1. Automotive Application to Witness Significant Growth During the Forecast Period
- 4. Market Factor Analysis
- 4.1. Porters Five Forces
- 4.2. Supply/Value Chain
- 4.3. PESTEL analysis
- 4.4. Market Entropy
- 4.5. Patent/Trademark Analysis
- 5. Global Radar Industry Analysis, Insights and Forecast, 2019-2031
- 5.1. Market Analysis, Insights and Forecast - by Type
- 5.1.1. Continuous Wave RADAR Systems
- 5.1.2. Pulsated Wave RADAR Systems
- 5.2. Market Analysis, Insights and Forecast - by Application
- 5.2.1. Airborne
- 5.2.2. Land-based
- 5.2.3. Naval
- 5.3. Market Analysis, Insights and Forecast - by End-user Industry
- 5.3.1. Aviation
- 5.3.2. Maritime Applications
- 5.3.3. Automotive
- 5.3.4. Military & Defense
- 5.4. Market Analysis, Insights and Forecast - by Region
- 5.4.1. North America
- 5.4.2. Europe
- 5.4.3. Asia Pacific
- 5.4.4. Rest of the World
- 5.1. Market Analysis, Insights and Forecast - by Type
- 6. North America Radar Industry Analysis, Insights and Forecast, 2019-2031
- 6.1. Market Analysis, Insights and Forecast - by Type
- 6.1.1. Continuous Wave RADAR Systems
- 6.1.2. Pulsated Wave RADAR Systems
- 6.2. Market Analysis, Insights and Forecast - by Application
- 6.2.1. Airborne
- 6.2.2. Land-based
- 6.2.3. Naval
- 6.3. Market Analysis, Insights and Forecast - by End-user Industry
- 6.3.1. Aviation
- 6.3.2. Maritime Applications
- 6.3.3. Automotive
- 6.3.4. Military & Defense
- 6.1. Market Analysis, Insights and Forecast - by Type
- 7. Europe Radar Industry Analysis, Insights and Forecast, 2019-2031
- 7.1. Market Analysis, Insights and Forecast - by Type
- 7.1.1. Continuous Wave RADAR Systems
- 7.1.2. Pulsated Wave RADAR Systems
- 7.2. Market Analysis, Insights and Forecast - by Application
- 7.2.1. Airborne
- 7.2.2. Land-based
- 7.2.3. Naval
- 7.3. Market Analysis, Insights and Forecast - by End-user Industry
- 7.3.1. Aviation
- 7.3.2. Maritime Applications
- 7.3.3. Automotive
- 7.3.4. Military & Defense
- 7.1. Market Analysis, Insights and Forecast - by Type
- 8. Asia Pacific Radar Industry Analysis, Insights and Forecast, 2019-2031
- 8.1. Market Analysis, Insights and Forecast - by Type
- 8.1.1. Continuous Wave RADAR Systems
- 8.1.2. Pulsated Wave RADAR Systems
- 8.2. Market Analysis, Insights and Forecast - by Application
- 8.2.1. Airborne
- 8.2.2. Land-based
- 8.2.3. Naval
- 8.3. Market Analysis, Insights and Forecast - by End-user Industry
- 8.3.1. Aviation
- 8.3.2. Maritime Applications
- 8.3.3. Automotive
- 8.3.4. Military & Defense
- 8.1. Market Analysis, Insights and Forecast - by Type
- 9. Rest of the World Radar Industry Analysis, Insights and Forecast, 2019-2031
- 9.1. Market Analysis, Insights and Forecast - by Type
- 9.1.1. Continuous Wave RADAR Systems
- 9.1.2. Pulsated Wave RADAR Systems
- 9.2. Market Analysis, Insights and Forecast - by Application
- 9.2.1. Airborne
- 9.2.2. Land-based
- 9.2.3. Naval
- 9.3. Market Analysis, Insights and Forecast - by End-user Industry
- 9.3.1. Aviation
- 9.3.2. Maritime Applications
- 9.3.3. Automotive
- 9.3.4. Military & Defense
- 9.1. Market Analysis, Insights and Forecast - by Type
- 10. North America Radar Industry Analysis, Insights and Forecast, 2019-2031
- 10.1. Market Analysis, Insights and Forecast - By Country/Sub-region
- 10.1.1 United States
- 10.1.2 Canada
- 10.1.3 Mexico
- 11. Europe Radar Industry Analysis, Insights and Forecast, 2019-2031
- 11.1. Market Analysis, Insights and Forecast - By Country/Sub-region
- 11.1.1 Germany
- 11.1.2 United Kingdom
- 11.1.3 France
- 11.1.4 Spain
- 11.1.5 Italy
- 11.1.6 Spain
- 11.1.7 Belgium
- 11.1.8 Netherland
- 11.1.9 Nordics
- 11.1.10 Rest of Europe
- 12. Asia Pacific Radar Industry Analysis, Insights and Forecast, 2019-2031
- 12.1. Market Analysis, Insights and Forecast - By Country/Sub-region
- 12.1.1 China
- 12.1.2 Japan
- 12.1.3 India
- 12.1.4 South Korea
- 12.1.5 Southeast Asia
- 12.1.6 Australia
- 12.1.7 Indonesia
- 12.1.8 Phillipes
- 12.1.9 Singapore
- 12.1.10 Thailandc
- 12.1.11 Rest of Asia Pacific
- 13. South America Radar Industry Analysis, Insights and Forecast, 2019-2031
- 13.1. Market Analysis, Insights and Forecast - By Country/Sub-region
- 13.1.1 Brazil
- 13.1.2 Argentina
- 13.1.3 Peru
- 13.1.4 Chile
- 13.1.5 Colombia
- 13.1.6 Ecuador
- 13.1.7 Venezuela
- 13.1.8 Rest of South America
- 14. North America Radar Industry Analysis, Insights and Forecast, 2019-2031
- 14.1. Market Analysis, Insights and Forecast - By Country/Sub-region
- 14.1.1 United States
- 14.1.2 Canada
- 14.1.3 Mexico
- 15. MEA Radar Industry Analysis, Insights and Forecast, 2019-2031
- 15.1. Market Analysis, Insights and Forecast - By Country/Sub-region
- 15.1.1 United Arab Emirates
- 15.1.2 Saudi Arabia
- 15.1.3 South Africa
- 15.1.4 Rest of Middle East and Africa
- 16. Competitive Analysis
- 16.1. Global Market Share Analysis 2024
- 16.2. Company Profiles
- 16.2.1 THALE
- 16.2.1.1. Overview
- 16.2.1.2. Products
- 16.2.1.3. SWOT Analysis
- 16.2.1.4. Recent Developments
- 16.2.1.5. Financials (Based on Availability)
- 16.2.2 Infineon Technologies AG
- 16.2.2.1. Overview
- 16.2.2.2. Products
- 16.2.2.3. SWOT Analysis
- 16.2.2.4. Recent Developments
- 16.2.2.5. Financials (Based on Availability)
- 16.2.3 General Dynamics Corporation
- 16.2.3.1. Overview
- 16.2.3.2. Products
- 16.2.3.3. SWOT Analysis
- 16.2.3.4. Recent Developments
- 16.2.3.5. Financials (Based on Availability)
- 16.2.4 Lockheed Martin Corporation
- 16.2.4.1. Overview
- 16.2.4.2. Products
- 16.2.4.3. SWOT Analysis
- 16.2.4.4. Recent Developments
- 16.2.4.5. Financials (Based on Availability)
- 16.2.5 NXP Semiconductors NV
- 16.2.5.1. Overview
- 16.2.5.2. Products
- 16.2.5.3. SWOT Analysis
- 16.2.5.4. Recent Developments
- 16.2.5.5. Financials (Based on Availability)
- 16.2.6 IAI
- 16.2.6.1. Overview
- 16.2.6.2. Products
- 16.2.6.3. SWOT Analysis
- 16.2.6.4. Recent Developments
- 16.2.6.5. Financials (Based on Availability)
- 16.2.7 RTX Corporation
- 16.2.7.1. Overview
- 16.2.7.2. Products
- 16.2.7.3. SWOT Analysis
- 16.2.7.4. Recent Developments
- 16.2.7.5. Financials (Based on Availability)
- 16.2.8 Leonardo S p A
- 16.2.8.1. Overview
- 16.2.8.2. Products
- 16.2.8.3. SWOT Analysis
- 16.2.8.4. Recent Developments
- 16.2.8.5. Financials (Based on Availability)
- 16.2.9 Airbus Defense and Space Inc (Airbus SE)
- 16.2.9.1. Overview
- 16.2.9.2. Products
- 16.2.9.3. SWOT Analysis
- 16.2.9.4. Recent Developments
- 16.2.9.5. Financials (Based on Availability)
- 16.2.10 BAE Systems plc
- 16.2.10.1. Overview
- 16.2.10.2. Products
- 16.2.10.3. SWOT Analysis
- 16.2.10.4. Recent Developments
- 16.2.10.5. Financials (Based on Availability)
- 16.2.11 Saab AB
- 16.2.11.1. Overview
- 16.2.11.2. Products
- 16.2.11.3. SWOT Analysis
- 16.2.11.4. Recent Developments
- 16.2.11.5. Financials (Based on Availability)
- 16.2.1 THALE
List of Figures
- Figure 1: Global Radar Industry Revenue Breakdown (Million, %) by Region 2024 & 2032
- Figure 2: Global Radar Industry Volume Breakdown (K Unit, %) by Region 2024 & 2032
- Figure 3: North America Radar Industry Revenue (Million), by Country 2024 & 2032
- Figure 4: North America Radar Industry Volume (K Unit), by Country 2024 & 2032
- Figure 5: North America Radar Industry Revenue Share (%), by Country 2024 & 2032
- Figure 6: North America Radar Industry Volume Share (%), by Country 2024 & 2032
- Figure 7: Europe Radar Industry Revenue (Million), by Country 2024 & 2032
- Figure 8: Europe Radar Industry Volume (K Unit), by Country 2024 & 2032
- Figure 9: Europe Radar Industry Revenue Share (%), by Country 2024 & 2032
- Figure 10: Europe Radar Industry Volume Share (%), by Country 2024 & 2032
- Figure 11: Asia Pacific Radar Industry Revenue (Million), by Country 2024 & 2032
- Figure 12: Asia Pacific Radar Industry Volume (K Unit), by Country 2024 & 2032
- Figure 13: Asia Pacific Radar Industry Revenue Share (%), by Country 2024 & 2032
- Figure 14: Asia Pacific Radar Industry Volume Share (%), by Country 2024 & 2032
- Figure 15: South America Radar Industry Revenue (Million), by Country 2024 & 2032
- Figure 16: South America Radar Industry Volume (K Unit), by Country 2024 & 2032
- Figure 17: South America Radar Industry Revenue Share (%), by Country 2024 & 2032
- Figure 18: South America Radar Industry Volume Share (%), by Country 2024 & 2032
- Figure 19: North America Radar Industry Revenue (Million), by Country 2024 & 2032
- Figure 20: North America Radar Industry Volume (K Unit), by Country 2024 & 2032
- Figure 21: North America Radar Industry Revenue Share (%), by Country 2024 & 2032
- Figure 22: North America Radar Industry Volume Share (%), by Country 2024 & 2032
- Figure 23: MEA Radar Industry Revenue (Million), by Country 2024 & 2032
- Figure 24: MEA Radar Industry Volume (K Unit), by Country 2024 & 2032
- Figure 25: MEA Radar Industry Revenue Share (%), by Country 2024 & 2032
- Figure 26: MEA Radar Industry Volume Share (%), by Country 2024 & 2032
- Figure 27: North America Radar Industry Revenue (Million), by Type 2024 & 2032
- Figure 28: North America Radar Industry Volume (K Unit), by Type 2024 & 2032
- Figure 29: North America Radar Industry Revenue Share (%), by Type 2024 & 2032
- Figure 30: North America Radar Industry Volume Share (%), by Type 2024 & 2032
- Figure 31: North America Radar Industry Revenue (Million), by Application 2024 & 2032
- Figure 32: North America Radar Industry Volume (K Unit), by Application 2024 & 2032
- Figure 33: North America Radar Industry Revenue Share (%), by Application 2024 & 2032
- Figure 34: North America Radar Industry Volume Share (%), by Application 2024 & 2032
- Figure 35: North America Radar Industry Revenue (Million), by End-user Industry 2024 & 2032
- Figure 36: North America Radar Industry Volume (K Unit), by End-user Industry 2024 & 2032
- Figure 37: North America Radar Industry Revenue Share (%), by End-user Industry 2024 & 2032
- Figure 38: North America Radar Industry Volume Share (%), by End-user Industry 2024 & 2032
- Figure 39: North America Radar Industry Revenue (Million), by Country 2024 & 2032
- Figure 40: North America Radar Industry Volume (K Unit), by Country 2024 & 2032
- Figure 41: North America Radar Industry Revenue Share (%), by Country 2024 & 2032
- Figure 42: North America Radar Industry Volume Share (%), by Country 2024 & 2032
- Figure 43: Europe Radar Industry Revenue (Million), by Type 2024 & 2032
- Figure 44: Europe Radar Industry Volume (K Unit), by Type 2024 & 2032
- Figure 45: Europe Radar Industry Revenue Share (%), by Type 2024 & 2032
- Figure 46: Europe Radar Industry Volume Share (%), by Type 2024 & 2032
- Figure 47: Europe Radar Industry Revenue (Million), by Application 2024 & 2032
- Figure 48: Europe Radar Industry Volume (K Unit), by Application 2024 & 2032
- Figure 49: Europe Radar Industry Revenue Share (%), by Application 2024 & 2032
- Figure 50: Europe Radar Industry Volume Share (%), by Application 2024 & 2032
- Figure 51: Europe Radar Industry Revenue (Million), by End-user Industry 2024 & 2032
- Figure 52: Europe Radar Industry Volume (K Unit), by End-user Industry 2024 & 2032
- Figure 53: Europe Radar Industry Revenue Share (%), by End-user Industry 2024 & 2032
- Figure 54: Europe Radar Industry Volume Share (%), by End-user Industry 2024 & 2032
- Figure 55: Europe Radar Industry Revenue (Million), by Country 2024 & 2032
- Figure 56: Europe Radar Industry Volume (K Unit), by Country 2024 & 2032
- Figure 57: Europe Radar Industry Revenue Share (%), by Country 2024 & 2032
- Figure 58: Europe Radar Industry Volume Share (%), by Country 2024 & 2032
- Figure 59: Asia Pacific Radar Industry Revenue (Million), by Type 2024 & 2032
- Figure 60: Asia Pacific Radar Industry Volume (K Unit), by Type 2024 & 2032
- Figure 61: Asia Pacific Radar Industry Revenue Share (%), by Type 2024 & 2032
- Figure 62: Asia Pacific Radar Industry Volume Share (%), by Type 2024 & 2032
- Figure 63: Asia Pacific Radar Industry Revenue (Million), by Application 2024 & 2032
- Figure 64: Asia Pacific Radar Industry Volume (K Unit), by Application 2024 & 2032
- Figure 65: Asia Pacific Radar Industry Revenue Share (%), by Application 2024 & 2032
- Figure 66: Asia Pacific Radar Industry Volume Share (%), by Application 2024 & 2032
- Figure 67: Asia Pacific Radar Industry Revenue (Million), by End-user Industry 2024 & 2032
- Figure 68: Asia Pacific Radar Industry Volume (K Unit), by End-user Industry 2024 & 2032
- Figure 69: Asia Pacific Radar Industry Revenue Share (%), by End-user Industry 2024 & 2032
- Figure 70: Asia Pacific Radar Industry Volume Share (%), by End-user Industry 2024 & 2032
- Figure 71: Asia Pacific Radar Industry Revenue (Million), by Country 2024 & 2032
- Figure 72: Asia Pacific Radar Industry Volume (K Unit), by Country 2024 & 2032
- Figure 73: Asia Pacific Radar Industry Revenue Share (%), by Country 2024 & 2032
- Figure 74: Asia Pacific Radar Industry Volume Share (%), by Country 2024 & 2032
- Figure 75: Rest of the World Radar Industry Revenue (Million), by Type 2024 & 2032
- Figure 76: Rest of the World Radar Industry Volume (K Unit), by Type 2024 & 2032
- Figure 77: Rest of the World Radar Industry Revenue Share (%), by Type 2024 & 2032
- Figure 78: Rest of the World Radar Industry Volume Share (%), by Type 2024 & 2032
- Figure 79: Rest of the World Radar Industry Revenue (Million), by Application 2024 & 2032
- Figure 80: Rest of the World Radar Industry Volume (K Unit), by Application 2024 & 2032
- Figure 81: Rest of the World Radar Industry Revenue Share (%), by Application 2024 & 2032
- Figure 82: Rest of the World Radar Industry Volume Share (%), by Application 2024 & 2032
- Figure 83: Rest of the World Radar Industry Revenue (Million), by End-user Industry 2024 & 2032
- Figure 84: Rest of the World Radar Industry Volume (K Unit), by End-user Industry 2024 & 2032
- Figure 85: Rest of the World Radar Industry Revenue Share (%), by End-user Industry 2024 & 2032
- Figure 86: Rest of the World Radar Industry Volume Share (%), by End-user Industry 2024 & 2032
- Figure 87: Rest of the World Radar Industry Revenue (Million), by Country 2024 & 2032
- Figure 88: Rest of the World Radar Industry Volume (K Unit), by Country 2024 & 2032
- Figure 89: Rest of the World Radar Industry Revenue Share (%), by Country 2024 & 2032
- Figure 90: Rest of the World Radar Industry Volume Share (%), by Country 2024 & 2032
List of Tables
- Table 1: Global Radar Industry Revenue Million Forecast, by Region 2019 & 2032
- Table 2: Global Radar Industry Volume K Unit Forecast, by Region 2019 & 2032
- Table 3: Global Radar Industry Revenue Million Forecast, by Type 2019 & 2032
- Table 4: Global Radar Industry Volume K Unit Forecast, by Type 2019 & 2032
- Table 5: Global Radar Industry Revenue Million Forecast, by Application 2019 & 2032
- Table 6: Global Radar Industry Volume K Unit Forecast, by Application 2019 & 2032
- Table 7: Global Radar Industry Revenue Million Forecast, by End-user Industry 2019 & 2032
- Table 8: Global Radar Industry Volume K Unit Forecast, by End-user Industry 2019 & 2032
- Table 9: Global Radar Industry Revenue Million Forecast, by Region 2019 & 2032
- Table 10: Global Radar Industry Volume K Unit Forecast, by Region 2019 & 2032
- Table 11: Global Radar Industry Revenue Million Forecast, by Country 2019 & 2032
- Table 12: Global Radar Industry Volume K Unit Forecast, by Country 2019 & 2032
- Table 13: United States Radar Industry Revenue (Million) Forecast, by Application 2019 & 2032
- Table 14: United States Radar Industry Volume (K Unit) Forecast, by Application 2019 & 2032
- Table 15: Canada Radar Industry Revenue (Million) Forecast, by Application 2019 & 2032
- Table 16: Canada Radar Industry Volume (K Unit) Forecast, by Application 2019 & 2032
- Table 17: Mexico Radar Industry Revenue (Million) Forecast, by Application 2019 & 2032
- Table 18: Mexico Radar Industry Volume (K Unit) Forecast, by Application 2019 & 2032
- Table 19: Global Radar Industry Revenue Million Forecast, by Country 2019 & 2032
- Table 20: Global Radar Industry Volume K Unit Forecast, by Country 2019 & 2032
- Table 21: Germany Radar Industry Revenue (Million) Forecast, by Application 2019 & 2032
- Table 22: Germany Radar Industry Volume (K Unit) Forecast, by Application 2019 & 2032
- Table 23: United Kingdom Radar Industry Revenue (Million) Forecast, by Application 2019 & 2032
- Table 24: United Kingdom Radar Industry Volume (K Unit) Forecast, by Application 2019 & 2032
- Table 25: France Radar Industry Revenue (Million) Forecast, by Application 2019 & 2032
- Table 26: France Radar Industry Volume (K Unit) Forecast, by Application 2019 & 2032
- Table 27: Spain Radar Industry Revenue (Million) Forecast, by Application 2019 & 2032
- Table 28: Spain Radar Industry Volume (K Unit) Forecast, by Application 2019 & 2032
- Table 29: Italy Radar Industry Revenue (Million) Forecast, by Application 2019 & 2032
- Table 30: Italy Radar Industry Volume (K Unit) Forecast, by Application 2019 & 2032
- Table 31: Spain Radar Industry Revenue (Million) Forecast, by Application 2019 & 2032
- Table 32: Spain Radar Industry Volume (K Unit) Forecast, by Application 2019 & 2032
- Table 33: Belgium Radar Industry Revenue (Million) Forecast, by Application 2019 & 2032
- Table 34: Belgium Radar Industry Volume (K Unit) Forecast, by Application 2019 & 2032
- Table 35: Netherland Radar Industry Revenue (Million) Forecast, by Application 2019 & 2032
- Table 36: Netherland Radar Industry Volume (K Unit) Forecast, by Application 2019 & 2032
- Table 37: Nordics Radar Industry Revenue (Million) Forecast, by Application 2019 & 2032
- Table 38: Nordics Radar Industry Volume (K Unit) Forecast, by Application 2019 & 2032
- Table 39: Rest of Europe Radar Industry Revenue (Million) Forecast, by Application 2019 & 2032
- Table 40: Rest of Europe Radar Industry Volume (K Unit) Forecast, by Application 2019 & 2032
- Table 41: Global Radar Industry Revenue Million Forecast, by Country 2019 & 2032
- Table 42: Global Radar Industry Volume K Unit Forecast, by Country 2019 & 2032
- Table 43: China Radar Industry Revenue (Million) Forecast, by Application 2019 & 2032
- Table 44: China Radar Industry Volume (K Unit) Forecast, by Application 2019 & 2032
- Table 45: Japan Radar Industry Revenue (Million) Forecast, by Application 2019 & 2032
- Table 46: Japan Radar Industry Volume (K Unit) Forecast, by Application 2019 & 2032
- Table 47: India Radar Industry Revenue (Million) Forecast, by Application 2019 & 2032
- Table 48: India Radar Industry Volume (K Unit) Forecast, by Application 2019 & 2032
- Table 49: South Korea Radar Industry Revenue (Million) Forecast, by Application 2019 & 2032
- Table 50: South Korea Radar Industry Volume (K Unit) Forecast, by Application 2019 & 2032
- Table 51: Southeast Asia Radar Industry Revenue (Million) Forecast, by Application 2019 & 2032
- Table 52: Southeast Asia Radar Industry Volume (K Unit) Forecast, by Application 2019 & 2032
- Table 53: Australia Radar Industry Revenue (Million) Forecast, by Application 2019 & 2032
- Table 54: Australia Radar Industry Volume (K Unit) Forecast, by Application 2019 & 2032
- Table 55: Indonesia Radar Industry Revenue (Million) Forecast, by Application 2019 & 2032
- Table 56: Indonesia Radar Industry Volume (K Unit) Forecast, by Application 2019 & 2032
- Table 57: Phillipes Radar Industry Revenue (Million) Forecast, by Application 2019 & 2032
- Table 58: Phillipes Radar Industry Volume (K Unit) Forecast, by Application 2019 & 2032
- Table 59: Singapore Radar Industry Revenue (Million) Forecast, by Application 2019 & 2032
- Table 60: Singapore Radar Industry Volume (K Unit) Forecast, by Application 2019 & 2032
- Table 61: Thailandc Radar Industry Revenue (Million) Forecast, by Application 2019 & 2032
- Table 62: Thailandc Radar Industry Volume (K Unit) Forecast, by Application 2019 & 2032
- Table 63: Rest of Asia Pacific Radar Industry Revenue (Million) Forecast, by Application 2019 & 2032
- Table 64: Rest of Asia Pacific Radar Industry Volume (K Unit) Forecast, by Application 2019 & 2032
- Table 65: Global Radar Industry Revenue Million Forecast, by Country 2019 & 2032
- Table 66: Global Radar Industry Volume K Unit Forecast, by Country 2019 & 2032
- Table 67: Brazil Radar Industry Revenue (Million) Forecast, by Application 2019 & 2032
- Table 68: Brazil Radar Industry Volume (K Unit) Forecast, by Application 2019 & 2032
- Table 69: Argentina Radar Industry Revenue (Million) Forecast, by Application 2019 & 2032
- Table 70: Argentina Radar Industry Volume (K Unit) Forecast, by Application 2019 & 2032
- Table 71: Peru Radar Industry Revenue (Million) Forecast, by Application 2019 & 2032
- Table 72: Peru Radar Industry Volume (K Unit) Forecast, by Application 2019 & 2032
- Table 73: Chile Radar Industry Revenue (Million) Forecast, by Application 2019 & 2032
- Table 74: Chile Radar Industry Volume (K Unit) Forecast, by Application 2019 & 2032
- Table 75: Colombia Radar Industry Revenue (Million) Forecast, by Application 2019 & 2032
- Table 76: Colombia Radar Industry Volume (K Unit) Forecast, by Application 2019 & 2032
- Table 77: Ecuador Radar Industry Revenue (Million) Forecast, by Application 2019 & 2032
- Table 78: Ecuador Radar Industry Volume (K Unit) Forecast, by Application 2019 & 2032
- Table 79: Venezuela Radar Industry Revenue (Million) Forecast, by Application 2019 & 2032
- Table 80: Venezuela Radar Industry Volume (K Unit) Forecast, by Application 2019 & 2032
- Table 81: Rest of South America Radar Industry Revenue (Million) Forecast, by Application 2019 & 2032
- Table 82: Rest of South America Radar Industry Volume (K Unit) Forecast, by Application 2019 & 2032
- Table 83: Global Radar Industry Revenue Million Forecast, by Country 2019 & 2032
- Table 84: Global Radar Industry Volume K Unit Forecast, by Country 2019 & 2032
- Table 85: United States Radar Industry Revenue (Million) Forecast, by Application 2019 & 2032
- Table 86: United States Radar Industry Volume (K Unit) Forecast, by Application 2019 & 2032
- Table 87: Canada Radar Industry Revenue (Million) Forecast, by Application 2019 & 2032
- Table 88: Canada Radar Industry Volume (K Unit) Forecast, by Application 2019 & 2032
- Table 89: Mexico Radar Industry Revenue (Million) Forecast, by Application 2019 & 2032
- Table 90: Mexico Radar Industry Volume (K Unit) Forecast, by Application 2019 & 2032
- Table 91: Global Radar Industry Revenue Million Forecast, by Country 2019 & 2032
- Table 92: Global Radar Industry Volume K Unit Forecast, by Country 2019 & 2032
- Table 93: United Arab Emirates Radar Industry Revenue (Million) Forecast, by Application 2019 & 2032
- Table 94: United Arab Emirates Radar Industry Volume (K Unit) Forecast, by Application 2019 & 2032
- Table 95: Saudi Arabia Radar Industry Revenue (Million) Forecast, by Application 2019 & 2032
- Table 96: Saudi Arabia Radar Industry Volume (K Unit) Forecast, by Application 2019 & 2032
- Table 97: South Africa Radar Industry Revenue (Million) Forecast, by Application 2019 & 2032
- Table 98: South Africa Radar Industry Volume (K Unit) Forecast, by Application 2019 & 2032
- Table 99: Rest of Middle East and Africa Radar Industry Revenue (Million) Forecast, by Application 2019 & 2032
- Table 100: Rest of Middle East and Africa Radar Industry Volume (K Unit) Forecast, by Application 2019 & 2032
- Table 101: Global Radar Industry Revenue Million Forecast, by Type 2019 & 2032
- Table 102: Global Radar Industry Volume K Unit Forecast, by Type 2019 & 2032
- Table 103: Global Radar Industry Revenue Million Forecast, by Application 2019 & 2032
- Table 104: Global Radar Industry Volume K Unit Forecast, by Application 2019 & 2032
- Table 105: Global Radar Industry Revenue Million Forecast, by End-user Industry 2019 & 2032
- Table 106: Global Radar Industry Volume K Unit Forecast, by End-user Industry 2019 & 2032
- Table 107: Global Radar Industry Revenue Million Forecast, by Country 2019 & 2032
- Table 108: Global Radar Industry Volume K Unit Forecast, by Country 2019 & 2032
- Table 109: United States Radar Industry Revenue (Million) Forecast, by Application 2019 & 2032
- Table 110: United States Radar Industry Volume (K Unit) Forecast, by Application 2019 & 2032
- Table 111: Canada Radar Industry Revenue (Million) Forecast, by Application 2019 & 2032
- Table 112: Canada Radar Industry Volume (K Unit) Forecast, by Application 2019 & 2032
- Table 113: Global Radar Industry Revenue Million Forecast, by Type 2019 & 2032
- Table 114: Global Radar Industry Volume K Unit Forecast, by Type 2019 & 2032
- Table 115: Global Radar Industry Revenue Million Forecast, by Application 2019 & 2032
- Table 116: Global Radar Industry Volume K Unit Forecast, by Application 2019 & 2032
- Table 117: Global Radar Industry Revenue Million Forecast, by End-user Industry 2019 & 2032
- Table 118: Global Radar Industry Volume K Unit Forecast, by End-user Industry 2019 & 2032
- Table 119: Global Radar Industry Revenue Million Forecast, by Country 2019 & 2032
- Table 120: Global Radar Industry Volume K Unit Forecast, by Country 2019 & 2032
- Table 121: United Kingdom Radar Industry Revenue (Million) Forecast, by Application 2019 & 2032
- Table 122: United Kingdom Radar Industry Volume (K Unit) Forecast, by Application 2019 & 2032
- Table 123: Germany Radar Industry Revenue (Million) Forecast, by Application 2019 & 2032
- Table 124: Germany Radar Industry Volume (K Unit) Forecast, by Application 2019 & 2032
- Table 125: France Radar Industry Revenue (Million) Forecast, by Application 2019 & 2032
- Table 126: France Radar Industry Volume (K Unit) Forecast, by Application 2019 & 2032
- Table 127: Rest of Europe Radar Industry Revenue (Million) Forecast, by Application 2019 & 2032
- Table 128: Rest of Europe Radar Industry Volume (K Unit) Forecast, by Application 2019 & 2032
- Table 129: Global Radar Industry Revenue Million Forecast, by Type 2019 & 2032
- Table 130: Global Radar Industry Volume K Unit Forecast, by Type 2019 & 2032
- Table 131: Global Radar Industry Revenue Million Forecast, by Application 2019 & 2032
- Table 132: Global Radar Industry Volume K Unit Forecast, by Application 2019 & 2032
- Table 133: Global Radar Industry Revenue Million Forecast, by End-user Industry 2019 & 2032
- Table 134: Global Radar Industry Volume K Unit Forecast, by End-user Industry 2019 & 2032
- Table 135: Global Radar Industry Revenue Million Forecast, by Country 2019 & 2032
- Table 136: Global Radar Industry Volume K Unit Forecast, by Country 2019 & 2032
- Table 137: China Radar Industry Revenue (Million) Forecast, by Application 2019 & 2032
- Table 138: China Radar Industry Volume (K Unit) Forecast, by Application 2019 & 2032
- Table 139: Japan Radar Industry Revenue (Million) Forecast, by Application 2019 & 2032
- Table 140: Japan Radar Industry Volume (K Unit) Forecast, by Application 2019 & 2032
- Table 141: India Radar Industry Revenue (Million) Forecast, by Application 2019 & 2032
- Table 142: India Radar Industry Volume (K Unit) Forecast, by Application 2019 & 2032
- Table 143: Rest of Asia Pacific Radar Industry Revenue (Million) Forecast, by Application 2019 & 2032
- Table 144: Rest of Asia Pacific Radar Industry Volume (K Unit) Forecast, by Application 2019 & 2032
- Table 145: Global Radar Industry Revenue Million Forecast, by Type 2019 & 2032
- Table 146: Global Radar Industry Volume K Unit Forecast, by Type 2019 & 2032
- Table 147: Global Radar Industry Revenue Million Forecast, by Application 2019 & 2032
- Table 148: Global Radar Industry Volume K Unit Forecast, by Application 2019 & 2032
- Table 149: Global Radar Industry Revenue Million Forecast, by End-user Industry 2019 & 2032
- Table 150: Global Radar Industry Volume K Unit Forecast, by End-user Industry 2019 & 2032
- Table 151: Global Radar Industry Revenue Million Forecast, by Country 2019 & 2032
- Table 152: Global Radar Industry Volume K Unit Forecast, by Country 2019 & 2032
- Table 153: Latin America Radar Industry Revenue (Million) Forecast, by Application 2019 & 2032
- Table 154: Latin America Radar Industry Volume (K Unit) Forecast, by Application 2019 & 2032
- Table 155: Middle East and Africa Radar Industry Revenue (Million) Forecast, by Application 2019 & 2032
- Table 156: Middle East and Africa Radar Industry Volume (K Unit) Forecast, by Application 2019 & 2032
Frequently Asked Questions
1. What is the projected Compound Annual Growth Rate (CAGR) of the Radar Industry?
The projected CAGR is approximately 5.69%.
2. Which companies are prominent players in the Radar Industry?
Key companies in the market include THALE, Infineon Technologies AG, General Dynamics Corporation, Lockheed Martin Corporation, NXP Semiconductors NV, IAI, RTX Corporation, Leonardo S p A, Airbus Defense and Space Inc (Airbus SE), BAE Systems plc, Saab AB.
3. What are the main segments of the Radar Industry?
The market segments include Type, Application, End-user Industry.
4. Can you provide details about the market size?
The market size is estimated to be USD 34.18 Million as of 2022.
5. What are some drivers contributing to market growth?
Increasing Requirement for Efficient Monitoring of Vast Land Areas; Rising Smart City Initiatives; Big Data and Imagery Analytics.
6. What are the notable trends driving market growth?
Automotive Application to Witness Significant Growth During the Forecast Period.
7. Are there any restraints impacting market growth?
Availability of Open-source Data for Various Countries.
8. Can you provide examples of recent developments in the market?
January 2023 - NXP Semiconductors launched a 28nm RFCMOS radar one-chip for safety-critical ADAS applications, including automated emergency braking and blind-spot detection. DENSO, the lead client of NXP, will use this chip technology to maintain its position as the industry leader in ADAS.
9. What pricing options are available for accessing the report?
Pricing options include single-user, multi-user, and enterprise licenses priced at USD 4750, USD 5250, and USD 8750 respectively.
10. Is the market size provided in terms of value or volume?
The market size is provided in terms of value, measured in Million and volume, measured in K Unit.
11. Are there any specific market keywords associated with the report?
Yes, the market keyword associated with the report is "Radar Industry," which aids in identifying and referencing the specific market segment covered.
12. How do I determine which pricing option suits my needs best?
The pricing options vary based on user requirements and access needs. Individual users may opt for single-user licenses, while businesses requiring broader access may choose multi-user or enterprise licenses for cost-effective access to the report.
13. Are there any additional resources or data provided in the Radar Industry report?
While the report offers comprehensive insights, it's advisable to review the specific contents or supplementary materials provided to ascertain if additional resources or data are available.
14. How can I stay updated on further developments or reports in the Radar Industry?
To stay informed about further developments, trends, and reports in the Radar Industry, consider subscribing to industry newsletters, following relevant companies and organizations, or regularly checking reputable industry news sources and publications.
Methodology
Step 1 - Identification of Relevant Samples Size from Population Database


Step 2 - Approaches for Defining Global Market Size (Value, Volume* & Price*)

Note*: In applicable scenarios
Step 3 - Data Sources
Primary Research
- Web Analytics
- Survey Reports
- Research Institute
- Latest Research Reports
- Opinion Leaders
Secondary Research
- Annual Reports
- White Paper
- Latest Press Release
- Industry Association
- Paid Database
- Investor Presentations

Step 4 - Data Triangulation
Involves using different sources of information in order to increase the validity of a study
These sources are likely to be stakeholders in a program - participants, other researchers, program staff, other community members, and so on.
Then we put all data in single framework & apply various statistical tools to find out the dynamic on the market.
During the analysis stage, feedback from the stakeholder groups would be compared to determine areas of agreement as well as areas of divergence


