
Key Insights
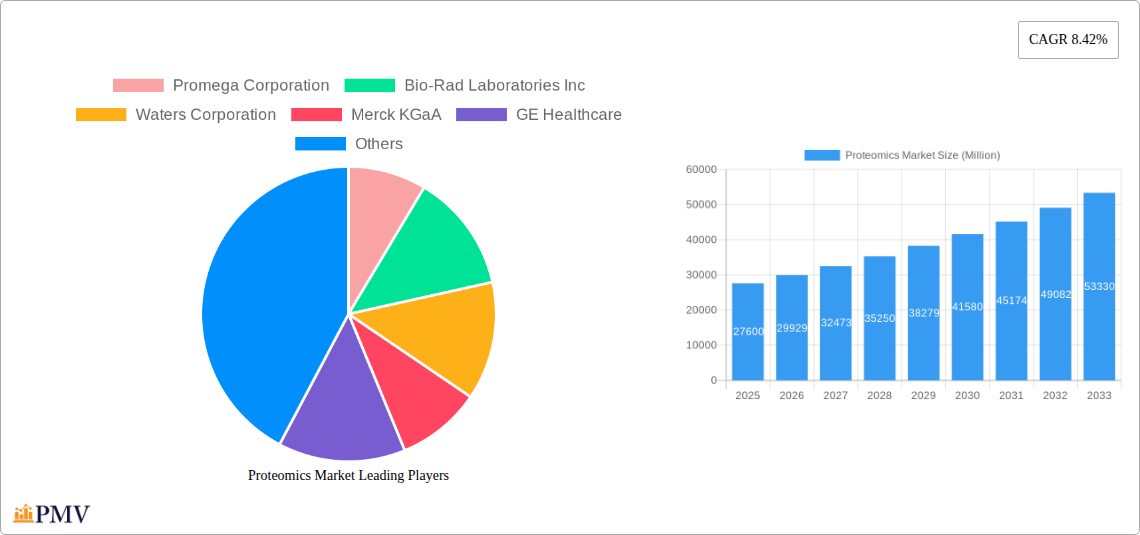
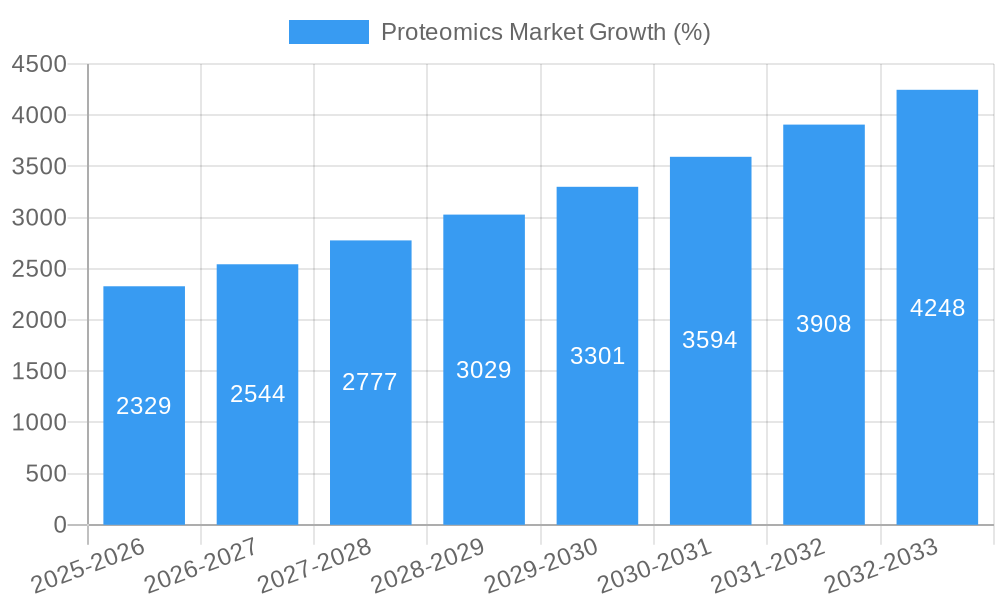
The global proteomics market, valued at $27.60 billion in 2025, is projected to experience robust growth, driven by the increasing prevalence of chronic diseases necessitating advanced diagnostic tools and the burgeoning demand for personalized medicine. Technological advancements in mass spectrometry, chromatography, and bioinformatics are fueling market expansion, enabling researchers to analyze complex protein samples with greater speed and accuracy. The clinical diagnostics application segment is a major revenue contributor, owing to the crucial role of proteomics in early disease detection, prognosis, and treatment monitoring. Drug discovery and development also significantly leverage proteomics for identifying novel drug targets and assessing drug efficacy and safety. Furthermore, the rising adoption of proteomics in research settings, coupled with increased funding for life science research initiatives across the globe, is bolstering market growth.
While the market faces certain challenges like the high cost of instrumentation and the complexity of data analysis, these are being gradually mitigated by the development of more affordable and user-friendly technologies. The market is segmented by product and services (instrumentation technology, reagents, software, and services) and application (clinical diagnostics, drug discovery, and other applications). North America currently holds a dominant market share, owing to robust research infrastructure and high healthcare expenditure. However, the Asia-Pacific region is expected to witness the fastest growth rate over the forecast period, driven by expanding healthcare budgets, rising prevalence of chronic diseases, and growing awareness of proteomics applications. Major players in the market such as Promega Corporation, Bio-Rad Laboratories, and Thermo Fisher Scientific are continuously investing in R&D and strategic partnerships to enhance their market positioning and drive further innovation within the proteomics landscape.
Deep Dive into the Proteomics Market: A Comprehensive Report (2019-2033)
This comprehensive report provides an in-depth analysis of the global Proteomics Market, offering invaluable insights for stakeholders across the industry. Covering the period from 2019 to 2033, with 2025 as the base year, this report meticulously examines market dynamics, competitive landscapes, and future growth trajectories. The market is projected to reach xx Million by 2033, exhibiting a CAGR of xx% during the forecast period (2025-2033).
Proteomics Market Market Structure & Competitive Dynamics
The Proteomics market exhibits a moderately consolidated structure, with key players like Thermo Fisher Scientific Inc, Danaher Corporation, and Agilent Technologies Inc holding significant market share. However, a dynamic innovation ecosystem fosters competition, particularly from smaller, specialized companies. Regulatory frameworks, including those governing clinical diagnostics and drug development, significantly influence market dynamics. Product substitutes, such as genomics-based approaches, pose a competitive challenge, although the unique capabilities of proteomics continue to drive demand. End-user trends, notably towards personalized medicine and advanced diagnostics, fuel market expansion. M&A activity has been notable, with several significant deals exceeding xx Million in value during the historical period (2019-2024), signifying consolidation and expansion strategies within the industry. Market share data for key players will be detailed in the full report.
- Market Concentration: Moderately consolidated, with top 5 players accounting for approximately xx% of market share in 2024.
- Innovation Ecosystems: High level of R&D activity driving the development of advanced instrumentation and software solutions.
- Regulatory Frameworks: Stringent regulatory approvals for clinical diagnostics and therapeutics impact market growth.
- Product Substitutes: Genomics and other "omics" technologies pose moderate competitive pressure.
- End-User Trends: Increasing demand for personalized medicine and advanced diagnostics are key growth drivers.
- M&A Activities: Significant M&A activity observed, with total deal value exceeding xx Million in 2024.
Proteomics Market Industry Trends & Insights
The Proteomics market is experiencing robust growth, driven by the increasing adoption of proteomics technologies in various applications, including clinical diagnostics, drug discovery, and research. The rising prevalence of chronic diseases, coupled with the growing need for early and precise diagnostics, is a key market driver. Technological advancements, such as the development of high-throughput mass spectrometry and advanced bioinformatics tools, are significantly improving the efficiency and accuracy of proteomic analysis, contributing to the market's expansion. Consumer preferences are shifting towards more personalized healthcare solutions, further fueling the demand for proteomics-based services. The competitive landscape is characterized by intense competition among major players, leading to continuous innovation and product development. The market penetration of proteomics technologies in clinical settings is expected to increase substantially during the forecast period, resulting in significant market growth.
Dominant Markets & Segments in Proteomics Market
The North American region currently dominates the global Proteomics market, fueled by robust funding for research and development, coupled with a well-established healthcare infrastructure and a strong regulatory framework. Within the segments, the Instrumentation Technology sector holds the largest market share, driven by the increasing adoption of advanced mass spectrometry systems. The Clinical Diagnostics application segment is projected to experience the highest growth rate due to the rising prevalence of chronic diseases and the growing need for more accurate diagnostic tools.
- Leading Region: North America. Key drivers include robust R&D funding, advanced healthcare infrastructure, and supportive regulatory frameworks.
- Leading Product Segment: Instrumentation Technology, particularly Mass Spectrometry systems. Drivers include increasing throughput and sensitivity of instruments.
- Leading Application Segment: Clinical Diagnostics, driven by the growing need for early and accurate disease diagnosis.
- Key Growth Drivers for North America: Strong government funding for R&D, and high adoption of advanced technologies in clinical settings.
- Key Growth Drivers for Clinical Diagnostics: Increasing prevalence of chronic diseases, demand for personalized medicine, and improved diagnostic accuracy.
Proteomics Market Product Innovations
Recent innovations in proteomics encompass advancements in mass spectrometry technologies, including higher sensitivity and throughput instruments, alongside improved bioinformatics tools for data analysis. These innovations are driving broader application in drug discovery and development, enabling the identification of novel biomarkers and drug targets. Furthermore, the development of miniaturized and automated systems enhances accessibility and efficiency. These advancements enhance the market fit by addressing the limitations of previous technologies and expanding the applications of proteomics across various fields.
Report Segmentation & Scope
This report comprehensively segments the Proteomics market based on Product & Services (Instrumentation Technology, Reagents, Software and Services) and Application (Clinical Diagnostics, Drug Discovery, Other Applications). Each segment's market size, growth projections, and competitive dynamics are analyzed in detail, providing a granular understanding of the market landscape. For example, the Instrumentation Technology segment is further divided based on technology type (e.g., Mass Spectrometry, Chromatography), while the Application segment is divided by specific therapeutic areas within Drug Discovery and diagnostic applications within Clinical Diagnostics. Growth projections for each segment are based on extensive market research and analysis of industry trends.
Key Drivers of Proteomics Market Growth
The Proteomics market is propelled by several key factors: the rising prevalence of chronic diseases necessitating improved diagnostics; technological advancements, such as the development of high-throughput and highly sensitive mass spectrometry systems; the increasing demand for personalized medicine; and growing investments in R&D from both public and private sectors. Furthermore, supportive regulatory frameworks and the potential for drug development based on proteomic findings fuel market growth.
Challenges in the Proteomics Market Sector
Despite its promising potential, the Proteomics market faces certain challenges, including high instrumentation costs, which limits accessibility, particularly in resource-constrained settings. Complex data analysis and interpretation, requiring specialized expertise, also presents a barrier. Competition from emerging technologies and regulatory hurdles in clinical applications further pose significant challenges. Supply chain disruptions impacting the availability of reagents and consumables can also impact growth. These factors could collectively impede market expansion if not adequately addressed.
Leading Players in the Proteomics Market Market
- Promega Corporation
- Bio-Rad Laboratories Inc
- Waters Corporation
- Merck KGaA
- GE Healthcare
- Thermo Fisher Scientific Inc
- Danaher Corporation
- Agilent Technologies Inc
- Bruker Corporation
Key Developments in Proteomics Market Sector
- January 2023: Thermo Fisher Scientific launched a new mass spectrometry system, expanding its capabilities in proteomics research.
- June 2022: Bio-Rad Laboratories announced a partnership to develop novel proteomics reagents.
- October 2021: Merck KGaA acquired a smaller proteomics company, strengthening its portfolio.
- (Further details on key developments with specific dates will be included in the complete report.)
Strategic Proteomics Market Market Outlook
The Proteomics market is poised for substantial growth, driven by ongoing technological innovations, increasing adoption in clinical settings, and the expanding application in drug discovery and development. Strategic opportunities exist for companies to invest in R&D, particularly in developing cost-effective and user-friendly technologies, expanding into emerging markets, and forging strategic partnerships to enhance market penetration. The future prospects of proteomics are exceptionally promising, and this market is expected to significantly contribute to advancements in healthcare and life sciences.
Proteomics Market Segmentation
-
1. Product & Services
-
1.1. Instrumentation Technology
- 1.1.1. Spectroscopy
- 1.1.2. Chromatography
- 1.1.3. Electrophoresis
- 1.1.4. Protein Microarrays
- 1.1.5. X-Ray Crystallography
- 1.1.6. Other Instrumentation Technologies
- 1.2. Reagents
- 1.3. Software and Services
-
1.1. Instrumentation Technology
-
2. Application
- 2.1. Clinical Diagnostics
- 2.2. Drug Discovery
- 2.3. Other Applications
Proteomics Market Segmentation By Geography
-
1. North America
- 1.1. United States
- 1.2. Canada
- 1.3. Mexico
-
2. Europe
- 2.1. Germany
- 2.2. United Kingdom
- 2.3. France
- 2.4. Italy
- 2.5. Spain
- 2.6. Rest of Europe
-
3. Asia Pacific
- 3.1. China
- 3.2. Japan
- 3.3. India
- 3.4. Australia
- 3.5. South Korea
- 3.6. Rest of Asia Pacific
- 4. Middle East
-
5. GCC
- 5.1. South Africa
- 5.2. Rest of Middle East
-
6. South America
- 6.1. Brazil
- 6.2. Argentina
- 6.3. Rest of South America

Proteomics Market REPORT HIGHLIGHTS
| Aspects | Details |
|---|---|
| Study Period | 2019-2033 |
| Base Year | 2024 |
| Estimated Year | 2025 |
| Forecast Period | 2025-2033 |
| Historical Period | 2019-2024 |
| Growth Rate | CAGR of 8.42% from 2019-2033 |
| Segmentation |
|
Table of Contents
- 1. Introduction
- 1.1. Research Scope
- 1.2. Market Segmentation
- 1.3. Research Methodology
- 1.4. Definitions and Assumptions
- 2. Executive Summary
- 2.1. Introduction
- 3. Market Dynamics
- 3.1. Introduction
- 3.2. Market Drivers
- 3.2.1. Rising Demand for Personalized Medicine; Increasing R&D Expenditure and Government Funding for Proteomics; Technological Advancements
- 3.3. Market Restrains
- 3.3.1. High Cost of Instruments
- 3.4. Market Trends
- 3.4.1. Drug Discovery is Expected to Witness Healthy CAGR in Future
- 4. Market Factor Analysis
- 4.1. Porters Five Forces
- 4.2. Supply/Value Chain
- 4.3. PESTEL analysis
- 4.4. Market Entropy
- 4.5. Patent/Trademark Analysis
- 5. Global Proteomics Market Analysis, Insights and Forecast, 2019-2031
- 5.1. Market Analysis, Insights and Forecast - by Product & Services
- 5.1.1. Instrumentation Technology
- 5.1.1.1. Spectroscopy
- 5.1.1.2. Chromatography
- 5.1.1.3. Electrophoresis
- 5.1.1.4. Protein Microarrays
- 5.1.1.5. X-Ray Crystallography
- 5.1.1.6. Other Instrumentation Technologies
- 5.1.2. Reagents
- 5.1.3. Software and Services
- 5.1.1. Instrumentation Technology
- 5.2. Market Analysis, Insights and Forecast - by Application
- 5.2.1. Clinical Diagnostics
- 5.2.2. Drug Discovery
- 5.2.3. Other Applications
- 5.3. Market Analysis, Insights and Forecast - by Region
- 5.3.1. North America
- 5.3.2. Europe
- 5.3.3. Asia Pacific
- 5.3.4. Middle East
- 5.3.5. GCC
- 5.3.6. South America
- 5.1. Market Analysis, Insights and Forecast - by Product & Services
- 6. North America Proteomics Market Analysis, Insights and Forecast, 2019-2031
- 6.1. Market Analysis, Insights and Forecast - by Product & Services
- 6.1.1. Instrumentation Technology
- 6.1.1.1. Spectroscopy
- 6.1.1.2. Chromatography
- 6.1.1.3. Electrophoresis
- 6.1.1.4. Protein Microarrays
- 6.1.1.5. X-Ray Crystallography
- 6.1.1.6. Other Instrumentation Technologies
- 6.1.2. Reagents
- 6.1.3. Software and Services
- 6.1.1. Instrumentation Technology
- 6.2. Market Analysis, Insights and Forecast - by Application
- 6.2.1. Clinical Diagnostics
- 6.2.2. Drug Discovery
- 6.2.3. Other Applications
- 6.1. Market Analysis, Insights and Forecast - by Product & Services
- 7. Europe Proteomics Market Analysis, Insights and Forecast, 2019-2031
- 7.1. Market Analysis, Insights and Forecast - by Product & Services
- 7.1.1. Instrumentation Technology
- 7.1.1.1. Spectroscopy
- 7.1.1.2. Chromatography
- 7.1.1.3. Electrophoresis
- 7.1.1.4. Protein Microarrays
- 7.1.1.5. X-Ray Crystallography
- 7.1.1.6. Other Instrumentation Technologies
- 7.1.2. Reagents
- 7.1.3. Software and Services
- 7.1.1. Instrumentation Technology
- 7.2. Market Analysis, Insights and Forecast - by Application
- 7.2.1. Clinical Diagnostics
- 7.2.2. Drug Discovery
- 7.2.3. Other Applications
- 7.1. Market Analysis, Insights and Forecast - by Product & Services
- 8. Asia Pacific Proteomics Market Analysis, Insights and Forecast, 2019-2031
- 8.1. Market Analysis, Insights and Forecast - by Product & Services
- 8.1.1. Instrumentation Technology
- 8.1.1.1. Spectroscopy
- 8.1.1.2. Chromatography
- 8.1.1.3. Electrophoresis
- 8.1.1.4. Protein Microarrays
- 8.1.1.5. X-Ray Crystallography
- 8.1.1.6. Other Instrumentation Technologies
- 8.1.2. Reagents
- 8.1.3. Software and Services
- 8.1.1. Instrumentation Technology
- 8.2. Market Analysis, Insights and Forecast - by Application
- 8.2.1. Clinical Diagnostics
- 8.2.2. Drug Discovery
- 8.2.3. Other Applications
- 8.1. Market Analysis, Insights and Forecast - by Product & Services
- 9. Middle East Proteomics Market Analysis, Insights and Forecast, 2019-2031
- 9.1. Market Analysis, Insights and Forecast - by Product & Services
- 9.1.1. Instrumentation Technology
- 9.1.1.1. Spectroscopy
- 9.1.1.2. Chromatography
- 9.1.1.3. Electrophoresis
- 9.1.1.4. Protein Microarrays
- 9.1.1.5. X-Ray Crystallography
- 9.1.1.6. Other Instrumentation Technologies
- 9.1.2. Reagents
- 9.1.3. Software and Services
- 9.1.1. Instrumentation Technology
- 9.2. Market Analysis, Insights and Forecast - by Application
- 9.2.1. Clinical Diagnostics
- 9.2.2. Drug Discovery
- 9.2.3. Other Applications
- 9.1. Market Analysis, Insights and Forecast - by Product & Services
- 10. GCC Proteomics Market Analysis, Insights and Forecast, 2019-2031
- 10.1. Market Analysis, Insights and Forecast - by Product & Services
- 10.1.1. Instrumentation Technology
- 10.1.1.1. Spectroscopy
- 10.1.1.2. Chromatography
- 10.1.1.3. Electrophoresis
- 10.1.1.4. Protein Microarrays
- 10.1.1.5. X-Ray Crystallography
- 10.1.1.6. Other Instrumentation Technologies
- 10.1.2. Reagents
- 10.1.3. Software and Services
- 10.1.1. Instrumentation Technology
- 10.2. Market Analysis, Insights and Forecast - by Application
- 10.2.1. Clinical Diagnostics
- 10.2.2. Drug Discovery
- 10.2.3. Other Applications
- 10.1. Market Analysis, Insights and Forecast - by Product & Services
- 11. South America Proteomics Market Analysis, Insights and Forecast, 2019-2031
- 11.1. Market Analysis, Insights and Forecast - by Product & Services
- 11.1.1. Instrumentation Technology
- 11.1.1.1. Spectroscopy
- 11.1.1.2. Chromatography
- 11.1.1.3. Electrophoresis
- 11.1.1.4. Protein Microarrays
- 11.1.1.5. X-Ray Crystallography
- 11.1.1.6. Other Instrumentation Technologies
- 11.1.2. Reagents
- 11.1.3. Software and Services
- 11.1.1. Instrumentation Technology
- 11.2. Market Analysis, Insights and Forecast - by Application
- 11.2.1. Clinical Diagnostics
- 11.2.2. Drug Discovery
- 11.2.3. Other Applications
- 11.1. Market Analysis, Insights and Forecast - by Product & Services
- 12. North America Proteomics Market Analysis, Insights and Forecast, 2019-2031
- 12.1. Market Analysis, Insights and Forecast - By Country/Sub-region
- 12.1.1 United States
- 12.1.2 Canada
- 12.1.3 Mexico
- 13. Europe Proteomics Market Analysis, Insights and Forecast, 2019-2031
- 13.1. Market Analysis, Insights and Forecast - By Country/Sub-region
- 13.1.1 Germany
- 13.1.2 United Kingdom
- 13.1.3 France
- 13.1.4 Italy
- 13.1.5 Spain
- 13.1.6 Rest of Europe
- 14. Asia Pacific Proteomics Market Analysis, Insights and Forecast, 2019-2031
- 14.1. Market Analysis, Insights and Forecast - By Country/Sub-region
- 14.1.1 China
- 14.1.2 Japan
- 14.1.3 India
- 14.1.4 Australia
- 14.1.5 South Korea
- 14.1.6 Rest of Asia Pacific
- 15. Middle East Proteomics Market Analysis, Insights and Forecast, 2019-2031
- 15.1. Market Analysis, Insights and Forecast - By Country/Sub-region
- 15.1.1.
- 16. GCC Proteomics Market Analysis, Insights and Forecast, 2019-2031
- 16.1. Market Analysis, Insights and Forecast - By Country/Sub-region
- 16.1.1 South Africa
- 16.1.2 Rest of Middle East
- 17. South America Proteomics Market Analysis, Insights and Forecast, 2019-2031
- 17.1. Market Analysis, Insights and Forecast - By Country/Sub-region
- 17.1.1 Brazil
- 17.1.2 Argentina
- 17.1.3 Rest of South America
- 18. Competitive Analysis
- 18.1. Global Market Share Analysis 2024
- 18.2. Company Profiles
- 18.2.1 Promega Corporation
- 18.2.1.1. Overview
- 18.2.1.2. Products
- 18.2.1.3. SWOT Analysis
- 18.2.1.4. Recent Developments
- 18.2.1.5. Financials (Based on Availability)
- 18.2.2 Bio-Rad Laboratories Inc
- 18.2.2.1. Overview
- 18.2.2.2. Products
- 18.2.2.3. SWOT Analysis
- 18.2.2.4. Recent Developments
- 18.2.2.5. Financials (Based on Availability)
- 18.2.3 Waters Corporation
- 18.2.3.1. Overview
- 18.2.3.2. Products
- 18.2.3.3. SWOT Analysis
- 18.2.3.4. Recent Developments
- 18.2.3.5. Financials (Based on Availability)
- 18.2.4 Merck KGaA
- 18.2.4.1. Overview
- 18.2.4.2. Products
- 18.2.4.3. SWOT Analysis
- 18.2.4.4. Recent Developments
- 18.2.4.5. Financials (Based on Availability)
- 18.2.5 GE Healthcare
- 18.2.5.1. Overview
- 18.2.5.2. Products
- 18.2.5.3. SWOT Analysis
- 18.2.5.4. Recent Developments
- 18.2.5.5. Financials (Based on Availability)
- 18.2.6 Thermo Fisher Scientific Inc
- 18.2.6.1. Overview
- 18.2.6.2. Products
- 18.2.6.3. SWOT Analysis
- 18.2.6.4. Recent Developments
- 18.2.6.5. Financials (Based on Availability)
- 18.2.7 Danaher Corporation
- 18.2.7.1. Overview
- 18.2.7.2. Products
- 18.2.7.3. SWOT Analysis
- 18.2.7.4. Recent Developments
- 18.2.7.5. Financials (Based on Availability)
- 18.2.8 Agilent Technologies Inc
- 18.2.8.1. Overview
- 18.2.8.2. Products
- 18.2.8.3. SWOT Analysis
- 18.2.8.4. Recent Developments
- 18.2.8.5. Financials (Based on Availability)
- 18.2.9 Bruker Corporation
- 18.2.9.1. Overview
- 18.2.9.2. Products
- 18.2.9.3. SWOT Analysis
- 18.2.9.4. Recent Developments
- 18.2.9.5. Financials (Based on Availability)
- 18.2.1 Promega Corporation
List of Figures
- Figure 1: Global Proteomics Market Revenue Breakdown (Million, %) by Region 2024 & 2032
- Figure 2: Global Proteomics Market Volume Breakdown (K Unit, %) by Region 2024 & 2032
- Figure 3: North America Proteomics Market Revenue (Million), by Country 2024 & 2032
- Figure 4: North America Proteomics Market Volume (K Unit), by Country 2024 & 2032
- Figure 5: North America Proteomics Market Revenue Share (%), by Country 2024 & 2032
- Figure 6: North America Proteomics Market Volume Share (%), by Country 2024 & 2032
- Figure 7: Europe Proteomics Market Revenue (Million), by Country 2024 & 2032
- Figure 8: Europe Proteomics Market Volume (K Unit), by Country 2024 & 2032
- Figure 9: Europe Proteomics Market Revenue Share (%), by Country 2024 & 2032
- Figure 10: Europe Proteomics Market Volume Share (%), by Country 2024 & 2032
- Figure 11: Asia Pacific Proteomics Market Revenue (Million), by Country 2024 & 2032
- Figure 12: Asia Pacific Proteomics Market Volume (K Unit), by Country 2024 & 2032
- Figure 13: Asia Pacific Proteomics Market Revenue Share (%), by Country 2024 & 2032
- Figure 14: Asia Pacific Proteomics Market Volume Share (%), by Country 2024 & 2032
- Figure 15: Middle East Proteomics Market Revenue (Million), by Country 2024 & 2032
- Figure 16: Middle East Proteomics Market Volume (K Unit), by Country 2024 & 2032
- Figure 17: Middle East Proteomics Market Revenue Share (%), by Country 2024 & 2032
- Figure 18: Middle East Proteomics Market Volume Share (%), by Country 2024 & 2032
- Figure 19: GCC Proteomics Market Revenue (Million), by Country 2024 & 2032
- Figure 20: GCC Proteomics Market Volume (K Unit), by Country 2024 & 2032
- Figure 21: GCC Proteomics Market Revenue Share (%), by Country 2024 & 2032
- Figure 22: GCC Proteomics Market Volume Share (%), by Country 2024 & 2032
- Figure 23: South America Proteomics Market Revenue (Million), by Country 2024 & 2032
- Figure 24: South America Proteomics Market Volume (K Unit), by Country 2024 & 2032
- Figure 25: South America Proteomics Market Revenue Share (%), by Country 2024 & 2032
- Figure 26: South America Proteomics Market Volume Share (%), by Country 2024 & 2032
- Figure 27: North America Proteomics Market Revenue (Million), by Product & Services 2024 & 2032
- Figure 28: North America Proteomics Market Volume (K Unit), by Product & Services 2024 & 2032
- Figure 29: North America Proteomics Market Revenue Share (%), by Product & Services 2024 & 2032
- Figure 30: North America Proteomics Market Volume Share (%), by Product & Services 2024 & 2032
- Figure 31: North America Proteomics Market Revenue (Million), by Application 2024 & 2032
- Figure 32: North America Proteomics Market Volume (K Unit), by Application 2024 & 2032
- Figure 33: North America Proteomics Market Revenue Share (%), by Application 2024 & 2032
- Figure 34: North America Proteomics Market Volume Share (%), by Application 2024 & 2032
- Figure 35: North America Proteomics Market Revenue (Million), by Country 2024 & 2032
- Figure 36: North America Proteomics Market Volume (K Unit), by Country 2024 & 2032
- Figure 37: North America Proteomics Market Revenue Share (%), by Country 2024 & 2032
- Figure 38: North America Proteomics Market Volume Share (%), by Country 2024 & 2032
- Figure 39: Europe Proteomics Market Revenue (Million), by Product & Services 2024 & 2032
- Figure 40: Europe Proteomics Market Volume (K Unit), by Product & Services 2024 & 2032
- Figure 41: Europe Proteomics Market Revenue Share (%), by Product & Services 2024 & 2032
- Figure 42: Europe Proteomics Market Volume Share (%), by Product & Services 2024 & 2032
- Figure 43: Europe Proteomics Market Revenue (Million), by Application 2024 & 2032
- Figure 44: Europe Proteomics Market Volume (K Unit), by Application 2024 & 2032
- Figure 45: Europe Proteomics Market Revenue Share (%), by Application 2024 & 2032
- Figure 46: Europe Proteomics Market Volume Share (%), by Application 2024 & 2032
- Figure 47: Europe Proteomics Market Revenue (Million), by Country 2024 & 2032
- Figure 48: Europe Proteomics Market Volume (K Unit), by Country 2024 & 2032
- Figure 49: Europe Proteomics Market Revenue Share (%), by Country 2024 & 2032
- Figure 50: Europe Proteomics Market Volume Share (%), by Country 2024 & 2032
- Figure 51: Asia Pacific Proteomics Market Revenue (Million), by Product & Services 2024 & 2032
- Figure 52: Asia Pacific Proteomics Market Volume (K Unit), by Product & Services 2024 & 2032
- Figure 53: Asia Pacific Proteomics Market Revenue Share (%), by Product & Services 2024 & 2032
- Figure 54: Asia Pacific Proteomics Market Volume Share (%), by Product & Services 2024 & 2032
- Figure 55: Asia Pacific Proteomics Market Revenue (Million), by Application 2024 & 2032
- Figure 56: Asia Pacific Proteomics Market Volume (K Unit), by Application 2024 & 2032
- Figure 57: Asia Pacific Proteomics Market Revenue Share (%), by Application 2024 & 2032
- Figure 58: Asia Pacific Proteomics Market Volume Share (%), by Application 2024 & 2032
- Figure 59: Asia Pacific Proteomics Market Revenue (Million), by Country 2024 & 2032
- Figure 60: Asia Pacific Proteomics Market Volume (K Unit), by Country 2024 & 2032
- Figure 61: Asia Pacific Proteomics Market Revenue Share (%), by Country 2024 & 2032
- Figure 62: Asia Pacific Proteomics Market Volume Share (%), by Country 2024 & 2032
- Figure 63: Middle East Proteomics Market Revenue (Million), by Product & Services 2024 & 2032
- Figure 64: Middle East Proteomics Market Volume (K Unit), by Product & Services 2024 & 2032
- Figure 65: Middle East Proteomics Market Revenue Share (%), by Product & Services 2024 & 2032
- Figure 66: Middle East Proteomics Market Volume Share (%), by Product & Services 2024 & 2032
- Figure 67: Middle East Proteomics Market Revenue (Million), by Application 2024 & 2032
- Figure 68: Middle East Proteomics Market Volume (K Unit), by Application 2024 & 2032
- Figure 69: Middle East Proteomics Market Revenue Share (%), by Application 2024 & 2032
- Figure 70: Middle East Proteomics Market Volume Share (%), by Application 2024 & 2032
- Figure 71: Middle East Proteomics Market Revenue (Million), by Country 2024 & 2032
- Figure 72: Middle East Proteomics Market Volume (K Unit), by Country 2024 & 2032
- Figure 73: Middle East Proteomics Market Revenue Share (%), by Country 2024 & 2032
- Figure 74: Middle East Proteomics Market Volume Share (%), by Country 2024 & 2032
- Figure 75: GCC Proteomics Market Revenue (Million), by Product & Services 2024 & 2032
- Figure 76: GCC Proteomics Market Volume (K Unit), by Product & Services 2024 & 2032
- Figure 77: GCC Proteomics Market Revenue Share (%), by Product & Services 2024 & 2032
- Figure 78: GCC Proteomics Market Volume Share (%), by Product & Services 2024 & 2032
- Figure 79: GCC Proteomics Market Revenue (Million), by Application 2024 & 2032
- Figure 80: GCC Proteomics Market Volume (K Unit), by Application 2024 & 2032
- Figure 81: GCC Proteomics Market Revenue Share (%), by Application 2024 & 2032
- Figure 82: GCC Proteomics Market Volume Share (%), by Application 2024 & 2032
- Figure 83: GCC Proteomics Market Revenue (Million), by Country 2024 & 2032
- Figure 84: GCC Proteomics Market Volume (K Unit), by Country 2024 & 2032
- Figure 85: GCC Proteomics Market Revenue Share (%), by Country 2024 & 2032
- Figure 86: GCC Proteomics Market Volume Share (%), by Country 2024 & 2032
- Figure 87: South America Proteomics Market Revenue (Million), by Product & Services 2024 & 2032
- Figure 88: South America Proteomics Market Volume (K Unit), by Product & Services 2024 & 2032
- Figure 89: South America Proteomics Market Revenue Share (%), by Product & Services 2024 & 2032
- Figure 90: South America Proteomics Market Volume Share (%), by Product & Services 2024 & 2032
- Figure 91: South America Proteomics Market Revenue (Million), by Application 2024 & 2032
- Figure 92: South America Proteomics Market Volume (K Unit), by Application 2024 & 2032
- Figure 93: South America Proteomics Market Revenue Share (%), by Application 2024 & 2032
- Figure 94: South America Proteomics Market Volume Share (%), by Application 2024 & 2032
- Figure 95: South America Proteomics Market Revenue (Million), by Country 2024 & 2032
- Figure 96: South America Proteomics Market Volume (K Unit), by Country 2024 & 2032
- Figure 97: South America Proteomics Market Revenue Share (%), by Country 2024 & 2032
- Figure 98: South America Proteomics Market Volume Share (%), by Country 2024 & 2032
List of Tables
- Table 1: Global Proteomics Market Revenue Million Forecast, by Region 2019 & 2032
- Table 2: Global Proteomics Market Volume K Unit Forecast, by Region 2019 & 2032
- Table 3: Global Proteomics Market Revenue Million Forecast, by Product & Services 2019 & 2032
- Table 4: Global Proteomics Market Volume K Unit Forecast, by Product & Services 2019 & 2032
- Table 5: Global Proteomics Market Revenue Million Forecast, by Application 2019 & 2032
- Table 6: Global Proteomics Market Volume K Unit Forecast, by Application 2019 & 2032
- Table 7: Global Proteomics Market Revenue Million Forecast, by Region 2019 & 2032
- Table 8: Global Proteomics Market Volume K Unit Forecast, by Region 2019 & 2032
- Table 9: Global Proteomics Market Revenue Million Forecast, by Country 2019 & 2032
- Table 10: Global Proteomics Market Volume K Unit Forecast, by Country 2019 & 2032
- Table 11: United States Proteomics Market Revenue (Million) Forecast, by Application 2019 & 2032
- Table 12: United States Proteomics Market Volume (K Unit) Forecast, by Application 2019 & 2032
- Table 13: Canada Proteomics Market Revenue (Million) Forecast, by Application 2019 & 2032
- Table 14: Canada Proteomics Market Volume (K Unit) Forecast, by Application 2019 & 2032
- Table 15: Mexico Proteomics Market Revenue (Million) Forecast, by Application 2019 & 2032
- Table 16: Mexico Proteomics Market Volume (K Unit) Forecast, by Application 2019 & 2032
- Table 17: Global Proteomics Market Revenue Million Forecast, by Country 2019 & 2032
- Table 18: Global Proteomics Market Volume K Unit Forecast, by Country 2019 & 2032
- Table 19: Germany Proteomics Market Revenue (Million) Forecast, by Application 2019 & 2032
- Table 20: Germany Proteomics Market Volume (K Unit) Forecast, by Application 2019 & 2032
- Table 21: United Kingdom Proteomics Market Revenue (Million) Forecast, by Application 2019 & 2032
- Table 22: United Kingdom Proteomics Market Volume (K Unit) Forecast, by Application 2019 & 2032
- Table 23: France Proteomics Market Revenue (Million) Forecast, by Application 2019 & 2032
- Table 24: France Proteomics Market Volume (K Unit) Forecast, by Application 2019 & 2032
- Table 25: Italy Proteomics Market Revenue (Million) Forecast, by Application 2019 & 2032
- Table 26: Italy Proteomics Market Volume (K Unit) Forecast, by Application 2019 & 2032
- Table 27: Spain Proteomics Market Revenue (Million) Forecast, by Application 2019 & 2032
- Table 28: Spain Proteomics Market Volume (K Unit) Forecast, by Application 2019 & 2032
- Table 29: Rest of Europe Proteomics Market Revenue (Million) Forecast, by Application 2019 & 2032
- Table 30: Rest of Europe Proteomics Market Volume (K Unit) Forecast, by Application 2019 & 2032
- Table 31: Global Proteomics Market Revenue Million Forecast, by Country 2019 & 2032
- Table 32: Global Proteomics Market Volume K Unit Forecast, by Country 2019 & 2032
- Table 33: China Proteomics Market Revenue (Million) Forecast, by Application 2019 & 2032
- Table 34: China Proteomics Market Volume (K Unit) Forecast, by Application 2019 & 2032
- Table 35: Japan Proteomics Market Revenue (Million) Forecast, by Application 2019 & 2032
- Table 36: Japan Proteomics Market Volume (K Unit) Forecast, by Application 2019 & 2032
- Table 37: India Proteomics Market Revenue (Million) Forecast, by Application 2019 & 2032
- Table 38: India Proteomics Market Volume (K Unit) Forecast, by Application 2019 & 2032
- Table 39: Australia Proteomics Market Revenue (Million) Forecast, by Application 2019 & 2032
- Table 40: Australia Proteomics Market Volume (K Unit) Forecast, by Application 2019 & 2032
- Table 41: South Korea Proteomics Market Revenue (Million) Forecast, by Application 2019 & 2032
- Table 42: South Korea Proteomics Market Volume (K Unit) Forecast, by Application 2019 & 2032
- Table 43: Rest of Asia Pacific Proteomics Market Revenue (Million) Forecast, by Application 2019 & 2032
- Table 44: Rest of Asia Pacific Proteomics Market Volume (K Unit) Forecast, by Application 2019 & 2032
- Table 45: Global Proteomics Market Revenue Million Forecast, by Country 2019 & 2032
- Table 46: Global Proteomics Market Volume K Unit Forecast, by Country 2019 & 2032
- Table 47: Proteomics Market Revenue (Million) Forecast, by Application 2019 & 2032
- Table 48: Proteomics Market Volume (K Unit) Forecast, by Application 2019 & 2032
- Table 49: Global Proteomics Market Revenue Million Forecast, by Country 2019 & 2032
- Table 50: Global Proteomics Market Volume K Unit Forecast, by Country 2019 & 2032
- Table 51: South Africa Proteomics Market Revenue (Million) Forecast, by Application 2019 & 2032
- Table 52: South Africa Proteomics Market Volume (K Unit) Forecast, by Application 2019 & 2032
- Table 53: Rest of Middle East Proteomics Market Revenue (Million) Forecast, by Application 2019 & 2032
- Table 54: Rest of Middle East Proteomics Market Volume (K Unit) Forecast, by Application 2019 & 2032
- Table 55: Global Proteomics Market Revenue Million Forecast, by Country 2019 & 2032
- Table 56: Global Proteomics Market Volume K Unit Forecast, by Country 2019 & 2032
- Table 57: Brazil Proteomics Market Revenue (Million) Forecast, by Application 2019 & 2032
- Table 58: Brazil Proteomics Market Volume (K Unit) Forecast, by Application 2019 & 2032
- Table 59: Argentina Proteomics Market Revenue (Million) Forecast, by Application 2019 & 2032
- Table 60: Argentina Proteomics Market Volume (K Unit) Forecast, by Application 2019 & 2032
- Table 61: Rest of South America Proteomics Market Revenue (Million) Forecast, by Application 2019 & 2032
- Table 62: Rest of South America Proteomics Market Volume (K Unit) Forecast, by Application 2019 & 2032
- Table 63: Global Proteomics Market Revenue Million Forecast, by Product & Services 2019 & 2032
- Table 64: Global Proteomics Market Volume K Unit Forecast, by Product & Services 2019 & 2032
- Table 65: Global Proteomics Market Revenue Million Forecast, by Application 2019 & 2032
- Table 66: Global Proteomics Market Volume K Unit Forecast, by Application 2019 & 2032
- Table 67: Global Proteomics Market Revenue Million Forecast, by Country 2019 & 2032
- Table 68: Global Proteomics Market Volume K Unit Forecast, by Country 2019 & 2032
- Table 69: United States Proteomics Market Revenue (Million) Forecast, by Application 2019 & 2032
- Table 70: United States Proteomics Market Volume (K Unit) Forecast, by Application 2019 & 2032
- Table 71: Canada Proteomics Market Revenue (Million) Forecast, by Application 2019 & 2032
- Table 72: Canada Proteomics Market Volume (K Unit) Forecast, by Application 2019 & 2032
- Table 73: Mexico Proteomics Market Revenue (Million) Forecast, by Application 2019 & 2032
- Table 74: Mexico Proteomics Market Volume (K Unit) Forecast, by Application 2019 & 2032
- Table 75: Global Proteomics Market Revenue Million Forecast, by Product & Services 2019 & 2032
- Table 76: Global Proteomics Market Volume K Unit Forecast, by Product & Services 2019 & 2032
- Table 77: Global Proteomics Market Revenue Million Forecast, by Application 2019 & 2032
- Table 78: Global Proteomics Market Volume K Unit Forecast, by Application 2019 & 2032
- Table 79: Global Proteomics Market Revenue Million Forecast, by Country 2019 & 2032
- Table 80: Global Proteomics Market Volume K Unit Forecast, by Country 2019 & 2032
- Table 81: Germany Proteomics Market Revenue (Million) Forecast, by Application 2019 & 2032
- Table 82: Germany Proteomics Market Volume (K Unit) Forecast, by Application 2019 & 2032
- Table 83: United Kingdom Proteomics Market Revenue (Million) Forecast, by Application 2019 & 2032
- Table 84: United Kingdom Proteomics Market Volume (K Unit) Forecast, by Application 2019 & 2032
- Table 85: France Proteomics Market Revenue (Million) Forecast, by Application 2019 & 2032
- Table 86: France Proteomics Market Volume (K Unit) Forecast, by Application 2019 & 2032
- Table 87: Italy Proteomics Market Revenue (Million) Forecast, by Application 2019 & 2032
- Table 88: Italy Proteomics Market Volume (K Unit) Forecast, by Application 2019 & 2032
- Table 89: Spain Proteomics Market Revenue (Million) Forecast, by Application 2019 & 2032
- Table 90: Spain Proteomics Market Volume (K Unit) Forecast, by Application 2019 & 2032
- Table 91: Rest of Europe Proteomics Market Revenue (Million) Forecast, by Application 2019 & 2032
- Table 92: Rest of Europe Proteomics Market Volume (K Unit) Forecast, by Application 2019 & 2032
- Table 93: Global Proteomics Market Revenue Million Forecast, by Product & Services 2019 & 2032
- Table 94: Global Proteomics Market Volume K Unit Forecast, by Product & Services 2019 & 2032
- Table 95: Global Proteomics Market Revenue Million Forecast, by Application 2019 & 2032
- Table 96: Global Proteomics Market Volume K Unit Forecast, by Application 2019 & 2032
- Table 97: Global Proteomics Market Revenue Million Forecast, by Country 2019 & 2032
- Table 98: Global Proteomics Market Volume K Unit Forecast, by Country 2019 & 2032
- Table 99: China Proteomics Market Revenue (Million) Forecast, by Application 2019 & 2032
- Table 100: China Proteomics Market Volume (K Unit) Forecast, by Application 2019 & 2032
- Table 101: Japan Proteomics Market Revenue (Million) Forecast, by Application 2019 & 2032
- Table 102: Japan Proteomics Market Volume (K Unit) Forecast, by Application 2019 & 2032
- Table 103: India Proteomics Market Revenue (Million) Forecast, by Application 2019 & 2032
- Table 104: India Proteomics Market Volume (K Unit) Forecast, by Application 2019 & 2032
- Table 105: Australia Proteomics Market Revenue (Million) Forecast, by Application 2019 & 2032
- Table 106: Australia Proteomics Market Volume (K Unit) Forecast, by Application 2019 & 2032
- Table 107: South Korea Proteomics Market Revenue (Million) Forecast, by Application 2019 & 2032
- Table 108: South Korea Proteomics Market Volume (K Unit) Forecast, by Application 2019 & 2032
- Table 109: Rest of Asia Pacific Proteomics Market Revenue (Million) Forecast, by Application 2019 & 2032
- Table 110: Rest of Asia Pacific Proteomics Market Volume (K Unit) Forecast, by Application 2019 & 2032
- Table 111: Global Proteomics Market Revenue Million Forecast, by Product & Services 2019 & 2032
- Table 112: Global Proteomics Market Volume K Unit Forecast, by Product & Services 2019 & 2032
- Table 113: Global Proteomics Market Revenue Million Forecast, by Application 2019 & 2032
- Table 114: Global Proteomics Market Volume K Unit Forecast, by Application 2019 & 2032
- Table 115: Global Proteomics Market Revenue Million Forecast, by Country 2019 & 2032
- Table 116: Global Proteomics Market Volume K Unit Forecast, by Country 2019 & 2032
- Table 117: Global Proteomics Market Revenue Million Forecast, by Product & Services 2019 & 2032
- Table 118: Global Proteomics Market Volume K Unit Forecast, by Product & Services 2019 & 2032
- Table 119: Global Proteomics Market Revenue Million Forecast, by Application 2019 & 2032
- Table 120: Global Proteomics Market Volume K Unit Forecast, by Application 2019 & 2032
- Table 121: Global Proteomics Market Revenue Million Forecast, by Country 2019 & 2032
- Table 122: Global Proteomics Market Volume K Unit Forecast, by Country 2019 & 2032
- Table 123: South Africa Proteomics Market Revenue (Million) Forecast, by Application 2019 & 2032
- Table 124: South Africa Proteomics Market Volume (K Unit) Forecast, by Application 2019 & 2032
- Table 125: Rest of Middle East Proteomics Market Revenue (Million) Forecast, by Application 2019 & 2032
- Table 126: Rest of Middle East Proteomics Market Volume (K Unit) Forecast, by Application 2019 & 2032
- Table 127: Global Proteomics Market Revenue Million Forecast, by Product & Services 2019 & 2032
- Table 128: Global Proteomics Market Volume K Unit Forecast, by Product & Services 2019 & 2032
- Table 129: Global Proteomics Market Revenue Million Forecast, by Application 2019 & 2032
- Table 130: Global Proteomics Market Volume K Unit Forecast, by Application 2019 & 2032
- Table 131: Global Proteomics Market Revenue Million Forecast, by Country 2019 & 2032
- Table 132: Global Proteomics Market Volume K Unit Forecast, by Country 2019 & 2032
- Table 133: Brazil Proteomics Market Revenue (Million) Forecast, by Application 2019 & 2032
- Table 134: Brazil Proteomics Market Volume (K Unit) Forecast, by Application 2019 & 2032
- Table 135: Argentina Proteomics Market Revenue (Million) Forecast, by Application 2019 & 2032
- Table 136: Argentina Proteomics Market Volume (K Unit) Forecast, by Application 2019 & 2032
- Table 137: Rest of South America Proteomics Market Revenue (Million) Forecast, by Application 2019 & 2032
- Table 138: Rest of South America Proteomics Market Volume (K Unit) Forecast, by Application 2019 & 2032
Frequently Asked Questions
1. What is the projected Compound Annual Growth Rate (CAGR) of the Proteomics Market?
The projected CAGR is approximately 8.42%.
2. Which companies are prominent players in the Proteomics Market?
Key companies in the market include Promega Corporation, Bio-Rad Laboratories Inc, Waters Corporation, Merck KGaA, GE Healthcare, Thermo Fisher Scientific Inc, Danaher Corporation, Agilent Technologies Inc, Bruker Corporation.
3. What are the main segments of the Proteomics Market?
The market segments include Product & Services, Application.
4. Can you provide details about the market size?
The market size is estimated to be USD 27.60 Million as of 2022.
5. What are some drivers contributing to market growth?
Rising Demand for Personalized Medicine; Increasing R&D Expenditure and Government Funding for Proteomics; Technological Advancements.
6. What are the notable trends driving market growth?
Drug Discovery is Expected to Witness Healthy CAGR in Future.
7. Are there any restraints impacting market growth?
High Cost of Instruments.
8. Can you provide examples of recent developments in the market?
N/A
9. What pricing options are available for accessing the report?
Pricing options include single-user, multi-user, and enterprise licenses priced at USD 4750, USD 5250, and USD 8750 respectively.
10. Is the market size provided in terms of value or volume?
The market size is provided in terms of value, measured in Million and volume, measured in K Unit.
11. Are there any specific market keywords associated with the report?
Yes, the market keyword associated with the report is "Proteomics Market," which aids in identifying and referencing the specific market segment covered.
12. How do I determine which pricing option suits my needs best?
The pricing options vary based on user requirements and access needs. Individual users may opt for single-user licenses, while businesses requiring broader access may choose multi-user or enterprise licenses for cost-effective access to the report.
13. Are there any additional resources or data provided in the Proteomics Market report?
While the report offers comprehensive insights, it's advisable to review the specific contents or supplementary materials provided to ascertain if additional resources or data are available.
14. How can I stay updated on further developments or reports in the Proteomics Market?
To stay informed about further developments, trends, and reports in the Proteomics Market, consider subscribing to industry newsletters, following relevant companies and organizations, or regularly checking reputable industry news sources and publications.
Methodology
Step 1 - Identification of Relevant Samples Size from Population Database


Step 2 - Approaches for Defining Global Market Size (Value, Volume* & Price*)

Note*: In applicable scenarios
Step 3 - Data Sources
Primary Research
- Web Analytics
- Survey Reports
- Research Institute
- Latest Research Reports
- Opinion Leaders
Secondary Research
- Annual Reports
- White Paper
- Latest Press Release
- Industry Association
- Paid Database
- Investor Presentations

Step 4 - Data Triangulation
Involves using different sources of information in order to increase the validity of a study
These sources are likely to be stakeholders in a program - participants, other researchers, program staff, other community members, and so on.
Then we put all data in single framework & apply various statistical tools to find out the dynamic on the market.
During the analysis stage, feedback from the stakeholder groups would be compared to determine areas of agreement as well as areas of divergence


