
Key Insights
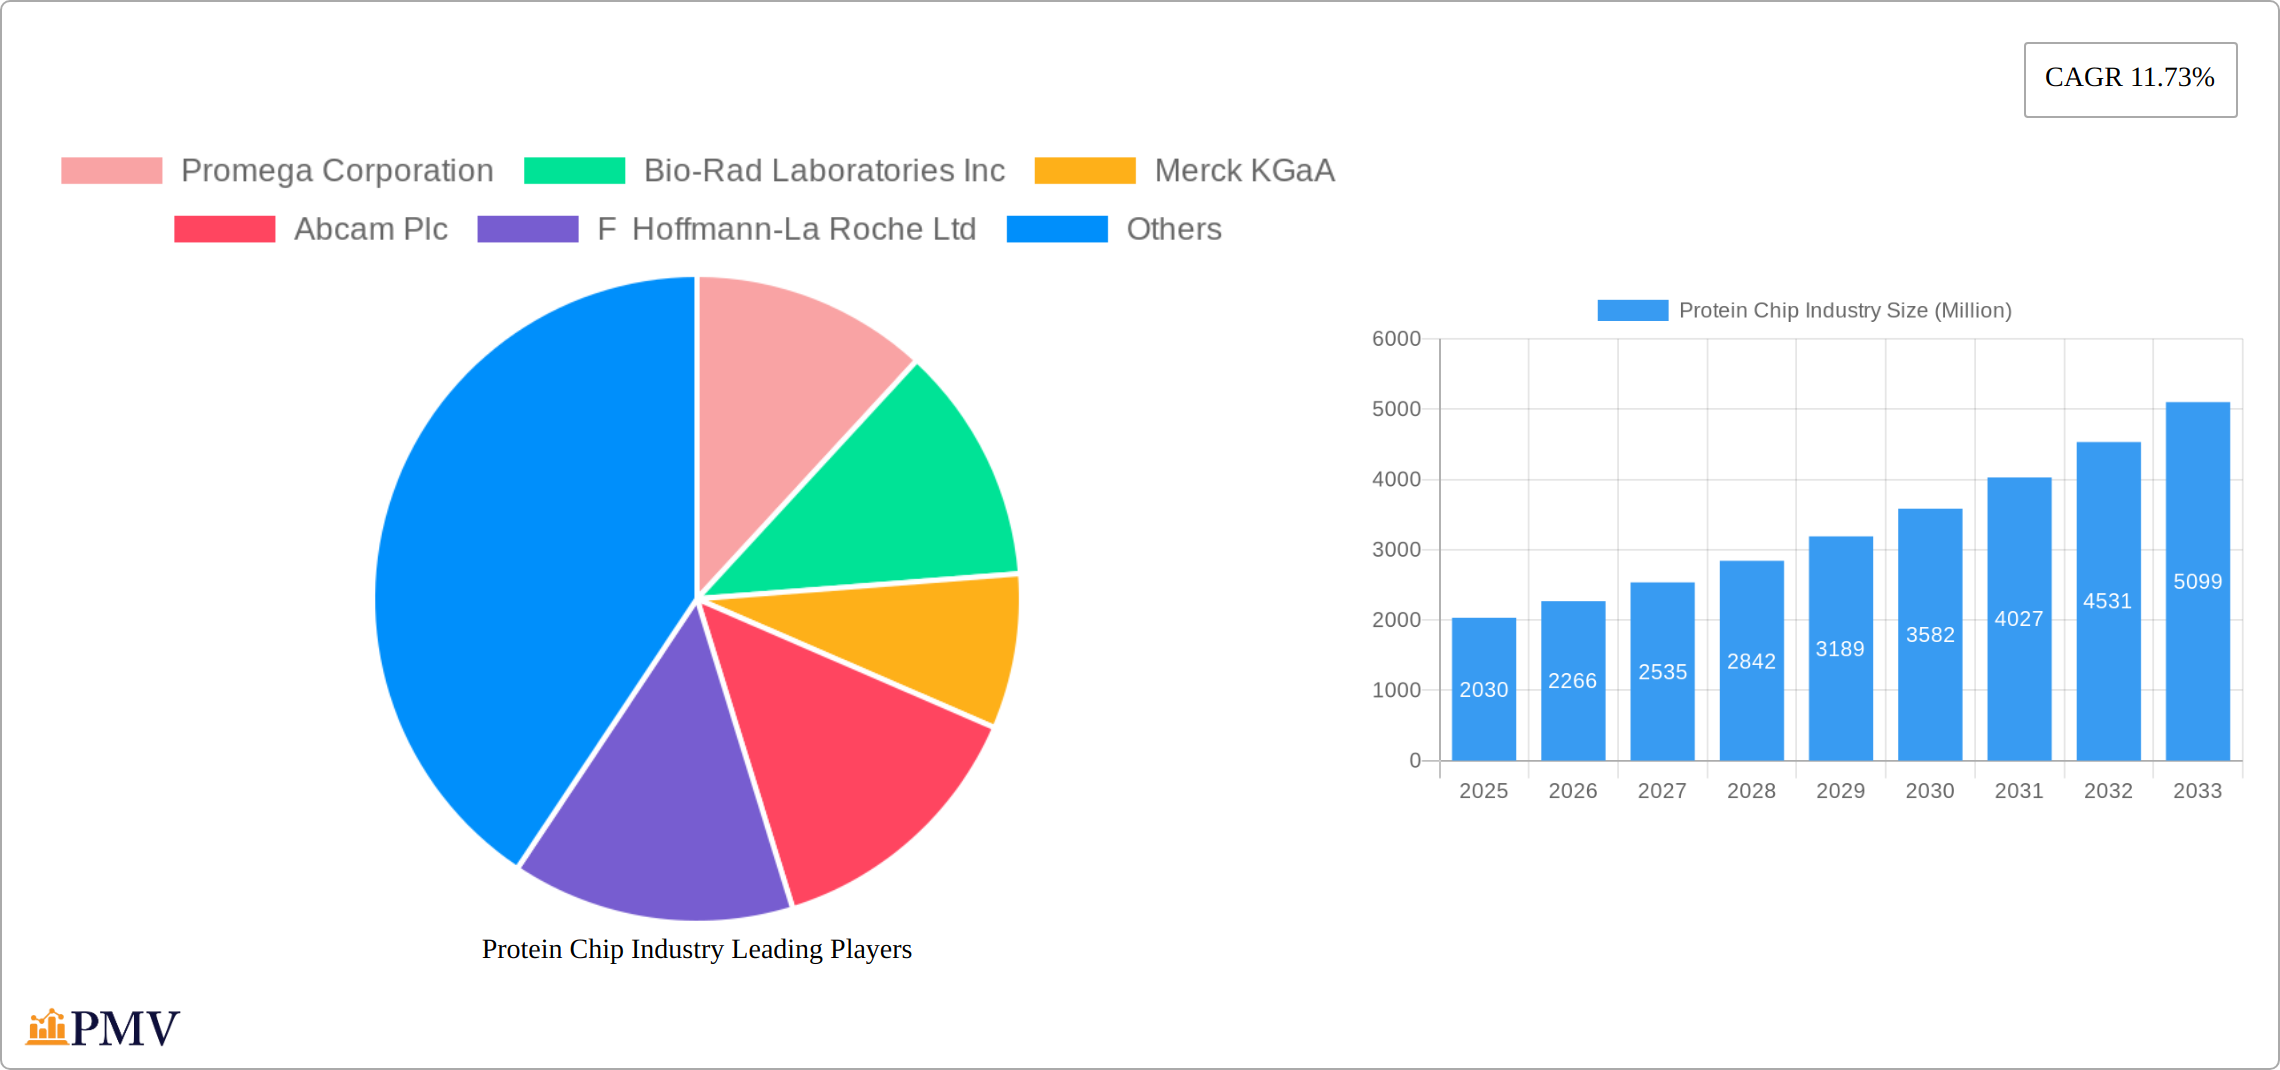
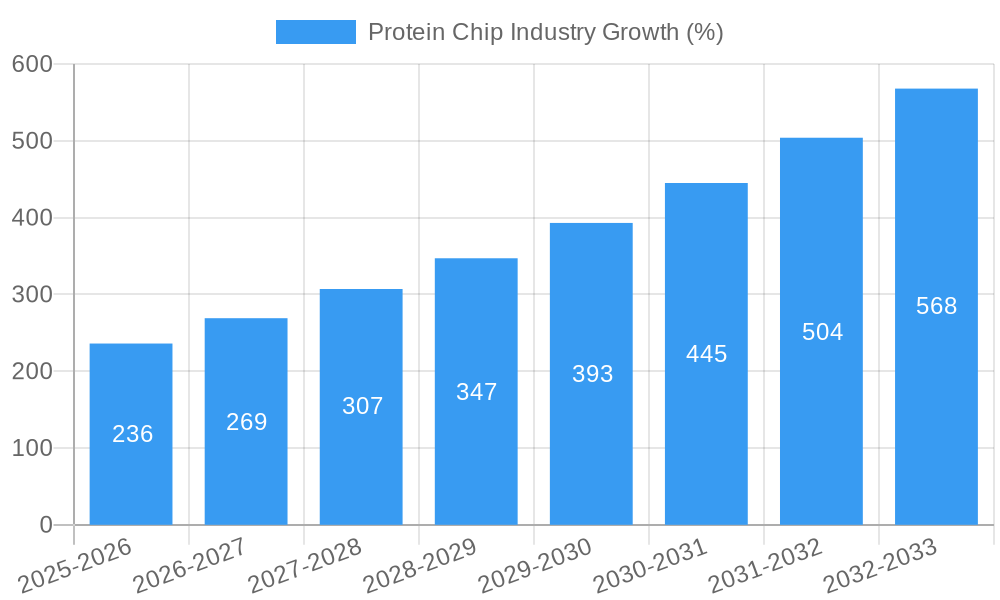
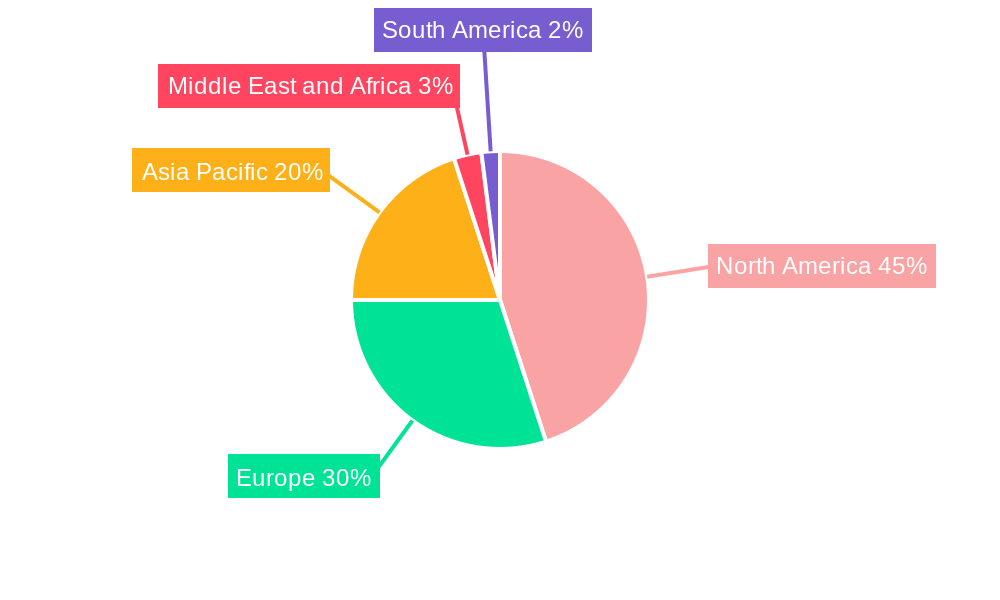
The global protein chip market, valued at $2.03 billion in 2025, is projected to experience robust growth, driven by the increasing prevalence of chronic diseases necessitating advanced diagnostic tools and the rising demand for high-throughput screening in drug discovery and development. The market's Compound Annual Growth Rate (CAGR) of 11.73% from 2025 to 2033 indicates significant expansion, fueled by technological advancements leading to improved sensitivity, specificity, and miniaturization of protein chips. Key market segments include kits, reagents, instruments, and accessories, with kits representing a significant portion due to their ease of use and cost-effectiveness for various applications. Drug discovery and development constitutes a major application area, followed by disease diagnosis, particularly in oncology and infectious diseases. Pharmaceutical and biotechnology industries are the primary end-users, contributing substantially to market revenue. The North American market currently holds a significant share, driven by robust R&D investment and the presence of major market players. However, the Asia-Pacific region is anticipated to demonstrate the fastest growth rate, fueled by increasing healthcare expenditure and expanding research infrastructure in countries like China and India. Competitive forces within the market are shaped by the presence of established players like Thermo Fisher Scientific, Danaher Corporation, and Bio-Rad Laboratories, alongside emerging companies focusing on innovative technologies. The market faces challenges such as high initial investment costs for equipment and the need for specialized expertise to interpret results. However, ongoing research and development efforts focused on improving cost-effectiveness and user-friendliness are expected to mitigate these challenges.
The continued expansion of the protein chip market will be significantly impacted by government initiatives promoting personalized medicine and advancements in proteomics research. Furthermore, collaborations between academic institutions and industry players will likely accelerate innovation and the development of novel applications for protein chips. The integration of artificial intelligence and machine learning in data analysis associated with protein chip technology holds immense potential to further enhance diagnostic capabilities and drug discovery processes. This will ultimately contribute to more efficient and effective healthcare solutions across various disease areas, leading to sustained market growth over the forecast period.
Protein Chip Industry Market Report: 2019-2033
This comprehensive report provides an in-depth analysis of the global Protein Chip industry, offering valuable insights for stakeholders across the value chain. Covering the period from 2019 to 2033, with 2025 as the base year and forecast period from 2025-2033, this report meticulously examines market size, growth drivers, challenges, and competitive dynamics. The study period (2019-2024) provides a historical perspective, complemented by a robust forecast to 2033. The estimated market size in 2025 is projected to be xx Million.
Protein Chip Industry Market Structure & Competitive Dynamics
The protein chip market exhibits a moderately concentrated structure, with several key players holding significant market share. The industry is characterized by intense competition, driven by continuous innovation and the development of advanced technologies. Regulatory frameworks, particularly those related to diagnostic applications, significantly impact market growth. Product substitutes, such as ELISA and other immunoassay techniques, pose a competitive threat. End-user trends, particularly the increasing adoption of protein chips in drug discovery and personalized medicine, are shaping market dynamics. Mergers and acquisitions (M&A) play a crucial role in market consolidation and expansion. For example, the xx Million acquisition of Company X by Company Y in 2023 underscored the strategic importance of protein chip technology. Key players such as Promega Corporation, Bio-Rad Laboratories Inc, Merck KGaA, and Thermo Fisher Scientific hold significant market shares, estimated at xx%, xx%, xx%, and xx% respectively in 2025. The average M&A deal value in the past five years has been approximately xx Million. Further M&A activities are anticipated in the coming years, driven by the need for companies to expand their product portfolio and geographic reach. The report thoroughly analyzes these aspects, providing a comprehensive overview of the competitive landscape.
Protein Chip Industry Industry Trends & Insights
The global protein chip market is experiencing robust growth, driven by the increasing demand for high-throughput screening in drug discovery, advancements in proteomics research, and the growing adoption of personalized medicine. The compound annual growth rate (CAGR) is projected to be xx% during the forecast period (2025-2033). Technological advancements, such as the development of more sensitive and specific protein chips, are further fueling market expansion. Increased market penetration within the pharmaceutical and biotechnology industries, hospitals, and clinical settings has been observed. Market penetration is expected to reach xx% by 2033. Consumer preferences are shifting towards more accurate, faster, and cost-effective protein chip technologies. The report details the competitive landscape, encompassing factors like strategic alliances, partnerships, and new product launches that are reshaping market dynamics. The emergence of novel proteomic applications along with the growing adoption of next-generation sequencing technologies is anticipated to significantly drive industry growth.
Dominant Markets & Segments in Protein Chip Industry
The North American region is currently the dominant market for protein chips, accounting for approximately xx% of the global market share in 2025. This dominance is primarily attributed to:
- Strong Research and Development Investments: Significant investments in biomedical research and the presence of numerous pharmaceutical and biotechnology companies drive demand for advanced proteomic technologies.
- Favorable Regulatory Environment: Supportive regulatory frameworks and streamlined approval processes accelerate the adoption of new protein chip technologies.
- Well-Developed Healthcare Infrastructure: The sophisticated healthcare infrastructure allows for effective implementation and utilization of protein chips in clinical settings.
However, the Asia-Pacific region is expected to witness the fastest growth during the forecast period, driven by:
- Rising Healthcare Expenditure: Increased healthcare spending and investments in R&D are boosting the adoption of protein chips.
- Growing Prevalence of Chronic Diseases: The rising incidence of chronic diseases creates a need for improved diagnostic tools and therapeutic solutions.
- Government Initiatives: Several government initiatives aim to improve healthcare infrastructure and access to advanced medical technologies.
Segment Analysis:
- By Product Type: Kits segment holds the largest market share, owing to its ease of use and cost-effectiveness. Reagents and instruments & accessories segments are also exhibiting significant growth.
- By Application: Drug discovery and development accounts for the largest market share, followed by disease diagnosis. Other applications, such as basic research and environmental monitoring, are gaining traction.
- By End User: Pharmaceutical and biotechnology industries dominate the market, followed by hospitals and clinics.
Protein Chip Industry Product Innovations
Recent innovations in protein chip technology focus on improving sensitivity, specificity, and throughput. Miniaturization and integration of advanced detection methods like surface plasmon resonance (SPR) and electrochemical techniques are key trends. These innovations cater to the growing demand for high-throughput screening, early disease diagnosis, and personalized medicine. The enhanced capabilities of these new chips provide improved data quality and speed, offering significant competitive advantages to manufacturers.
Report Segmentation & Scope
This report segments the protein chip market by product type (Kits, Reagents, Instruments and Accessories), application (Drug Discovery and Development, Disease Diagnosis, Other Applications), and end-user (Pharmaceutical and Biotechnology Industries, Hospitals and Clinics, Other End Users). Each segment's market size, growth projections, and competitive landscape are comprehensively analyzed. For instance, the kits segment is expected to maintain strong growth, driven by its ease of use and versatility. The drug discovery and development application segment is anticipated to exhibit significant growth due to the rising demand for high-throughput screening and personalized medicine. The pharmaceutical and biotechnology industries will continue to dominate the end-user segment due to their extensive research and development activities.
Key Drivers of Protein Chip Industry Growth
Several factors are driving the growth of the protein chip industry. Technological advancements, such as the development of highly sensitive and specific protein chips, are key drivers. The growing demand for high-throughput screening in drug discovery and personalized medicine is significantly boosting market growth. Favorable regulatory frameworks in several countries are further accelerating market expansion. Furthermore, increasing investments in proteomics research and the rising prevalence of chronic diseases are fueling industry growth. The increasing availability of funding for research and development and advancements in the bioinformatics field further facilitate the adoption and improvement of protein chip technologies.
Challenges in the Protein Chip Industry Sector
The protein chip industry faces several challenges, including high development costs and the need for specialized expertise for operation. Stringent regulatory requirements and validation processes can slow down market entry for new products. Supply chain disruptions, particularly those related to crucial reagents and components, can impact market stability. Intense competition among established players and new entrants pose significant challenges. Finally, the potential for errors in data interpretation and the need for highly skilled personnel can limit widespread adoption.
Leading Players in the Protein Chip Industry Market
- Promega Corporation (Promega Corporation)
- Bio-Rad Laboratories Inc (Bio-Rad Laboratories Inc)
- Merck KGaA (Merck KGaA)
- Abcam Plc (Abcam Plc)
- F Hoffmann-La Roche Ltd (F Hoffmann-La Roche Ltd)
- Cell Signaling Technology Inc (Cell Signaling Technology Inc)
- Danaher Corporation (Danaher Corporation)
- Qiagen (Qiagen)
- PerkinElmer Inc (PerkinElmer Inc)
- Thermo Fisher Scientific (Thermo Fisher Scientific)
Key Developments in Protein Chip Industry Sector
- March 2022: Biognosys launched an expanded suite of proteomics platforms, providing pharmaceutical and diagnostics customers with deeper biological insights across the entire R&D pipeline. This expansion broadened the company's offerings and strengthened its position in the market.
- January 2022: Amgen partnered with Generate Biomedicines, investing USD 1.9 Billion+ to discover and create protein therapeutics. This significant investment underscores the growing importance of protein-based therapeutics and the potential of protein chips in their development.
Strategic Protein Chip Industry Market Outlook
The protein chip industry is poised for significant growth, driven by technological advancements, increasing demand from various sectors, and favorable regulatory landscapes. Strategic opportunities lie in developing innovative protein chip technologies, expanding into new applications, and forging strategic partnerships to broaden market reach. The industry's future growth hinges on addressing technological challenges, streamlining regulatory pathways, and fostering collaboration across research and development. The integration of AI and machine learning will further optimize data analysis and enhance the efficiency of protein chip technology. The forecast period promises remarkable opportunities for innovation and expansion within the industry.
Protein Chip Industry Segmentation
-
1. Product Type
- 1.1. Kits
- 1.2. Reagents
- 1.3. Instruments and Accessories
-
2. Application
- 2.1. Drug Discovery and Development
- 2.2. Disease Diagnosis
- 2.3. Other Applications
-
3. End User
- 3.1. Pharmaceutical and Biotechnology Industries
- 3.2. Hospitals and Clinics
- 3.3. Other End Users
Protein Chip Industry Segmentation By Geography
-
1. North America
- 1.1. United States
- 1.2. Canada
- 1.3. Mexico
-
2. Europe
- 2.1. Germany
- 2.2. United Kingdom
- 2.3. France
- 2.4. Italy
- 2.5. Spain
- 2.6. Rest of Europe
-
3. Asia Pacific
- 3.1. China
- 3.2. Japan
- 3.3. India
- 3.4. Australia
- 3.5. South Korea
- 3.6. Rest of Asia Pacific
-
4. Middle East and Africa
- 4.1. GCC
- 4.2. South Africa
- 4.3. Rest of Middle East and Africa
-
5. South America
- 5.1. Brazil
- 5.2. Argentina
- 5.3. Rest of South America
Protein Chip Industry REPORT HIGHLIGHTS
| Aspects | Details |
|---|---|
| Study Period | 2019-2033 |
| Base Year | 2024 |
| Estimated Year | 2025 |
| Forecast Period | 2025-2033 |
| Historical Period | 2019-2024 |
| Growth Rate | CAGR of 11.73% from 2019-2033 |
| Segmentation |
|
Table of Contents
- 1. Introduction
- 1.1. Research Scope
- 1.2. Market Segmentation
- 1.3. Research Methodology
- 1.4. Definitions and Assumptions
- 2. Executive Summary
- 2.1. Introduction
- 3. Market Dynamics
- 3.1. Introduction
- 3.2. Market Drivers
- 3.2.1. Increasing Incidence of Chronic and Infectious Diseases; Technological Advancements in Protein Assay Techniques; Increasing Expenditure on Pharmaceutical and Biological Research and Development
- 3.3. Market Restrains
- 3.3.1. High Cost of Multiplex Assay Equipment
- 3.4. Market Trends
- 3.4.1. Drug Discovery and Development Segment is Expected to Hold a Significant Share in the Protein Assay Market during the Forecast Period of the Study
- 4. Market Factor Analysis
- 4.1. Porters Five Forces
- 4.2. Supply/Value Chain
- 4.3. PESTEL analysis
- 4.4. Market Entropy
- 4.5. Patent/Trademark Analysis
- 5. Global Protein Chip Industry Analysis, Insights and Forecast, 2019-2031
- 5.1. Market Analysis, Insights and Forecast - by Product Type
- 5.1.1. Kits
- 5.1.2. Reagents
- 5.1.3. Instruments and Accessories
- 5.2. Market Analysis, Insights and Forecast - by Application
- 5.2.1. Drug Discovery and Development
- 5.2.2. Disease Diagnosis
- 5.2.3. Other Applications
- 5.3. Market Analysis, Insights and Forecast - by End User
- 5.3.1. Pharmaceutical and Biotechnology Industries
- 5.3.2. Hospitals and Clinics
- 5.3.3. Other End Users
- 5.4. Market Analysis, Insights and Forecast - by Region
- 5.4.1. North America
- 5.4.2. Europe
- 5.4.3. Asia Pacific
- 5.4.4. Middle East and Africa
- 5.4.5. South America
- 5.1. Market Analysis, Insights and Forecast - by Product Type
- 6. North America Protein Chip Industry Analysis, Insights and Forecast, 2019-2031
- 6.1. Market Analysis, Insights and Forecast - by Product Type
- 6.1.1. Kits
- 6.1.2. Reagents
- 6.1.3. Instruments and Accessories
- 6.2. Market Analysis, Insights and Forecast - by Application
- 6.2.1. Drug Discovery and Development
- 6.2.2. Disease Diagnosis
- 6.2.3. Other Applications
- 6.3. Market Analysis, Insights and Forecast - by End User
- 6.3.1. Pharmaceutical and Biotechnology Industries
- 6.3.2. Hospitals and Clinics
- 6.3.3. Other End Users
- 6.1. Market Analysis, Insights and Forecast - by Product Type
- 7. Europe Protein Chip Industry Analysis, Insights and Forecast, 2019-2031
- 7.1. Market Analysis, Insights and Forecast - by Product Type
- 7.1.1. Kits
- 7.1.2. Reagents
- 7.1.3. Instruments and Accessories
- 7.2. Market Analysis, Insights and Forecast - by Application
- 7.2.1. Drug Discovery and Development
- 7.2.2. Disease Diagnosis
- 7.2.3. Other Applications
- 7.3. Market Analysis, Insights and Forecast - by End User
- 7.3.1. Pharmaceutical and Biotechnology Industries
- 7.3.2. Hospitals and Clinics
- 7.3.3. Other End Users
- 7.1. Market Analysis, Insights and Forecast - by Product Type
- 8. Asia Pacific Protein Chip Industry Analysis, Insights and Forecast, 2019-2031
- 8.1. Market Analysis, Insights and Forecast - by Product Type
- 8.1.1. Kits
- 8.1.2. Reagents
- 8.1.3. Instruments and Accessories
- 8.2. Market Analysis, Insights and Forecast - by Application
- 8.2.1. Drug Discovery and Development
- 8.2.2. Disease Diagnosis
- 8.2.3. Other Applications
- 8.3. Market Analysis, Insights and Forecast - by End User
- 8.3.1. Pharmaceutical and Biotechnology Industries
- 8.3.2. Hospitals and Clinics
- 8.3.3. Other End Users
- 8.1. Market Analysis, Insights and Forecast - by Product Type
- 9. Middle East and Africa Protein Chip Industry Analysis, Insights and Forecast, 2019-2031
- 9.1. Market Analysis, Insights and Forecast - by Product Type
- 9.1.1. Kits
- 9.1.2. Reagents
- 9.1.3. Instruments and Accessories
- 9.2. Market Analysis, Insights and Forecast - by Application
- 9.2.1. Drug Discovery and Development
- 9.2.2. Disease Diagnosis
- 9.2.3. Other Applications
- 9.3. Market Analysis, Insights and Forecast - by End User
- 9.3.1. Pharmaceutical and Biotechnology Industries
- 9.3.2. Hospitals and Clinics
- 9.3.3. Other End Users
- 9.1. Market Analysis, Insights and Forecast - by Product Type
- 10. South America Protein Chip Industry Analysis, Insights and Forecast, 2019-2031
- 10.1. Market Analysis, Insights and Forecast - by Product Type
- 10.1.1. Kits
- 10.1.2. Reagents
- 10.1.3. Instruments and Accessories
- 10.2. Market Analysis, Insights and Forecast - by Application
- 10.2.1. Drug Discovery and Development
- 10.2.2. Disease Diagnosis
- 10.2.3. Other Applications
- 10.3. Market Analysis, Insights and Forecast - by End User
- 10.3.1. Pharmaceutical and Biotechnology Industries
- 10.3.2. Hospitals and Clinics
- 10.3.3. Other End Users
- 10.1. Market Analysis, Insights and Forecast - by Product Type
- 11. North America Protein Chip Industry Analysis, Insights and Forecast, 2019-2031
- 11.1. Market Analysis, Insights and Forecast - By Country/Sub-region
- 11.1.1 United States
- 11.1.2 Canada
- 11.1.3 Mexico
- 12. Europe Protein Chip Industry Analysis, Insights and Forecast, 2019-2031
- 12.1. Market Analysis, Insights and Forecast - By Country/Sub-region
- 12.1.1 Germany
- 12.1.2 United Kingdom
- 12.1.3 France
- 12.1.4 Italy
- 12.1.5 Spain
- 12.1.6 Rest of Europe
- 13. Asia Pacific Protein Chip Industry Analysis, Insights and Forecast, 2019-2031
- 13.1. Market Analysis, Insights and Forecast - By Country/Sub-region
- 13.1.1 China
- 13.1.2 Japan
- 13.1.3 India
- 13.1.4 Australia
- 13.1.5 South Korea
- 13.1.6 Rest of Asia Pacific
- 14. Middle East and Africa Protein Chip Industry Analysis, Insights and Forecast, 2019-2031
- 14.1. Market Analysis, Insights and Forecast - By Country/Sub-region
- 14.1.1 GCC
- 14.1.2 South Africa
- 14.1.3 Rest of Middle East and Africa
- 15. South America Protein Chip Industry Analysis, Insights and Forecast, 2019-2031
- 15.1. Market Analysis, Insights and Forecast - By Country/Sub-region
- 15.1.1 Brazil
- 15.1.2 Argentina
- 15.1.3 Rest of South America
- 16. Competitive Analysis
- 16.1. Global Market Share Analysis 2024
- 16.2. Company Profiles
- 16.2.1 Promega Corporation
- 16.2.1.1. Overview
- 16.2.1.2. Products
- 16.2.1.3. SWOT Analysis
- 16.2.1.4. Recent Developments
- 16.2.1.5. Financials (Based on Availability)
- 16.2.2 Bio-Rad Laboratories Inc
- 16.2.2.1. Overview
- 16.2.2.2. Products
- 16.2.2.3. SWOT Analysis
- 16.2.2.4. Recent Developments
- 16.2.2.5. Financials (Based on Availability)
- 16.2.3 Merck KGaA
- 16.2.3.1. Overview
- 16.2.3.2. Products
- 16.2.3.3. SWOT Analysis
- 16.2.3.4. Recent Developments
- 16.2.3.5. Financials (Based on Availability)
- 16.2.4 Abcam Plc
- 16.2.4.1. Overview
- 16.2.4.2. Products
- 16.2.4.3. SWOT Analysis
- 16.2.4.4. Recent Developments
- 16.2.4.5. Financials (Based on Availability)
- 16.2.5 F Hoffmann-La Roche Ltd
- 16.2.5.1. Overview
- 16.2.5.2. Products
- 16.2.5.3. SWOT Analysis
- 16.2.5.4. Recent Developments
- 16.2.5.5. Financials (Based on Availability)
- 16.2.6 Cell Signaling Technology Inc
- 16.2.6.1. Overview
- 16.2.6.2. Products
- 16.2.6.3. SWOT Analysis
- 16.2.6.4. Recent Developments
- 16.2.6.5. Financials (Based on Availability)
- 16.2.7 Danaher Corporation
- 16.2.7.1. Overview
- 16.2.7.2. Products
- 16.2.7.3. SWOT Analysis
- 16.2.7.4. Recent Developments
- 16.2.7.5. Financials (Based on Availability)
- 16.2.8 Qiagen
- 16.2.8.1. Overview
- 16.2.8.2. Products
- 16.2.8.3. SWOT Analysis
- 16.2.8.4. Recent Developments
- 16.2.8.5. Financials (Based on Availability)
- 16.2.9 PerkinElmer Inc
- 16.2.9.1. Overview
- 16.2.9.2. Products
- 16.2.9.3. SWOT Analysis
- 16.2.9.4. Recent Developments
- 16.2.9.5. Financials (Based on Availability)
- 16.2.10 Thermo Fisher Scientific
- 16.2.10.1. Overview
- 16.2.10.2. Products
- 16.2.10.3. SWOT Analysis
- 16.2.10.4. Recent Developments
- 16.2.10.5. Financials (Based on Availability)
- 16.2.1 Promega Corporation
List of Figures
- Figure 1: Global Protein Chip Industry Revenue Breakdown (Million, %) by Region 2024 & 2032
- Figure 2: Global Protein Chip Industry Volume Breakdown (K Unit, %) by Region 2024 & 2032
- Figure 3: North America Protein Chip Industry Revenue (Million), by Country 2024 & 2032
- Figure 4: North America Protein Chip Industry Volume (K Unit), by Country 2024 & 2032
- Figure 5: North America Protein Chip Industry Revenue Share (%), by Country 2024 & 2032
- Figure 6: North America Protein Chip Industry Volume Share (%), by Country 2024 & 2032
- Figure 7: Europe Protein Chip Industry Revenue (Million), by Country 2024 & 2032
- Figure 8: Europe Protein Chip Industry Volume (K Unit), by Country 2024 & 2032
- Figure 9: Europe Protein Chip Industry Revenue Share (%), by Country 2024 & 2032
- Figure 10: Europe Protein Chip Industry Volume Share (%), by Country 2024 & 2032
- Figure 11: Asia Pacific Protein Chip Industry Revenue (Million), by Country 2024 & 2032
- Figure 12: Asia Pacific Protein Chip Industry Volume (K Unit), by Country 2024 & 2032
- Figure 13: Asia Pacific Protein Chip Industry Revenue Share (%), by Country 2024 & 2032
- Figure 14: Asia Pacific Protein Chip Industry Volume Share (%), by Country 2024 & 2032
- Figure 15: Middle East and Africa Protein Chip Industry Revenue (Million), by Country 2024 & 2032
- Figure 16: Middle East and Africa Protein Chip Industry Volume (K Unit), by Country 2024 & 2032
- Figure 17: Middle East and Africa Protein Chip Industry Revenue Share (%), by Country 2024 & 2032
- Figure 18: Middle East and Africa Protein Chip Industry Volume Share (%), by Country 2024 & 2032
- Figure 19: South America Protein Chip Industry Revenue (Million), by Country 2024 & 2032
- Figure 20: South America Protein Chip Industry Volume (K Unit), by Country 2024 & 2032
- Figure 21: South America Protein Chip Industry Revenue Share (%), by Country 2024 & 2032
- Figure 22: South America Protein Chip Industry Volume Share (%), by Country 2024 & 2032
- Figure 23: North America Protein Chip Industry Revenue (Million), by Product Type 2024 & 2032
- Figure 24: North America Protein Chip Industry Volume (K Unit), by Product Type 2024 & 2032
- Figure 25: North America Protein Chip Industry Revenue Share (%), by Product Type 2024 & 2032
- Figure 26: North America Protein Chip Industry Volume Share (%), by Product Type 2024 & 2032
- Figure 27: North America Protein Chip Industry Revenue (Million), by Application 2024 & 2032
- Figure 28: North America Protein Chip Industry Volume (K Unit), by Application 2024 & 2032
- Figure 29: North America Protein Chip Industry Revenue Share (%), by Application 2024 & 2032
- Figure 30: North America Protein Chip Industry Volume Share (%), by Application 2024 & 2032
- Figure 31: North America Protein Chip Industry Revenue (Million), by End User 2024 & 2032
- Figure 32: North America Protein Chip Industry Volume (K Unit), by End User 2024 & 2032
- Figure 33: North America Protein Chip Industry Revenue Share (%), by End User 2024 & 2032
- Figure 34: North America Protein Chip Industry Volume Share (%), by End User 2024 & 2032
- Figure 35: North America Protein Chip Industry Revenue (Million), by Country 2024 & 2032
- Figure 36: North America Protein Chip Industry Volume (K Unit), by Country 2024 & 2032
- Figure 37: North America Protein Chip Industry Revenue Share (%), by Country 2024 & 2032
- Figure 38: North America Protein Chip Industry Volume Share (%), by Country 2024 & 2032
- Figure 39: Europe Protein Chip Industry Revenue (Million), by Product Type 2024 & 2032
- Figure 40: Europe Protein Chip Industry Volume (K Unit), by Product Type 2024 & 2032
- Figure 41: Europe Protein Chip Industry Revenue Share (%), by Product Type 2024 & 2032
- Figure 42: Europe Protein Chip Industry Volume Share (%), by Product Type 2024 & 2032
- Figure 43: Europe Protein Chip Industry Revenue (Million), by Application 2024 & 2032
- Figure 44: Europe Protein Chip Industry Volume (K Unit), by Application 2024 & 2032
- Figure 45: Europe Protein Chip Industry Revenue Share (%), by Application 2024 & 2032
- Figure 46: Europe Protein Chip Industry Volume Share (%), by Application 2024 & 2032
- Figure 47: Europe Protein Chip Industry Revenue (Million), by End User 2024 & 2032
- Figure 48: Europe Protein Chip Industry Volume (K Unit), by End User 2024 & 2032
- Figure 49: Europe Protein Chip Industry Revenue Share (%), by End User 2024 & 2032
- Figure 50: Europe Protein Chip Industry Volume Share (%), by End User 2024 & 2032
- Figure 51: Europe Protein Chip Industry Revenue (Million), by Country 2024 & 2032
- Figure 52: Europe Protein Chip Industry Volume (K Unit), by Country 2024 & 2032
- Figure 53: Europe Protein Chip Industry Revenue Share (%), by Country 2024 & 2032
- Figure 54: Europe Protein Chip Industry Volume Share (%), by Country 2024 & 2032
- Figure 55: Asia Pacific Protein Chip Industry Revenue (Million), by Product Type 2024 & 2032
- Figure 56: Asia Pacific Protein Chip Industry Volume (K Unit), by Product Type 2024 & 2032
- Figure 57: Asia Pacific Protein Chip Industry Revenue Share (%), by Product Type 2024 & 2032
- Figure 58: Asia Pacific Protein Chip Industry Volume Share (%), by Product Type 2024 & 2032
- Figure 59: Asia Pacific Protein Chip Industry Revenue (Million), by Application 2024 & 2032
- Figure 60: Asia Pacific Protein Chip Industry Volume (K Unit), by Application 2024 & 2032
- Figure 61: Asia Pacific Protein Chip Industry Revenue Share (%), by Application 2024 & 2032
- Figure 62: Asia Pacific Protein Chip Industry Volume Share (%), by Application 2024 & 2032
- Figure 63: Asia Pacific Protein Chip Industry Revenue (Million), by End User 2024 & 2032
- Figure 64: Asia Pacific Protein Chip Industry Volume (K Unit), by End User 2024 & 2032
- Figure 65: Asia Pacific Protein Chip Industry Revenue Share (%), by End User 2024 & 2032
- Figure 66: Asia Pacific Protein Chip Industry Volume Share (%), by End User 2024 & 2032
- Figure 67: Asia Pacific Protein Chip Industry Revenue (Million), by Country 2024 & 2032
- Figure 68: Asia Pacific Protein Chip Industry Volume (K Unit), by Country 2024 & 2032
- Figure 69: Asia Pacific Protein Chip Industry Revenue Share (%), by Country 2024 & 2032
- Figure 70: Asia Pacific Protein Chip Industry Volume Share (%), by Country 2024 & 2032
- Figure 71: Middle East and Africa Protein Chip Industry Revenue (Million), by Product Type 2024 & 2032
- Figure 72: Middle East and Africa Protein Chip Industry Volume (K Unit), by Product Type 2024 & 2032
- Figure 73: Middle East and Africa Protein Chip Industry Revenue Share (%), by Product Type 2024 & 2032
- Figure 74: Middle East and Africa Protein Chip Industry Volume Share (%), by Product Type 2024 & 2032
- Figure 75: Middle East and Africa Protein Chip Industry Revenue (Million), by Application 2024 & 2032
- Figure 76: Middle East and Africa Protein Chip Industry Volume (K Unit), by Application 2024 & 2032
- Figure 77: Middle East and Africa Protein Chip Industry Revenue Share (%), by Application 2024 & 2032
- Figure 78: Middle East and Africa Protein Chip Industry Volume Share (%), by Application 2024 & 2032
- Figure 79: Middle East and Africa Protein Chip Industry Revenue (Million), by End User 2024 & 2032
- Figure 80: Middle East and Africa Protein Chip Industry Volume (K Unit), by End User 2024 & 2032
- Figure 81: Middle East and Africa Protein Chip Industry Revenue Share (%), by End User 2024 & 2032
- Figure 82: Middle East and Africa Protein Chip Industry Volume Share (%), by End User 2024 & 2032
- Figure 83: Middle East and Africa Protein Chip Industry Revenue (Million), by Country 2024 & 2032
- Figure 84: Middle East and Africa Protein Chip Industry Volume (K Unit), by Country 2024 & 2032
- Figure 85: Middle East and Africa Protein Chip Industry Revenue Share (%), by Country 2024 & 2032
- Figure 86: Middle East and Africa Protein Chip Industry Volume Share (%), by Country 2024 & 2032
- Figure 87: South America Protein Chip Industry Revenue (Million), by Product Type 2024 & 2032
- Figure 88: South America Protein Chip Industry Volume (K Unit), by Product Type 2024 & 2032
- Figure 89: South America Protein Chip Industry Revenue Share (%), by Product Type 2024 & 2032
- Figure 90: South America Protein Chip Industry Volume Share (%), by Product Type 2024 & 2032
- Figure 91: South America Protein Chip Industry Revenue (Million), by Application 2024 & 2032
- Figure 92: South America Protein Chip Industry Volume (K Unit), by Application 2024 & 2032
- Figure 93: South America Protein Chip Industry Revenue Share (%), by Application 2024 & 2032
- Figure 94: South America Protein Chip Industry Volume Share (%), by Application 2024 & 2032
- Figure 95: South America Protein Chip Industry Revenue (Million), by End User 2024 & 2032
- Figure 96: South America Protein Chip Industry Volume (K Unit), by End User 2024 & 2032
- Figure 97: South America Protein Chip Industry Revenue Share (%), by End User 2024 & 2032
- Figure 98: South America Protein Chip Industry Volume Share (%), by End User 2024 & 2032
- Figure 99: South America Protein Chip Industry Revenue (Million), by Country 2024 & 2032
- Figure 100: South America Protein Chip Industry Volume (K Unit), by Country 2024 & 2032
- Figure 101: South America Protein Chip Industry Revenue Share (%), by Country 2024 & 2032
- Figure 102: South America Protein Chip Industry Volume Share (%), by Country 2024 & 2032
List of Tables
- Table 1: Global Protein Chip Industry Revenue Million Forecast, by Region 2019 & 2032
- Table 2: Global Protein Chip Industry Volume K Unit Forecast, by Region 2019 & 2032
- Table 3: Global Protein Chip Industry Revenue Million Forecast, by Product Type 2019 & 2032
- Table 4: Global Protein Chip Industry Volume K Unit Forecast, by Product Type 2019 & 2032
- Table 5: Global Protein Chip Industry Revenue Million Forecast, by Application 2019 & 2032
- Table 6: Global Protein Chip Industry Volume K Unit Forecast, by Application 2019 & 2032
- Table 7: Global Protein Chip Industry Revenue Million Forecast, by End User 2019 & 2032
- Table 8: Global Protein Chip Industry Volume K Unit Forecast, by End User 2019 & 2032
- Table 9: Global Protein Chip Industry Revenue Million Forecast, by Region 2019 & 2032
- Table 10: Global Protein Chip Industry Volume K Unit Forecast, by Region 2019 & 2032
- Table 11: Global Protein Chip Industry Revenue Million Forecast, by Country 2019 & 2032
- Table 12: Global Protein Chip Industry Volume K Unit Forecast, by Country 2019 & 2032
- Table 13: United States Protein Chip Industry Revenue (Million) Forecast, by Application 2019 & 2032
- Table 14: United States Protein Chip Industry Volume (K Unit) Forecast, by Application 2019 & 2032
- Table 15: Canada Protein Chip Industry Revenue (Million) Forecast, by Application 2019 & 2032
- Table 16: Canada Protein Chip Industry Volume (K Unit) Forecast, by Application 2019 & 2032
- Table 17: Mexico Protein Chip Industry Revenue (Million) Forecast, by Application 2019 & 2032
- Table 18: Mexico Protein Chip Industry Volume (K Unit) Forecast, by Application 2019 & 2032
- Table 19: Global Protein Chip Industry Revenue Million Forecast, by Country 2019 & 2032
- Table 20: Global Protein Chip Industry Volume K Unit Forecast, by Country 2019 & 2032
- Table 21: Germany Protein Chip Industry Revenue (Million) Forecast, by Application 2019 & 2032
- Table 22: Germany Protein Chip Industry Volume (K Unit) Forecast, by Application 2019 & 2032
- Table 23: United Kingdom Protein Chip Industry Revenue (Million) Forecast, by Application 2019 & 2032
- Table 24: United Kingdom Protein Chip Industry Volume (K Unit) Forecast, by Application 2019 & 2032
- Table 25: France Protein Chip Industry Revenue (Million) Forecast, by Application 2019 & 2032
- Table 26: France Protein Chip Industry Volume (K Unit) Forecast, by Application 2019 & 2032
- Table 27: Italy Protein Chip Industry Revenue (Million) Forecast, by Application 2019 & 2032
- Table 28: Italy Protein Chip Industry Volume (K Unit) Forecast, by Application 2019 & 2032
- Table 29: Spain Protein Chip Industry Revenue (Million) Forecast, by Application 2019 & 2032
- Table 30: Spain Protein Chip Industry Volume (K Unit) Forecast, by Application 2019 & 2032
- Table 31: Rest of Europe Protein Chip Industry Revenue (Million) Forecast, by Application 2019 & 2032
- Table 32: Rest of Europe Protein Chip Industry Volume (K Unit) Forecast, by Application 2019 & 2032
- Table 33: Global Protein Chip Industry Revenue Million Forecast, by Country 2019 & 2032
- Table 34: Global Protein Chip Industry Volume K Unit Forecast, by Country 2019 & 2032
- Table 35: China Protein Chip Industry Revenue (Million) Forecast, by Application 2019 & 2032
- Table 36: China Protein Chip Industry Volume (K Unit) Forecast, by Application 2019 & 2032
- Table 37: Japan Protein Chip Industry Revenue (Million) Forecast, by Application 2019 & 2032
- Table 38: Japan Protein Chip Industry Volume (K Unit) Forecast, by Application 2019 & 2032
- Table 39: India Protein Chip Industry Revenue (Million) Forecast, by Application 2019 & 2032
- Table 40: India Protein Chip Industry Volume (K Unit) Forecast, by Application 2019 & 2032
- Table 41: Australia Protein Chip Industry Revenue (Million) Forecast, by Application 2019 & 2032
- Table 42: Australia Protein Chip Industry Volume (K Unit) Forecast, by Application 2019 & 2032
- Table 43: South Korea Protein Chip Industry Revenue (Million) Forecast, by Application 2019 & 2032
- Table 44: South Korea Protein Chip Industry Volume (K Unit) Forecast, by Application 2019 & 2032
- Table 45: Rest of Asia Pacific Protein Chip Industry Revenue (Million) Forecast, by Application 2019 & 2032
- Table 46: Rest of Asia Pacific Protein Chip Industry Volume (K Unit) Forecast, by Application 2019 & 2032
- Table 47: Global Protein Chip Industry Revenue Million Forecast, by Country 2019 & 2032
- Table 48: Global Protein Chip Industry Volume K Unit Forecast, by Country 2019 & 2032
- Table 49: GCC Protein Chip Industry Revenue (Million) Forecast, by Application 2019 & 2032
- Table 50: GCC Protein Chip Industry Volume (K Unit) Forecast, by Application 2019 & 2032
- Table 51: South Africa Protein Chip Industry Revenue (Million) Forecast, by Application 2019 & 2032
- Table 52: South Africa Protein Chip Industry Volume (K Unit) Forecast, by Application 2019 & 2032
- Table 53: Rest of Middle East and Africa Protein Chip Industry Revenue (Million) Forecast, by Application 2019 & 2032
- Table 54: Rest of Middle East and Africa Protein Chip Industry Volume (K Unit) Forecast, by Application 2019 & 2032
- Table 55: Global Protein Chip Industry Revenue Million Forecast, by Country 2019 & 2032
- Table 56: Global Protein Chip Industry Volume K Unit Forecast, by Country 2019 & 2032
- Table 57: Brazil Protein Chip Industry Revenue (Million) Forecast, by Application 2019 & 2032
- Table 58: Brazil Protein Chip Industry Volume (K Unit) Forecast, by Application 2019 & 2032
- Table 59: Argentina Protein Chip Industry Revenue (Million) Forecast, by Application 2019 & 2032
- Table 60: Argentina Protein Chip Industry Volume (K Unit) Forecast, by Application 2019 & 2032
- Table 61: Rest of South America Protein Chip Industry Revenue (Million) Forecast, by Application 2019 & 2032
- Table 62: Rest of South America Protein Chip Industry Volume (K Unit) Forecast, by Application 2019 & 2032
- Table 63: Global Protein Chip Industry Revenue Million Forecast, by Product Type 2019 & 2032
- Table 64: Global Protein Chip Industry Volume K Unit Forecast, by Product Type 2019 & 2032
- Table 65: Global Protein Chip Industry Revenue Million Forecast, by Application 2019 & 2032
- Table 66: Global Protein Chip Industry Volume K Unit Forecast, by Application 2019 & 2032
- Table 67: Global Protein Chip Industry Revenue Million Forecast, by End User 2019 & 2032
- Table 68: Global Protein Chip Industry Volume K Unit Forecast, by End User 2019 & 2032
- Table 69: Global Protein Chip Industry Revenue Million Forecast, by Country 2019 & 2032
- Table 70: Global Protein Chip Industry Volume K Unit Forecast, by Country 2019 & 2032
- Table 71: United States Protein Chip Industry Revenue (Million) Forecast, by Application 2019 & 2032
- Table 72: United States Protein Chip Industry Volume (K Unit) Forecast, by Application 2019 & 2032
- Table 73: Canada Protein Chip Industry Revenue (Million) Forecast, by Application 2019 & 2032
- Table 74: Canada Protein Chip Industry Volume (K Unit) Forecast, by Application 2019 & 2032
- Table 75: Mexico Protein Chip Industry Revenue (Million) Forecast, by Application 2019 & 2032
- Table 76: Mexico Protein Chip Industry Volume (K Unit) Forecast, by Application 2019 & 2032
- Table 77: Global Protein Chip Industry Revenue Million Forecast, by Product Type 2019 & 2032
- Table 78: Global Protein Chip Industry Volume K Unit Forecast, by Product Type 2019 & 2032
- Table 79: Global Protein Chip Industry Revenue Million Forecast, by Application 2019 & 2032
- Table 80: Global Protein Chip Industry Volume K Unit Forecast, by Application 2019 & 2032
- Table 81: Global Protein Chip Industry Revenue Million Forecast, by End User 2019 & 2032
- Table 82: Global Protein Chip Industry Volume K Unit Forecast, by End User 2019 & 2032
- Table 83: Global Protein Chip Industry Revenue Million Forecast, by Country 2019 & 2032
- Table 84: Global Protein Chip Industry Volume K Unit Forecast, by Country 2019 & 2032
- Table 85: Germany Protein Chip Industry Revenue (Million) Forecast, by Application 2019 & 2032
- Table 86: Germany Protein Chip Industry Volume (K Unit) Forecast, by Application 2019 & 2032
- Table 87: United Kingdom Protein Chip Industry Revenue (Million) Forecast, by Application 2019 & 2032
- Table 88: United Kingdom Protein Chip Industry Volume (K Unit) Forecast, by Application 2019 & 2032
- Table 89: France Protein Chip Industry Revenue (Million) Forecast, by Application 2019 & 2032
- Table 90: France Protein Chip Industry Volume (K Unit) Forecast, by Application 2019 & 2032
- Table 91: Italy Protein Chip Industry Revenue (Million) Forecast, by Application 2019 & 2032
- Table 92: Italy Protein Chip Industry Volume (K Unit) Forecast, by Application 2019 & 2032
- Table 93: Spain Protein Chip Industry Revenue (Million) Forecast, by Application 2019 & 2032
- Table 94: Spain Protein Chip Industry Volume (K Unit) Forecast, by Application 2019 & 2032
- Table 95: Rest of Europe Protein Chip Industry Revenue (Million) Forecast, by Application 2019 & 2032
- Table 96: Rest of Europe Protein Chip Industry Volume (K Unit) Forecast, by Application 2019 & 2032
- Table 97: Global Protein Chip Industry Revenue Million Forecast, by Product Type 2019 & 2032
- Table 98: Global Protein Chip Industry Volume K Unit Forecast, by Product Type 2019 & 2032
- Table 99: Global Protein Chip Industry Revenue Million Forecast, by Application 2019 & 2032
- Table 100: Global Protein Chip Industry Volume K Unit Forecast, by Application 2019 & 2032
- Table 101: Global Protein Chip Industry Revenue Million Forecast, by End User 2019 & 2032
- Table 102: Global Protein Chip Industry Volume K Unit Forecast, by End User 2019 & 2032
- Table 103: Global Protein Chip Industry Revenue Million Forecast, by Country 2019 & 2032
- Table 104: Global Protein Chip Industry Volume K Unit Forecast, by Country 2019 & 2032
- Table 105: China Protein Chip Industry Revenue (Million) Forecast, by Application 2019 & 2032
- Table 106: China Protein Chip Industry Volume (K Unit) Forecast, by Application 2019 & 2032
- Table 107: Japan Protein Chip Industry Revenue (Million) Forecast, by Application 2019 & 2032
- Table 108: Japan Protein Chip Industry Volume (K Unit) Forecast, by Application 2019 & 2032
- Table 109: India Protein Chip Industry Revenue (Million) Forecast, by Application 2019 & 2032
- Table 110: India Protein Chip Industry Volume (K Unit) Forecast, by Application 2019 & 2032
- Table 111: Australia Protein Chip Industry Revenue (Million) Forecast, by Application 2019 & 2032
- Table 112: Australia Protein Chip Industry Volume (K Unit) Forecast, by Application 2019 & 2032
- Table 113: South Korea Protein Chip Industry Revenue (Million) Forecast, by Application 2019 & 2032
- Table 114: South Korea Protein Chip Industry Volume (K Unit) Forecast, by Application 2019 & 2032
- Table 115: Rest of Asia Pacific Protein Chip Industry Revenue (Million) Forecast, by Application 2019 & 2032
- Table 116: Rest of Asia Pacific Protein Chip Industry Volume (K Unit) Forecast, by Application 2019 & 2032
- Table 117: Global Protein Chip Industry Revenue Million Forecast, by Product Type 2019 & 2032
- Table 118: Global Protein Chip Industry Volume K Unit Forecast, by Product Type 2019 & 2032
- Table 119: Global Protein Chip Industry Revenue Million Forecast, by Application 2019 & 2032
- Table 120: Global Protein Chip Industry Volume K Unit Forecast, by Application 2019 & 2032
- Table 121: Global Protein Chip Industry Revenue Million Forecast, by End User 2019 & 2032
- Table 122: Global Protein Chip Industry Volume K Unit Forecast, by End User 2019 & 2032
- Table 123: Global Protein Chip Industry Revenue Million Forecast, by Country 2019 & 2032
- Table 124: Global Protein Chip Industry Volume K Unit Forecast, by Country 2019 & 2032
- Table 125: GCC Protein Chip Industry Revenue (Million) Forecast, by Application 2019 & 2032
- Table 126: GCC Protein Chip Industry Volume (K Unit) Forecast, by Application 2019 & 2032
- Table 127: South Africa Protein Chip Industry Revenue (Million) Forecast, by Application 2019 & 2032
- Table 128: South Africa Protein Chip Industry Volume (K Unit) Forecast, by Application 2019 & 2032
- Table 129: Rest of Middle East and Africa Protein Chip Industry Revenue (Million) Forecast, by Application 2019 & 2032
- Table 130: Rest of Middle East and Africa Protein Chip Industry Volume (K Unit) Forecast, by Application 2019 & 2032
- Table 131: Global Protein Chip Industry Revenue Million Forecast, by Product Type 2019 & 2032
- Table 132: Global Protein Chip Industry Volume K Unit Forecast, by Product Type 2019 & 2032
- Table 133: Global Protein Chip Industry Revenue Million Forecast, by Application 2019 & 2032
- Table 134: Global Protein Chip Industry Volume K Unit Forecast, by Application 2019 & 2032
- Table 135: Global Protein Chip Industry Revenue Million Forecast, by End User 2019 & 2032
- Table 136: Global Protein Chip Industry Volume K Unit Forecast, by End User 2019 & 2032
- Table 137: Global Protein Chip Industry Revenue Million Forecast, by Country 2019 & 2032
- Table 138: Global Protein Chip Industry Volume K Unit Forecast, by Country 2019 & 2032
- Table 139: Brazil Protein Chip Industry Revenue (Million) Forecast, by Application 2019 & 2032
- Table 140: Brazil Protein Chip Industry Volume (K Unit) Forecast, by Application 2019 & 2032
- Table 141: Argentina Protein Chip Industry Revenue (Million) Forecast, by Application 2019 & 2032
- Table 142: Argentina Protein Chip Industry Volume (K Unit) Forecast, by Application 2019 & 2032
- Table 143: Rest of South America Protein Chip Industry Revenue (Million) Forecast, by Application 2019 & 2032
- Table 144: Rest of South America Protein Chip Industry Volume (K Unit) Forecast, by Application 2019 & 2032
Frequently Asked Questions
1. What is the projected Compound Annual Growth Rate (CAGR) of the Protein Chip Industry?
The projected CAGR is approximately 11.73%.
2. Which companies are prominent players in the Protein Chip Industry?
Key companies in the market include Promega Corporation, Bio-Rad Laboratories Inc, Merck KGaA, Abcam Plc, F Hoffmann-La Roche Ltd, Cell Signaling Technology Inc, Danaher Corporation, Qiagen, PerkinElmer Inc, Thermo Fisher Scientific.
3. What are the main segments of the Protein Chip Industry?
The market segments include Product Type, Application, End User.
4. Can you provide details about the market size?
The market size is estimated to be USD 2.03 Million as of 2022.
5. What are some drivers contributing to market growth?
Increasing Incidence of Chronic and Infectious Diseases; Technological Advancements in Protein Assay Techniques; Increasing Expenditure on Pharmaceutical and Biological Research and Development.
6. What are the notable trends driving market growth?
Drug Discovery and Development Segment is Expected to Hold a Significant Share in the Protein Assay Market during the Forecast Period of the Study.
7. Are there any restraints impacting market growth?
High Cost of Multiplex Assay Equipment.
8. Can you provide examples of recent developments in the market?
In March 2022, Biognosys launched an expanded suite of proteomics platforms that provide pharmaceutical and diagnostics customers with deep biological insights across the entire R&D pipeline, from early-stage discovery to clinical settings.
9. What pricing options are available for accessing the report?
Pricing options include single-user, multi-user, and enterprise licenses priced at USD 4750, USD 5250, and USD 8750 respectively.
10. Is the market size provided in terms of value or volume?
The market size is provided in terms of value, measured in Million and volume, measured in K Unit.
11. Are there any specific market keywords associated with the report?
Yes, the market keyword associated with the report is "Protein Chip Industry," which aids in identifying and referencing the specific market segment covered.
12. How do I determine which pricing option suits my needs best?
The pricing options vary based on user requirements and access needs. Individual users may opt for single-user licenses, while businesses requiring broader access may choose multi-user or enterprise licenses for cost-effective access to the report.
13. Are there any additional resources or data provided in the Protein Chip Industry report?
While the report offers comprehensive insights, it's advisable to review the specific contents or supplementary materials provided to ascertain if additional resources or data are available.
14. How can I stay updated on further developments or reports in the Protein Chip Industry?
To stay informed about further developments, trends, and reports in the Protein Chip Industry, consider subscribing to industry newsletters, following relevant companies and organizations, or regularly checking reputable industry news sources and publications.
Methodology
Step 1 - Identification of Relevant Samples Size from Population Database


Step 2 - Approaches for Defining Global Market Size (Value, Volume* & Price*)

Note*: In applicable scenarios
Step 3 - Data Sources
Primary Research
- Web Analytics
- Survey Reports
- Research Institute
- Latest Research Reports
- Opinion Leaders
Secondary Research
- Annual Reports
- White Paper
- Latest Press Release
- Industry Association
- Paid Database
- Investor Presentations

Step 4 - Data Triangulation
Involves using different sources of information in order to increase the validity of a study
These sources are likely to be stakeholders in a program - participants, other researchers, program staff, other community members, and so on.
Then we put all data in single framework & apply various statistical tools to find out the dynamic on the market.
During the analysis stage, feedback from the stakeholder groups would be compared to determine areas of agreement as well as areas of divergence


