
Key Insights
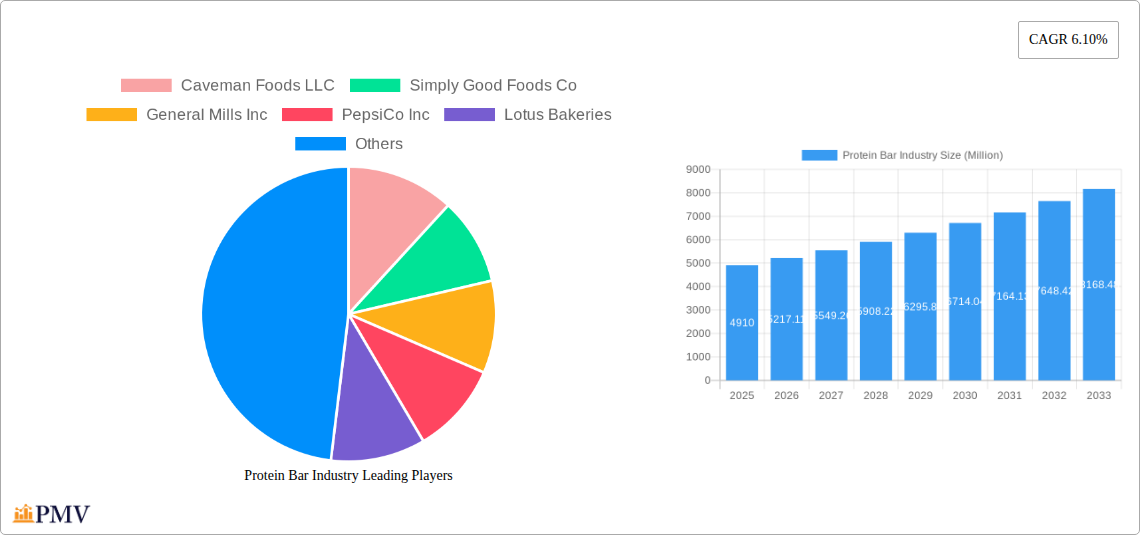
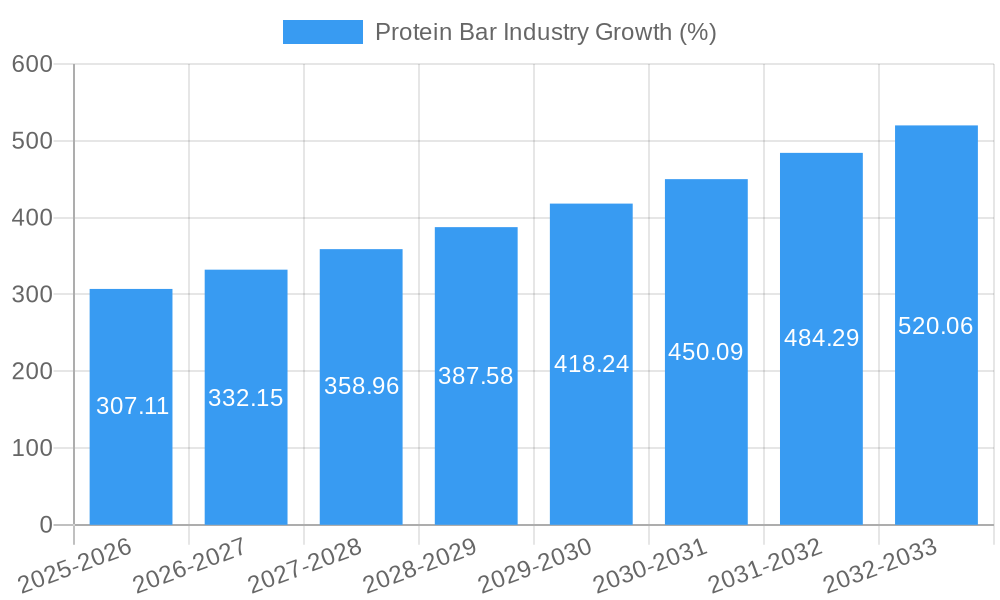
The global protein bar market, valued at $4.91 billion in 2025, is projected to experience robust growth, exhibiting a compound annual growth rate (CAGR) of 6.10% from 2025 to 2033. This expansion is fueled by several key drivers. The rising prevalence of health-conscious consumers seeking convenient and nutritious protein sources is a significant factor. Increased participation in fitness activities and a growing awareness of the importance of protein for muscle building and overall health are further bolstering market demand. The proliferation of innovative product offerings, including bars with enhanced flavor profiles, functional ingredients (like added vitamins and minerals), and diverse textures, caters to evolving consumer preferences and contributes to market growth. The increasing availability of protein bars through diverse distribution channels, encompassing convenience stores, online retailers, and supermarkets, also enhances market accessibility and fuels sales. While challenges such as fluctuating raw material prices and concerns about added sugars in certain products exist, the overall market trajectory points towards continued expansion.
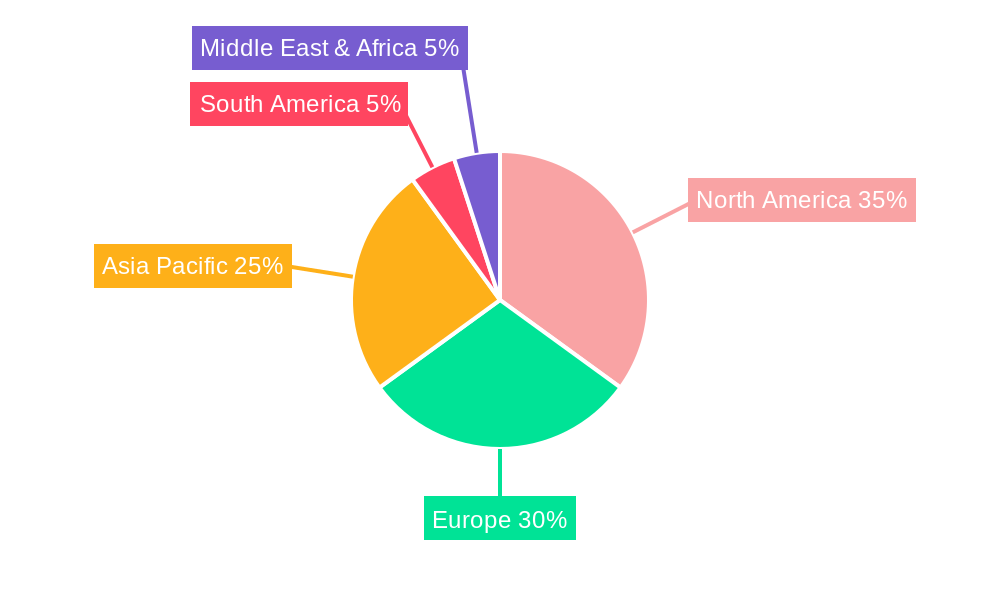
Segment-wise, the online retail channel is expected to witness significant growth due to the increasing popularity of e-commerce and the convenience it offers. Supermarkets and hypermarkets maintain a strong presence, benefiting from established distribution networks and broader consumer reach. The competitive landscape is characterized by a mix of established multinational corporations like General Mills and PepsiCo, alongside smaller, specialized brands focusing on niche markets (e.g., vegan or organic protein bars). Geographically, North America and Europe currently hold significant market shares, driven by high consumer awareness and established health and wellness trends. However, the Asia-Pacific region is anticipated to witness substantial growth in the coming years, fueled by rising disposable incomes and increasing health consciousness among a burgeoning middle class. This presents significant opportunities for expansion and market penetration for existing and new players.
Protein Bar Industry Market Report: 2019-2033
This comprehensive report provides a detailed analysis of the global protein bar industry, offering actionable insights for businesses, investors, and stakeholders. The study period covers 2019-2033, with a base year of 2025 and a forecast period of 2025-2033. The report analyzes market size, growth drivers, competitive dynamics, and future trends, utilizing data from the historical period (2019-2024) and incorporating estimations for the future. The total market size in 2025 is estimated at $XX Billion.
Protein Bar Industry Market Structure & Competitive Dynamics
The global protein bar market is characterized by a moderately concentrated structure, with key players holding significant market share. Major companies like General Mills Inc., PepsiCo Inc., and Mars Incorporated dominate the market, leveraging their established brands and extensive distribution networks. However, smaller, specialized brands are also gaining traction, focusing on niche segments like organic or vegan protein bars. The industry witnesses continuous innovation, driven by evolving consumer preferences and technological advancements in protein sources and formulation. Regulatory frameworks concerning labeling, ingredients, and health claims play a critical role. Product substitutes, such as protein shakes and other convenient snacks, pose a competitive challenge. The market displays significant M&A activity, with larger companies acquiring smaller players to expand their product portfolios and market reach. For instance, while precise deal values are unavailable for all transactions, estimated M&A deal values in the recent past exceed $XX Billion annually. Market share data reveals that the top 5 players collectively hold approximately XX% of the global market, while the remaining share is distributed amongst numerous smaller players.
- Market Concentration: Moderately concentrated
- Innovation Ecosystem: Active, with focus on new flavors, ingredients, and functional benefits.
- Regulatory Frameworks: Vary by region, impacting ingredient labeling and marketing claims.
- Product Substitutes: Protein shakes, energy bars, and other convenient snacks.
- End-User Trends: Growing demand for healthier, more convenient, and functional snacks.
- M&A Activities: Significant activity, driven by expansion and diversification strategies.
Protein Bar Industry Industry Trends & Insights
The protein bar industry exhibits robust growth, driven by increasing health consciousness, rising disposable incomes, and the growing popularity of fitness and wellness lifestyles. The Compound Annual Growth Rate (CAGR) for the period 2019-2024 is estimated at XX%, and is projected to reach XX% during the forecast period (2025-2033). This growth is further fueled by technological advancements in protein extraction and formulation, leading to the development of more nutritious and palatable protein bars. Consumer preferences are shifting toward bars with natural ingredients, reduced sugar content, and specific functional benefits (e.g., increased energy, improved immunity). Competitive dynamics are intense, with companies focusing on product differentiation, brand building, and strategic partnerships to gain a market edge. Market penetration is high in developed countries, but significant growth potential remains in emerging economies.
Dominant Markets & Segments in Protein Bar Industry
The North American market currently holds the dominant position in the global protein bar industry, driven by high consumer demand for convenient and protein-rich snacks. However, other regions are experiencing rapid growth, particularly Asia-Pacific, fueled by increasing health awareness and disposable incomes. Within distribution channels, Supermarket/Hypermarkets and Online Retail Stores dominate, although the convenience store segment is gaining traction.
- Key Drivers for Supermarket/Hypermarket Dominance: Wide reach, established supply chains, and bulk purchasing power.
- Key Drivers for Online Retail Store Growth: Convenience, wider product selection, and targeted marketing.
- Key Drivers for Convenience Store Growth: Increasing accessibility and impulse purchases.
- Key Drivers for "Others" Segment Growth: Specialty stores, gyms, and direct-to-consumer sales.
Detailed dominance analysis reveals that Supermarket/Hypermarkets command approximately XX% of the market share, followed by Online Retail Stores at XX%, Convenience Stores at XX%, and the "Others" segment at XX%.
Protein Bar Industry Product Innovations
Recent product innovations reflect a strong emphasis on improving taste, texture, and nutritional profiles. This includes the introduction of novel protein sources, reduced sugar formulations, and the addition of functional ingredients such as probiotics and vitamins. Technological advancements in extrusion and other processing techniques allow for the creation of bars with improved texture and shelf life. The market is also witnessing a rise in specialized protein bars catering to specific dietary needs and fitness goals, such as vegan, ketogenic, and high-fiber options. These innovations contribute to improved market fit and competitive advantages.
Report Segmentation & Scope
This report segments the protein bar market by distribution channel:
Convenience Store: This segment is characterized by high impulse purchases and a focus on smaller, readily available bars. Growth is projected at XX% during the forecast period, driven by increased convenience store presence in urban areas. Market size in 2025 is estimated at $XX Billion.
Online Retail Store: This segment benefits from the ease of purchasing and wider selection available online. Growth is projected at XX%, driven by increased e-commerce penetration. Market size in 2025 is estimated at $XX Billion.
Supermarket/Hypermarket: This segment accounts for a significant market share due to established distribution networks. Growth is projected to be at XX% driven by increased consumer preference for healthier options. Market size in 2025 is estimated at $XX Billion.
Others: This segment includes specialty stores, gyms, and direct-to-consumer sales. This segment shows growth at XX% during the forecast period, driven by niche market expansion. Market size in 2025 is estimated at $XX Billion.
Key Drivers of Protein Bar Industry Growth
Several factors fuel the protein bar industry's growth:
- Rising Health Consciousness: Consumers are increasingly prioritizing health and wellness, leading to higher demand for nutritious snacks.
- Busy Lifestyles: Protein bars provide a convenient and quick source of protein for individuals with busy schedules.
- Technological Advancements: Innovations in protein sources and processing techniques lead to improved product quality and variety.
- Favorable Regulatory Environment: Supportive regulations in some regions encourage the development and marketing of health-conscious products.
Challenges in the Protein Bar Industry Sector
The protein bar industry faces several challenges:
- Intense Competition: The market is highly competitive, with established players and new entrants vying for market share.
- Supply Chain Disruptions: Fluctuations in raw material prices and supply chain bottlenecks can impact profitability.
- Health and Safety Regulations: Stringent regulations concerning labeling and ingredients can increase production costs and complexity.
- Consumer Preferences: Shifting consumer preferences require constant innovation and product development to maintain market relevance.
Leading Players in the Protein Bar Industry Market
- Caveman Foods LLC
- Simply Good Foods Co
- General Mills Inc
- PepsiCo Inc
- Lotus Bakeries
- GNC Holdings LLC
- Naturell India Pvt Ltd
- Mars Incorporated
- Fitshit Health Solutions Pvt Ltd
- The Hershey Company
- Associated British Foods PLC
- Stayfit Enterprize Private Limited
- Glanbia Plc
- Kellogg Company
Key Developments in Protein Bar Industry Sector
- January 2023: The Hershey Company launched caffeinated protein bars in vanilla latte and caramel macchiato flavors. This broadened the product portfolio and targeted a new consumer segment.
- April 2023: The Hershey Company launched a Peanut Butter & Jelly flavored protein bar under its ONE Brands line. This capitalized on popular flavor combinations and enhanced consumer appeal.
- May 2023: General Mills Inc. expanded its Nature Valley brand with savory nut crunch bars, diversifying its product offerings and appealing to a broader consumer base.
Strategic Protein Bar Industry Market Outlook
The future of the protein bar industry is bright, with continued growth expected due to persistent consumer demand for healthier and convenient snacking options. Strategic opportunities exist in expanding into emerging markets, developing innovative products catering to niche dietary needs, and leveraging technology to enhance the consumer experience. Focus on sustainability and ethical sourcing of ingredients will also become increasingly important. Companies that successfully navigate these trends and adapt their strategies will be well-positioned for continued success in this dynamic market.
Protein Bar Industry Segmentation
-
1. Distribution Channel
- 1.1. Convenience Store
- 1.2. Online Retail Store
- 1.3. Supermarket/Hypermarket
- 1.4. Others
Protein Bar Industry Segmentation By Geography
-
1. North America
- 1.1. United States
- 1.2. Canada
- 1.3. Mexico
-
2. South America
- 2.1. Brazil
- 2.2. Argentina
- 2.3. Rest of South America
-
3. Europe
- 3.1. United Kingdom
- 3.2. Germany
- 3.3. France
- 3.4. Italy
- 3.5. Spain
- 3.6. Russia
- 3.7. Benelux
- 3.8. Nordics
- 3.9. Rest of Europe
-
4. Middle East & Africa
- 4.1. Turkey
- 4.2. Israel
- 4.3. GCC
- 4.4. North Africa
- 4.5. South Africa
- 4.6. Rest of Middle East & Africa
-
5. Asia Pacific
- 5.1. China
- 5.2. India
- 5.3. Japan
- 5.4. South Korea
- 5.5. ASEAN
- 5.6. Oceania
- 5.7. Rest of Asia Pacific
Protein Bar Industry REPORT HIGHLIGHTS
| Aspects | Details |
|---|---|
| Study Period | 2019-2033 |
| Base Year | 2024 |
| Estimated Year | 2025 |
| Forecast Period | 2025-2033 |
| Historical Period | 2019-2024 |
| Growth Rate | CAGR of 6.10% from 2019-2033 |
| Segmentation |
|
Table of Contents
- 1. Introduction
- 1.1. Research Scope
- 1.2. Market Segmentation
- 1.3. Research Methodology
- 1.4. Definitions and Assumptions
- 2. Executive Summary
- 2.1. Introduction
- 3. Market Dynamics
- 3.1. Introduction
- 3.2. Market Drivers
- 3.2.1. Increasing Demand for Low-Fat and Fat-Free Food Products; Expanding Cosmetic and Personal Care Industries Utilize Gelatin for Various Purposes
- 3.3. Market Restrains
- 3.3.1. Fluctuations in Raw Material Proces Affecting Production Costs
- 3.4. Market Trends
- 3.4.1. OTHER KEY INDUSTRY TRENDS COVERED IN THE REPORT
- 4. Market Factor Analysis
- 4.1. Porters Five Forces
- 4.2. Supply/Value Chain
- 4.3. PESTEL analysis
- 4.4. Market Entropy
- 4.5. Patent/Trademark Analysis
- 5. Global Protein Bar Industry Analysis, Insights and Forecast, 2019-2031
- 5.1. Market Analysis, Insights and Forecast - by Distribution Channel
- 5.1.1. Convenience Store
- 5.1.2. Online Retail Store
- 5.1.3. Supermarket/Hypermarket
- 5.1.4. Others
- 5.2. Market Analysis, Insights and Forecast - by Region
- 5.2.1. North America
- 5.2.2. South America
- 5.2.3. Europe
- 5.2.4. Middle East & Africa
- 5.2.5. Asia Pacific
- 5.1. Market Analysis, Insights and Forecast - by Distribution Channel
- 6. North America Protein Bar Industry Analysis, Insights and Forecast, 2019-2031
- 6.1. Market Analysis, Insights and Forecast - by Distribution Channel
- 6.1.1. Convenience Store
- 6.1.2. Online Retail Store
- 6.1.3. Supermarket/Hypermarket
- 6.1.4. Others
- 6.1. Market Analysis, Insights and Forecast - by Distribution Channel
- 7. South America Protein Bar Industry Analysis, Insights and Forecast, 2019-2031
- 7.1. Market Analysis, Insights and Forecast - by Distribution Channel
- 7.1.1. Convenience Store
- 7.1.2. Online Retail Store
- 7.1.3. Supermarket/Hypermarket
- 7.1.4. Others
- 7.1. Market Analysis, Insights and Forecast - by Distribution Channel
- 8. Europe Protein Bar Industry Analysis, Insights and Forecast, 2019-2031
- 8.1. Market Analysis, Insights and Forecast - by Distribution Channel
- 8.1.1. Convenience Store
- 8.1.2. Online Retail Store
- 8.1.3. Supermarket/Hypermarket
- 8.1.4. Others
- 8.1. Market Analysis, Insights and Forecast - by Distribution Channel
- 9. Middle East & Africa Protein Bar Industry Analysis, Insights and Forecast, 2019-2031
- 9.1. Market Analysis, Insights and Forecast - by Distribution Channel
- 9.1.1. Convenience Store
- 9.1.2. Online Retail Store
- 9.1.3. Supermarket/Hypermarket
- 9.1.4. Others
- 9.1. Market Analysis, Insights and Forecast - by Distribution Channel
- 10. Asia Pacific Protein Bar Industry Analysis, Insights and Forecast, 2019-2031
- 10.1. Market Analysis, Insights and Forecast - by Distribution Channel
- 10.1.1. Convenience Store
- 10.1.2. Online Retail Store
- 10.1.3. Supermarket/Hypermarket
- 10.1.4. Others
- 10.1. Market Analysis, Insights and Forecast - by Distribution Channel
- 11. North America Protein Bar Industry Analysis, Insights and Forecast, 2019-2031
- 11.1. Market Analysis, Insights and Forecast - By Country/Sub-region
- 11.1.1 United States
- 11.1.2 Canada
- 11.1.3 Mexico
- 11.1.4 Rest of North America
- 12. Europe Protein Bar Industry Analysis, Insights and Forecast, 2019-2031
- 12.1. Market Analysis, Insights and Forecast - By Country/Sub-region
- 12.1.1 Germany
- 12.1.2 France
- 12.1.3 Italy
- 12.1.4 United Kingdom
- 12.1.5 Netherlands
- 12.1.6 Sweden
- 12.1.7 Rest of Europe
- 13. Asia Pacific Protein Bar Industry Analysis, Insights and Forecast, 2019-2031
- 13.1. Market Analysis, Insights and Forecast - By Country/Sub-region
- 13.1.1 China
- 13.1.2 India
- 13.1.3 Japan
- 13.1.4 South Korea
- 13.1.5 Rest of Asia Pacific
- 14. South America Protein Bar Industry Analysis, Insights and Forecast, 2019-2031
- 14.1. Market Analysis, Insights and Forecast - By Country/Sub-region
- 14.1.1 Brazil
- 14.1.2 Argentina
- 14.1.3 Rest of South America
- 15. Middle East Protein Bar Industry Analysis, Insights and Forecast, 2019-2031
- 15.1. Market Analysis, Insights and Forecast - By Country/Sub-region
- 15.1.1 Middle East
- 15.1.2 Africa
- 16. Competitive Analysis
- 16.1. Global Market Share Analysis 2024
- 16.2. Company Profiles
- 16.2.1 Caveman Foods LLC
- 16.2.1.1. Overview
- 16.2.1.2. Products
- 16.2.1.3. SWOT Analysis
- 16.2.1.4. Recent Developments
- 16.2.1.5. Financials (Based on Availability)
- 16.2.2 Simply Good Foods Co
- 16.2.2.1. Overview
- 16.2.2.2. Products
- 16.2.2.3. SWOT Analysis
- 16.2.2.4. Recent Developments
- 16.2.2.5. Financials (Based on Availability)
- 16.2.3 General Mills Inc
- 16.2.3.1. Overview
- 16.2.3.2. Products
- 16.2.3.3. SWOT Analysis
- 16.2.3.4. Recent Developments
- 16.2.3.5. Financials (Based on Availability)
- 16.2.4 PepsiCo Inc
- 16.2.4.1. Overview
- 16.2.4.2. Products
- 16.2.4.3. SWOT Analysis
- 16.2.4.4. Recent Developments
- 16.2.4.5. Financials (Based on Availability)
- 16.2.5 Lotus Bakeries
- 16.2.5.1. Overview
- 16.2.5.2. Products
- 16.2.5.3. SWOT Analysis
- 16.2.5.4. Recent Developments
- 16.2.5.5. Financials (Based on Availability)
- 16.2.6 GNC Holdings LLC
- 16.2.6.1. Overview
- 16.2.6.2. Products
- 16.2.6.3. SWOT Analysis
- 16.2.6.4. Recent Developments
- 16.2.6.5. Financials (Based on Availability)
- 16.2.7 Naturell India Pvt Ltd
- 16.2.7.1. Overview
- 16.2.7.2. Products
- 16.2.7.3. SWOT Analysis
- 16.2.7.4. Recent Developments
- 16.2.7.5. Financials (Based on Availability)
- 16.2.8 Mars Incorporated
- 16.2.8.1. Overview
- 16.2.8.2. Products
- 16.2.8.3. SWOT Analysis
- 16.2.8.4. Recent Developments
- 16.2.8.5. Financials (Based on Availability)
- 16.2.9 Fitshit Health Solutions Pvt Ltd
- 16.2.9.1. Overview
- 16.2.9.2. Products
- 16.2.9.3. SWOT Analysis
- 16.2.9.4. Recent Developments
- 16.2.9.5. Financials (Based on Availability)
- 16.2.10 The Hershey Compan
- 16.2.10.1. Overview
- 16.2.10.2. Products
- 16.2.10.3. SWOT Analysis
- 16.2.10.4. Recent Developments
- 16.2.10.5. Financials (Based on Availability)
- 16.2.11 Associated British Foods PLC
- 16.2.11.1. Overview
- 16.2.11.2. Products
- 16.2.11.3. SWOT Analysis
- 16.2.11.4. Recent Developments
- 16.2.11.5. Financials (Based on Availability)
- 16.2.12 Stayfit Enterprize Private Limited
- 16.2.12.1. Overview
- 16.2.12.2. Products
- 16.2.12.3. SWOT Analysis
- 16.2.12.4. Recent Developments
- 16.2.12.5. Financials (Based on Availability)
- 16.2.13 Glanbia Plc
- 16.2.13.1. Overview
- 16.2.13.2. Products
- 16.2.13.3. SWOT Analysis
- 16.2.13.4. Recent Developments
- 16.2.13.5. Financials (Based on Availability)
- 16.2.14 Kellogg Company
- 16.2.14.1. Overview
- 16.2.14.2. Products
- 16.2.14.3. SWOT Analysis
- 16.2.14.4. Recent Developments
- 16.2.14.5. Financials (Based on Availability)
- 16.2.1 Caveman Foods LLC
List of Figures
- Figure 1: Global Protein Bar Industry Revenue Breakdown (Million, %) by Region 2024 & 2032
- Figure 2: Global Protein Bar Industry Volume Breakdown (K Tons, %) by Region 2024 & 2032
- Figure 3: North America Protein Bar Industry Revenue (Million), by Country 2024 & 2032
- Figure 4: North America Protein Bar Industry Volume (K Tons), by Country 2024 & 2032
- Figure 5: North America Protein Bar Industry Revenue Share (%), by Country 2024 & 2032
- Figure 6: North America Protein Bar Industry Volume Share (%), by Country 2024 & 2032
- Figure 7: Europe Protein Bar Industry Revenue (Million), by Country 2024 & 2032
- Figure 8: Europe Protein Bar Industry Volume (K Tons), by Country 2024 & 2032
- Figure 9: Europe Protein Bar Industry Revenue Share (%), by Country 2024 & 2032
- Figure 10: Europe Protein Bar Industry Volume Share (%), by Country 2024 & 2032
- Figure 11: Asia Pacific Protein Bar Industry Revenue (Million), by Country 2024 & 2032
- Figure 12: Asia Pacific Protein Bar Industry Volume (K Tons), by Country 2024 & 2032
- Figure 13: Asia Pacific Protein Bar Industry Revenue Share (%), by Country 2024 & 2032
- Figure 14: Asia Pacific Protein Bar Industry Volume Share (%), by Country 2024 & 2032
- Figure 15: South America Protein Bar Industry Revenue (Million), by Country 2024 & 2032
- Figure 16: South America Protein Bar Industry Volume (K Tons), by Country 2024 & 2032
- Figure 17: South America Protein Bar Industry Revenue Share (%), by Country 2024 & 2032
- Figure 18: South America Protein Bar Industry Volume Share (%), by Country 2024 & 2032
- Figure 19: Middle East Protein Bar Industry Revenue (Million), by Country 2024 & 2032
- Figure 20: Middle East Protein Bar Industry Volume (K Tons), by Country 2024 & 2032
- Figure 21: Middle East Protein Bar Industry Revenue Share (%), by Country 2024 & 2032
- Figure 22: Middle East Protein Bar Industry Volume Share (%), by Country 2024 & 2032
- Figure 23: North America Protein Bar Industry Revenue (Million), by Distribution Channel 2024 & 2032
- Figure 24: North America Protein Bar Industry Volume (K Tons), by Distribution Channel 2024 & 2032
- Figure 25: North America Protein Bar Industry Revenue Share (%), by Distribution Channel 2024 & 2032
- Figure 26: North America Protein Bar Industry Volume Share (%), by Distribution Channel 2024 & 2032
- Figure 27: North America Protein Bar Industry Revenue (Million), by Country 2024 & 2032
- Figure 28: North America Protein Bar Industry Volume (K Tons), by Country 2024 & 2032
- Figure 29: North America Protein Bar Industry Revenue Share (%), by Country 2024 & 2032
- Figure 30: North America Protein Bar Industry Volume Share (%), by Country 2024 & 2032
- Figure 31: South America Protein Bar Industry Revenue (Million), by Distribution Channel 2024 & 2032
- Figure 32: South America Protein Bar Industry Volume (K Tons), by Distribution Channel 2024 & 2032
- Figure 33: South America Protein Bar Industry Revenue Share (%), by Distribution Channel 2024 & 2032
- Figure 34: South America Protein Bar Industry Volume Share (%), by Distribution Channel 2024 & 2032
- Figure 35: South America Protein Bar Industry Revenue (Million), by Country 2024 & 2032
- Figure 36: South America Protein Bar Industry Volume (K Tons), by Country 2024 & 2032
- Figure 37: South America Protein Bar Industry Revenue Share (%), by Country 2024 & 2032
- Figure 38: South America Protein Bar Industry Volume Share (%), by Country 2024 & 2032
- Figure 39: Europe Protein Bar Industry Revenue (Million), by Distribution Channel 2024 & 2032
- Figure 40: Europe Protein Bar Industry Volume (K Tons), by Distribution Channel 2024 & 2032
- Figure 41: Europe Protein Bar Industry Revenue Share (%), by Distribution Channel 2024 & 2032
- Figure 42: Europe Protein Bar Industry Volume Share (%), by Distribution Channel 2024 & 2032
- Figure 43: Europe Protein Bar Industry Revenue (Million), by Country 2024 & 2032
- Figure 44: Europe Protein Bar Industry Volume (K Tons), by Country 2024 & 2032
- Figure 45: Europe Protein Bar Industry Revenue Share (%), by Country 2024 & 2032
- Figure 46: Europe Protein Bar Industry Volume Share (%), by Country 2024 & 2032
- Figure 47: Middle East & Africa Protein Bar Industry Revenue (Million), by Distribution Channel 2024 & 2032
- Figure 48: Middle East & Africa Protein Bar Industry Volume (K Tons), by Distribution Channel 2024 & 2032
- Figure 49: Middle East & Africa Protein Bar Industry Revenue Share (%), by Distribution Channel 2024 & 2032
- Figure 50: Middle East & Africa Protein Bar Industry Volume Share (%), by Distribution Channel 2024 & 2032
- Figure 51: Middle East & Africa Protein Bar Industry Revenue (Million), by Country 2024 & 2032
- Figure 52: Middle East & Africa Protein Bar Industry Volume (K Tons), by Country 2024 & 2032
- Figure 53: Middle East & Africa Protein Bar Industry Revenue Share (%), by Country 2024 & 2032
- Figure 54: Middle East & Africa Protein Bar Industry Volume Share (%), by Country 2024 & 2032
- Figure 55: Asia Pacific Protein Bar Industry Revenue (Million), by Distribution Channel 2024 & 2032
- Figure 56: Asia Pacific Protein Bar Industry Volume (K Tons), by Distribution Channel 2024 & 2032
- Figure 57: Asia Pacific Protein Bar Industry Revenue Share (%), by Distribution Channel 2024 & 2032
- Figure 58: Asia Pacific Protein Bar Industry Volume Share (%), by Distribution Channel 2024 & 2032
- Figure 59: Asia Pacific Protein Bar Industry Revenue (Million), by Country 2024 & 2032
- Figure 60: Asia Pacific Protein Bar Industry Volume (K Tons), by Country 2024 & 2032
- Figure 61: Asia Pacific Protein Bar Industry Revenue Share (%), by Country 2024 & 2032
- Figure 62: Asia Pacific Protein Bar Industry Volume Share (%), by Country 2024 & 2032
List of Tables
- Table 1: Global Protein Bar Industry Revenue Million Forecast, by Region 2019 & 2032
- Table 2: Global Protein Bar Industry Volume K Tons Forecast, by Region 2019 & 2032
- Table 3: Global Protein Bar Industry Revenue Million Forecast, by Distribution Channel 2019 & 2032
- Table 4: Global Protein Bar Industry Volume K Tons Forecast, by Distribution Channel 2019 & 2032
- Table 5: Global Protein Bar Industry Revenue Million Forecast, by Region 2019 & 2032
- Table 6: Global Protein Bar Industry Volume K Tons Forecast, by Region 2019 & 2032
- Table 7: Global Protein Bar Industry Revenue Million Forecast, by Country 2019 & 2032
- Table 8: Global Protein Bar Industry Volume K Tons Forecast, by Country 2019 & 2032
- Table 9: United States Protein Bar Industry Revenue (Million) Forecast, by Application 2019 & 2032
- Table 10: United States Protein Bar Industry Volume (K Tons) Forecast, by Application 2019 & 2032
- Table 11: Canada Protein Bar Industry Revenue (Million) Forecast, by Application 2019 & 2032
- Table 12: Canada Protein Bar Industry Volume (K Tons) Forecast, by Application 2019 & 2032
- Table 13: Mexico Protein Bar Industry Revenue (Million) Forecast, by Application 2019 & 2032
- Table 14: Mexico Protein Bar Industry Volume (K Tons) Forecast, by Application 2019 & 2032
- Table 15: Rest of North America Protein Bar Industry Revenue (Million) Forecast, by Application 2019 & 2032
- Table 16: Rest of North America Protein Bar Industry Volume (K Tons) Forecast, by Application 2019 & 2032
- Table 17: Global Protein Bar Industry Revenue Million Forecast, by Country 2019 & 2032
- Table 18: Global Protein Bar Industry Volume K Tons Forecast, by Country 2019 & 2032
- Table 19: Germany Protein Bar Industry Revenue (Million) Forecast, by Application 2019 & 2032
- Table 20: Germany Protein Bar Industry Volume (K Tons) Forecast, by Application 2019 & 2032
- Table 21: France Protein Bar Industry Revenue (Million) Forecast, by Application 2019 & 2032
- Table 22: France Protein Bar Industry Volume (K Tons) Forecast, by Application 2019 & 2032
- Table 23: Italy Protein Bar Industry Revenue (Million) Forecast, by Application 2019 & 2032
- Table 24: Italy Protein Bar Industry Volume (K Tons) Forecast, by Application 2019 & 2032
- Table 25: United Kingdom Protein Bar Industry Revenue (Million) Forecast, by Application 2019 & 2032
- Table 26: United Kingdom Protein Bar Industry Volume (K Tons) Forecast, by Application 2019 & 2032
- Table 27: Netherlands Protein Bar Industry Revenue (Million) Forecast, by Application 2019 & 2032
- Table 28: Netherlands Protein Bar Industry Volume (K Tons) Forecast, by Application 2019 & 2032
- Table 29: Sweden Protein Bar Industry Revenue (Million) Forecast, by Application 2019 & 2032
- Table 30: Sweden Protein Bar Industry Volume (K Tons) Forecast, by Application 2019 & 2032
- Table 31: Rest of Europe Protein Bar Industry Revenue (Million) Forecast, by Application 2019 & 2032
- Table 32: Rest of Europe Protein Bar Industry Volume (K Tons) Forecast, by Application 2019 & 2032
- Table 33: Global Protein Bar Industry Revenue Million Forecast, by Country 2019 & 2032
- Table 34: Global Protein Bar Industry Volume K Tons Forecast, by Country 2019 & 2032
- Table 35: China Protein Bar Industry Revenue (Million) Forecast, by Application 2019 & 2032
- Table 36: China Protein Bar Industry Volume (K Tons) Forecast, by Application 2019 & 2032
- Table 37: India Protein Bar Industry Revenue (Million) Forecast, by Application 2019 & 2032
- Table 38: India Protein Bar Industry Volume (K Tons) Forecast, by Application 2019 & 2032
- Table 39: Japan Protein Bar Industry Revenue (Million) Forecast, by Application 2019 & 2032
- Table 40: Japan Protein Bar Industry Volume (K Tons) Forecast, by Application 2019 & 2032
- Table 41: South Korea Protein Bar Industry Revenue (Million) Forecast, by Application 2019 & 2032
- Table 42: South Korea Protein Bar Industry Volume (K Tons) Forecast, by Application 2019 & 2032
- Table 43: Rest of Asia Pacific Protein Bar Industry Revenue (Million) Forecast, by Application 2019 & 2032
- Table 44: Rest of Asia Pacific Protein Bar Industry Volume (K Tons) Forecast, by Application 2019 & 2032
- Table 45: Global Protein Bar Industry Revenue Million Forecast, by Country 2019 & 2032
- Table 46: Global Protein Bar Industry Volume K Tons Forecast, by Country 2019 & 2032
- Table 47: Brazil Protein Bar Industry Revenue (Million) Forecast, by Application 2019 & 2032
- Table 48: Brazil Protein Bar Industry Volume (K Tons) Forecast, by Application 2019 & 2032
- Table 49: Argentina Protein Bar Industry Revenue (Million) Forecast, by Application 2019 & 2032
- Table 50: Argentina Protein Bar Industry Volume (K Tons) Forecast, by Application 2019 & 2032
- Table 51: Rest of South America Protein Bar Industry Revenue (Million) Forecast, by Application 2019 & 2032
- Table 52: Rest of South America Protein Bar Industry Volume (K Tons) Forecast, by Application 2019 & 2032
- Table 53: Global Protein Bar Industry Revenue Million Forecast, by Country 2019 & 2032
- Table 54: Global Protein Bar Industry Volume K Tons Forecast, by Country 2019 & 2032
- Table 55: Middle East Protein Bar Industry Revenue (Million) Forecast, by Application 2019 & 2032
- Table 56: Middle East Protein Bar Industry Volume (K Tons) Forecast, by Application 2019 & 2032
- Table 57: Africa Protein Bar Industry Revenue (Million) Forecast, by Application 2019 & 2032
- Table 58: Africa Protein Bar Industry Volume (K Tons) Forecast, by Application 2019 & 2032
- Table 59: Global Protein Bar Industry Revenue Million Forecast, by Distribution Channel 2019 & 2032
- Table 60: Global Protein Bar Industry Volume K Tons Forecast, by Distribution Channel 2019 & 2032
- Table 61: Global Protein Bar Industry Revenue Million Forecast, by Country 2019 & 2032
- Table 62: Global Protein Bar Industry Volume K Tons Forecast, by Country 2019 & 2032
- Table 63: United States Protein Bar Industry Revenue (Million) Forecast, by Application 2019 & 2032
- Table 64: United States Protein Bar Industry Volume (K Tons) Forecast, by Application 2019 & 2032
- Table 65: Canada Protein Bar Industry Revenue (Million) Forecast, by Application 2019 & 2032
- Table 66: Canada Protein Bar Industry Volume (K Tons) Forecast, by Application 2019 & 2032
- Table 67: Mexico Protein Bar Industry Revenue (Million) Forecast, by Application 2019 & 2032
- Table 68: Mexico Protein Bar Industry Volume (K Tons) Forecast, by Application 2019 & 2032
- Table 69: Global Protein Bar Industry Revenue Million Forecast, by Distribution Channel 2019 & 2032
- Table 70: Global Protein Bar Industry Volume K Tons Forecast, by Distribution Channel 2019 & 2032
- Table 71: Global Protein Bar Industry Revenue Million Forecast, by Country 2019 & 2032
- Table 72: Global Protein Bar Industry Volume K Tons Forecast, by Country 2019 & 2032
- Table 73: Brazil Protein Bar Industry Revenue (Million) Forecast, by Application 2019 & 2032
- Table 74: Brazil Protein Bar Industry Volume (K Tons) Forecast, by Application 2019 & 2032
- Table 75: Argentina Protein Bar Industry Revenue (Million) Forecast, by Application 2019 & 2032
- Table 76: Argentina Protein Bar Industry Volume (K Tons) Forecast, by Application 2019 & 2032
- Table 77: Rest of South America Protein Bar Industry Revenue (Million) Forecast, by Application 2019 & 2032
- Table 78: Rest of South America Protein Bar Industry Volume (K Tons) Forecast, by Application 2019 & 2032
- Table 79: Global Protein Bar Industry Revenue Million Forecast, by Distribution Channel 2019 & 2032
- Table 80: Global Protein Bar Industry Volume K Tons Forecast, by Distribution Channel 2019 & 2032
- Table 81: Global Protein Bar Industry Revenue Million Forecast, by Country 2019 & 2032
- Table 82: Global Protein Bar Industry Volume K Tons Forecast, by Country 2019 & 2032
- Table 83: United Kingdom Protein Bar Industry Revenue (Million) Forecast, by Application 2019 & 2032
- Table 84: United Kingdom Protein Bar Industry Volume (K Tons) Forecast, by Application 2019 & 2032
- Table 85: Germany Protein Bar Industry Revenue (Million) Forecast, by Application 2019 & 2032
- Table 86: Germany Protein Bar Industry Volume (K Tons) Forecast, by Application 2019 & 2032
- Table 87: France Protein Bar Industry Revenue (Million) Forecast, by Application 2019 & 2032
- Table 88: France Protein Bar Industry Volume (K Tons) Forecast, by Application 2019 & 2032
- Table 89: Italy Protein Bar Industry Revenue (Million) Forecast, by Application 2019 & 2032
- Table 90: Italy Protein Bar Industry Volume (K Tons) Forecast, by Application 2019 & 2032
- Table 91: Spain Protein Bar Industry Revenue (Million) Forecast, by Application 2019 & 2032
- Table 92: Spain Protein Bar Industry Volume (K Tons) Forecast, by Application 2019 & 2032
- Table 93: Russia Protein Bar Industry Revenue (Million) Forecast, by Application 2019 & 2032
- Table 94: Russia Protein Bar Industry Volume (K Tons) Forecast, by Application 2019 & 2032
- Table 95: Benelux Protein Bar Industry Revenue (Million) Forecast, by Application 2019 & 2032
- Table 96: Benelux Protein Bar Industry Volume (K Tons) Forecast, by Application 2019 & 2032
- Table 97: Nordics Protein Bar Industry Revenue (Million) Forecast, by Application 2019 & 2032
- Table 98: Nordics Protein Bar Industry Volume (K Tons) Forecast, by Application 2019 & 2032
- Table 99: Rest of Europe Protein Bar Industry Revenue (Million) Forecast, by Application 2019 & 2032
- Table 100: Rest of Europe Protein Bar Industry Volume (K Tons) Forecast, by Application 2019 & 2032
- Table 101: Global Protein Bar Industry Revenue Million Forecast, by Distribution Channel 2019 & 2032
- Table 102: Global Protein Bar Industry Volume K Tons Forecast, by Distribution Channel 2019 & 2032
- Table 103: Global Protein Bar Industry Revenue Million Forecast, by Country 2019 & 2032
- Table 104: Global Protein Bar Industry Volume K Tons Forecast, by Country 2019 & 2032
- Table 105: Turkey Protein Bar Industry Revenue (Million) Forecast, by Application 2019 & 2032
- Table 106: Turkey Protein Bar Industry Volume (K Tons) Forecast, by Application 2019 & 2032
- Table 107: Israel Protein Bar Industry Revenue (Million) Forecast, by Application 2019 & 2032
- Table 108: Israel Protein Bar Industry Volume (K Tons) Forecast, by Application 2019 & 2032
- Table 109: GCC Protein Bar Industry Revenue (Million) Forecast, by Application 2019 & 2032
- Table 110: GCC Protein Bar Industry Volume (K Tons) Forecast, by Application 2019 & 2032
- Table 111: North Africa Protein Bar Industry Revenue (Million) Forecast, by Application 2019 & 2032
- Table 112: North Africa Protein Bar Industry Volume (K Tons) Forecast, by Application 2019 & 2032
- Table 113: South Africa Protein Bar Industry Revenue (Million) Forecast, by Application 2019 & 2032
- Table 114: South Africa Protein Bar Industry Volume (K Tons) Forecast, by Application 2019 & 2032
- Table 115: Rest of Middle East & Africa Protein Bar Industry Revenue (Million) Forecast, by Application 2019 & 2032
- Table 116: Rest of Middle East & Africa Protein Bar Industry Volume (K Tons) Forecast, by Application 2019 & 2032
- Table 117: Global Protein Bar Industry Revenue Million Forecast, by Distribution Channel 2019 & 2032
- Table 118: Global Protein Bar Industry Volume K Tons Forecast, by Distribution Channel 2019 & 2032
- Table 119: Global Protein Bar Industry Revenue Million Forecast, by Country 2019 & 2032
- Table 120: Global Protein Bar Industry Volume K Tons Forecast, by Country 2019 & 2032
- Table 121: China Protein Bar Industry Revenue (Million) Forecast, by Application 2019 & 2032
- Table 122: China Protein Bar Industry Volume (K Tons) Forecast, by Application 2019 & 2032
- Table 123: India Protein Bar Industry Revenue (Million) Forecast, by Application 2019 & 2032
- Table 124: India Protein Bar Industry Volume (K Tons) Forecast, by Application 2019 & 2032
- Table 125: Japan Protein Bar Industry Revenue (Million) Forecast, by Application 2019 & 2032
- Table 126: Japan Protein Bar Industry Volume (K Tons) Forecast, by Application 2019 & 2032
- Table 127: South Korea Protein Bar Industry Revenue (Million) Forecast, by Application 2019 & 2032
- Table 128: South Korea Protein Bar Industry Volume (K Tons) Forecast, by Application 2019 & 2032
- Table 129: ASEAN Protein Bar Industry Revenue (Million) Forecast, by Application 2019 & 2032
- Table 130: ASEAN Protein Bar Industry Volume (K Tons) Forecast, by Application 2019 & 2032
- Table 131: Oceania Protein Bar Industry Revenue (Million) Forecast, by Application 2019 & 2032
- Table 132: Oceania Protein Bar Industry Volume (K Tons) Forecast, by Application 2019 & 2032
- Table 133: Rest of Asia Pacific Protein Bar Industry Revenue (Million) Forecast, by Application 2019 & 2032
- Table 134: Rest of Asia Pacific Protein Bar Industry Volume (K Tons) Forecast, by Application 2019 & 2032
Frequently Asked Questions
1. What is the projected Compound Annual Growth Rate (CAGR) of the Protein Bar Industry?
The projected CAGR is approximately 6.10%.
2. Which companies are prominent players in the Protein Bar Industry?
Key companies in the market include Caveman Foods LLC, Simply Good Foods Co, General Mills Inc, PepsiCo Inc, Lotus Bakeries, GNC Holdings LLC, Naturell India Pvt Ltd, Mars Incorporated, Fitshit Health Solutions Pvt Ltd, The Hershey Compan, Associated British Foods PLC, Stayfit Enterprize Private Limited, Glanbia Plc, Kellogg Company.
3. What are the main segments of the Protein Bar Industry?
The market segments include Distribution Channel.
4. Can you provide details about the market size?
The market size is estimated to be USD 4910 Million as of 2022.
5. What are some drivers contributing to market growth?
Increasing Demand for Low-Fat and Fat-Free Food Products; Expanding Cosmetic and Personal Care Industries Utilize Gelatin for Various Purposes.
6. What are the notable trends driving market growth?
OTHER KEY INDUSTRY TRENDS COVERED IN THE REPORT.
7. Are there any restraints impacting market growth?
Fluctuations in Raw Material Proces Affecting Production Costs.
8. Can you provide examples of recent developments in the market?
May 2023: General Mills Inc. announced that it would be expanding its Nature Valley brand with the introduction of Nature Valley Savory Nut Crunch Bars.April 2023: Under the brand ONE Brands, The Hershey Company launched the Peanut Butter & Jelly Flavored Protein Bar. The ONE Limited Edition Peanut Butter & Jelly flavored bars are packed with 20 grams of protein, 1 gram of sugar, and the taste of peanut butter and strawberry jelly flavors.January 2023: The Hershey Company launched caffeinated protein bars. The range is available in two flavors: vanilla latte and caramel macchiato.
9. What pricing options are available for accessing the report?
Pricing options include single-user, multi-user, and enterprise licenses priced at USD 3800, USD 4500, and USD 5800 respectively.
10. Is the market size provided in terms of value or volume?
The market size is provided in terms of value, measured in Million and volume, measured in K Tons.
11. Are there any specific market keywords associated with the report?
Yes, the market keyword associated with the report is "Protein Bar Industry," which aids in identifying and referencing the specific market segment covered.
12. How do I determine which pricing option suits my needs best?
The pricing options vary based on user requirements and access needs. Individual users may opt for single-user licenses, while businesses requiring broader access may choose multi-user or enterprise licenses for cost-effective access to the report.
13. Are there any additional resources or data provided in the Protein Bar Industry report?
While the report offers comprehensive insights, it's advisable to review the specific contents or supplementary materials provided to ascertain if additional resources or data are available.
14. How can I stay updated on further developments or reports in the Protein Bar Industry?
To stay informed about further developments, trends, and reports in the Protein Bar Industry, consider subscribing to industry newsletters, following relevant companies and organizations, or regularly checking reputable industry news sources and publications.
Methodology
Step 1 - Identification of Relevant Samples Size from Population Database


Step 2 - Approaches for Defining Global Market Size (Value, Volume* & Price*)

Note*: In applicable scenarios
Step 3 - Data Sources
Primary Research
- Web Analytics
- Survey Reports
- Research Institute
- Latest Research Reports
- Opinion Leaders
Secondary Research
- Annual Reports
- White Paper
- Latest Press Release
- Industry Association
- Paid Database
- Investor Presentations

Step 4 - Data Triangulation
Involves using different sources of information in order to increase the validity of a study
These sources are likely to be stakeholders in a program - participants, other researchers, program staff, other community members, and so on.
Then we put all data in single framework & apply various statistical tools to find out the dynamic on the market.
During the analysis stage, feedback from the stakeholder groups would be compared to determine areas of agreement as well as areas of divergence


