
Key Insights
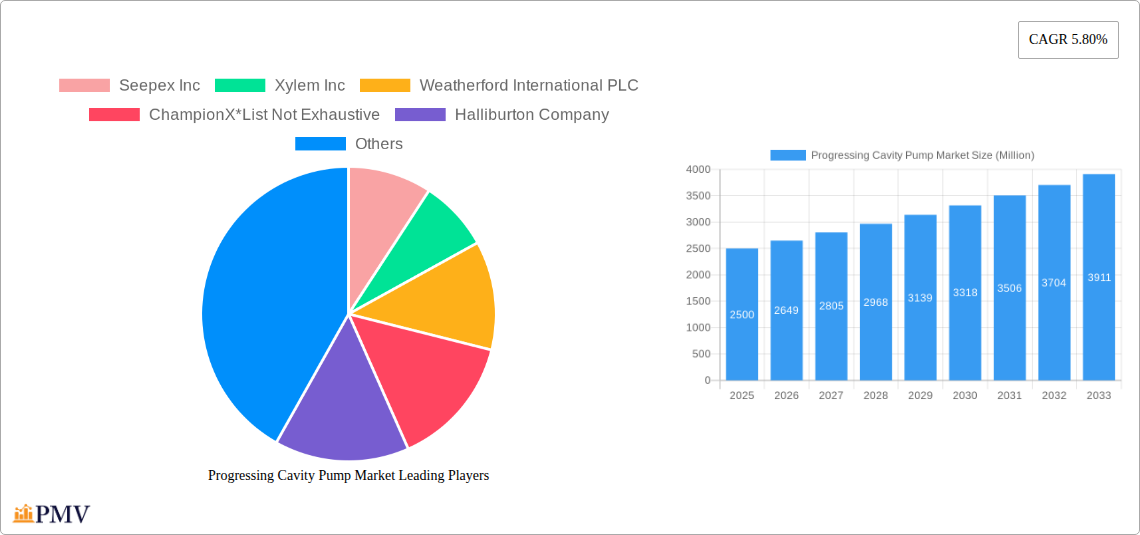
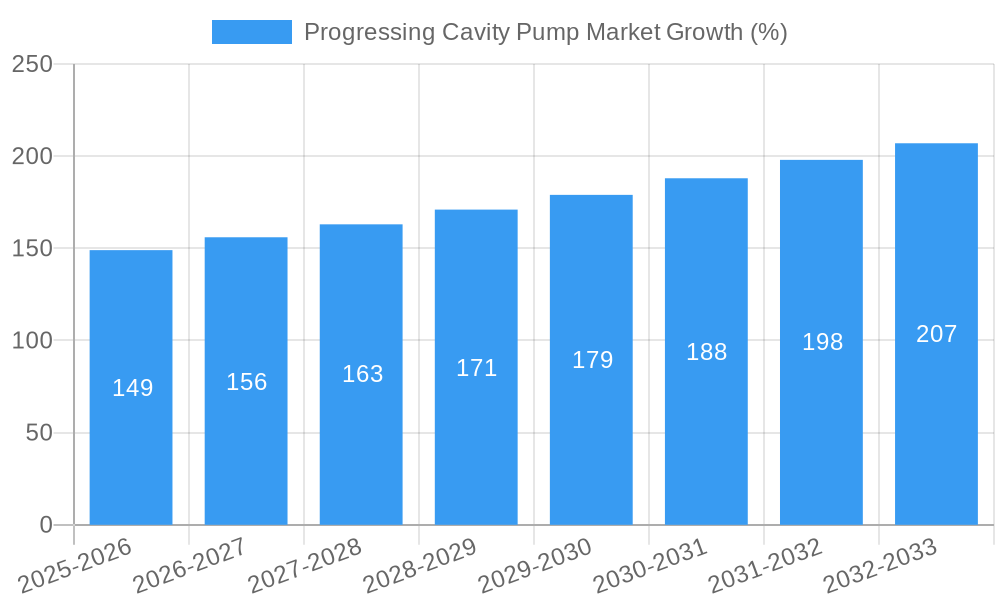
The progressing cavity pump (PCP) market, valued at approximately $XX million in 2025, is projected to experience robust growth, exhibiting a compound annual growth rate (CAGR) of 5.80% from 2025 to 2033. This expansion is driven by several key factors. Firstly, increasing demand across diverse end-user verticals, such as water and wastewater treatment, oil and gas extraction, and the chemical and petrochemical industries, fuels market growth. These sectors rely heavily on PCPs for their ability to handle high-viscosity fluids, slurries, and shear-sensitive materials efficiently and reliably. Furthermore, advancements in PCP technology, including improved materials, enhanced designs, and the integration of smart sensors for predictive maintenance, are contributing to increased efficiency and reduced operational costs. Government regulations promoting environmental sustainability and stricter emission standards are also indirectly boosting demand for PCPs, as they are often preferred for their energy efficiency compared to alternative pumping technologies. The market is segmented by power rating (up to 50 HP, 51-150 HP, above 150 HP) and end-user vertical (water and wastewater, oil and gas, chemicals and petrochemicals, food and beverage, and others), with the oil and gas sector currently dominating market share. Competition among key players like Seepex Inc, Xylem Inc, Weatherford International PLC, and others is fostering innovation and driving price competitiveness.
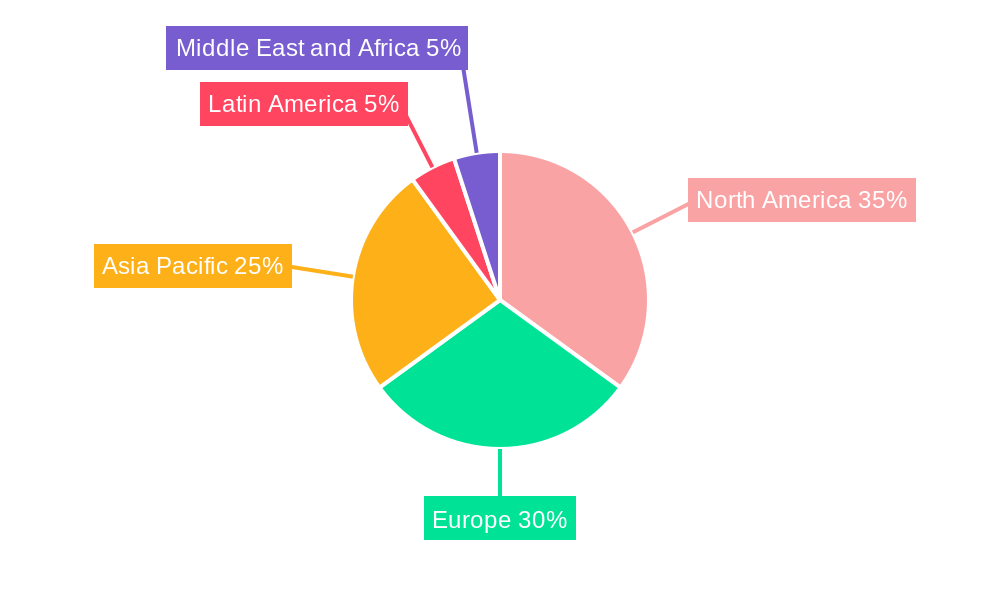
Geographical expansion is another crucial element driving market growth. While North America and Europe currently hold significant market shares, the Asia-Pacific region is anticipated to demonstrate substantial growth potential in the coming years, fueled by rapid industrialization and infrastructural development. However, the market faces certain restraints, including fluctuating raw material prices and potential supply chain disruptions. Despite these challenges, the long-term outlook for the PCP market remains positive, indicating a substantial growth trajectory throughout the forecast period (2025-2033). The continuous development of innovative PCP technologies catering to specific industry requirements will further propel market expansion.
Progressing Cavity Pump Market Report: 2019-2033
This comprehensive report provides a detailed analysis of the global Progressing Cavity Pump market, offering invaluable insights for stakeholders across the value chain. The study period spans from 2019 to 2033, with 2025 serving as the base and estimated year. The report covers market size, segmentation, competitive landscape, key trends, and future growth projections. It's an indispensable resource for businesses seeking to understand and capitalize on opportunities within this dynamic market.
Progressing Cavity Pump Market Market Structure & Competitive Dynamics
The progressing cavity pump market is characterized by a moderately concentrated structure, with several key players holding significant market share. Market concentration is expected to remain relatively stable during the forecast period (2025-2033), although M&A activity could alter this dynamic. Innovation within the sector is driven by the demand for energy-efficient and durable pumps, particularly within the high-pressure segments. Regulatory frameworks, particularly those related to environmental protection and safety standards, significantly influence market dynamics. Product substitutes, such as centrifugal pumps, present competitive pressure, particularly in applications where high viscosity fluids are not involved. End-user trends, such as the growing adoption of automation and digitalization, influence demand for smart pumps with advanced monitoring capabilities.
Key Market Dynamics:
- Market Share: Seepex Inc., Xylem Inc., and Netzsch Group hold a combined market share of approximately xx%, with other major players like Weatherford International PLC, ChampionX, Halliburton Company, National-Oilwell Varco Inc, PCM Group, and Schlumberger Limited comprising the remaining share. Smaller players and regional manufacturers account for the rest.
- M&A Activity: The past five years have seen xx M&A deals valued at approximately $xx Million, primarily focused on expanding geographic reach and product portfolios. Further consolidation is expected during the forecast period.
- Innovation Ecosystem: Collaborations between pump manufacturers and technology providers, such as the partnership between Xylem and Gross-Wen Technologies in October 2022, are driving innovations in areas such as sustainability and water treatment.
- Regulatory Landscape: Stringent emission standards and environmental regulations are driving demand for energy-efficient progressing cavity pumps across various sectors.
Progressing Cavity Pump Market Industry Trends & Insights
The progressing cavity pump market is experiencing robust growth, driven by several key factors. The global market size is projected to reach $xx Million by 2033, exhibiting a CAGR of xx% during the forecast period. Increased demand from the oil and gas, water and wastewater, and chemical industries is a major growth driver. Technological advancements, particularly in materials science and control systems, are enhancing pump efficiency, durability, and overall performance. Consumer preferences are shifting towards energy-efficient, environmentally friendly solutions, creating opportunities for manufacturers offering sustainable options. The competitive landscape is dynamic, with ongoing innovation, strategic partnerships, and M&A activity shaping market dynamics. Market penetration of progressing cavity pumps is particularly strong in high-viscosity fluid applications, and this is expected to continue. The report details specific market penetration rates by end-user sector and power rating.
Dominant Markets & Segments in Progressing Cavity Pump Market
Leading Region/Country: North America and Europe currently dominate the market, owing to established industrial infrastructure and strong demand from key sectors such as oil and gas, water and wastewater treatment, and chemicals. However, Asia-Pacific is poised for significant growth due to rapid industrialization and infrastructure development.
Dominant Segments:
- Power Rating: The "Between 51 to 150 HP" segment currently holds the largest market share due to its wide applicability across diverse sectors.
- Key Drivers: Increased adoption in medium-scale industrial applications.
- End-User Vertical: The oil and gas industry remains the dominant end-user, followed by water and wastewater treatment.
- Key Drivers: Oil and gas: high demand for transporting viscous fluids. Water and wastewater: increasing need for efficient sludge handling. Chemicals and petrochemicals: requirement for pumping chemically aggressive fluids. Food and beverage: need for hygienic and reliable pumping solutions.
Detailed Dominance Analysis: Further analysis within this section delves into the specific factors driving market leadership in each segment, considering economic policies, infrastructure development, and specific industry needs.
Progressing Cavity Pump Market Product Innovations
Recent product innovations focus on enhancing pump efficiency, durability, and ease of maintenance. Manufacturers are investing heavily in advanced materials and control systems to optimize performance and minimize downtime. The development of smart pumps with remote monitoring capabilities is a key trend, enabling predictive maintenance and maximizing operational efficiency. These advancements cater to evolving market demands for sustainable and cost-effective solutions, improving the market fit and providing significant competitive advantages.
Report Segmentation & Scope
The report segments the progressing cavity pump market by power rating (up to 50 HP, 51-150 HP, above 150 HP) and end-user vertical (water and wastewater, oil and gas, chemicals and petrochemicals, food and beverage, other end-users). Growth projections, market sizes, and competitive dynamics are analyzed for each segment. For instance, the "above 150 HP" segment shows strong growth potential due to the increasing demand for high-capacity pumps in large-scale industrial operations. Similarly, the water and wastewater treatment segment is predicted to experience significant growth due to increasing urbanization and stringent environmental regulations.
Key Drivers of Progressing Cavity Pump Market Growth
Several factors are driving the growth of the progressing cavity pump market:
- Rising demand from end-use industries: The oil and gas, water and wastewater, and chemical industries are key drivers due to the continuous need for efficient and reliable fluid handling systems.
- Technological advancements: Improvements in materials, designs, and control systems enhance pump efficiency, durability, and performance.
- Favorable government regulations: Incentives for energy efficiency and environmental protection promote the adoption of advanced pump technologies.
- Infrastructure development: Ongoing infrastructure projects globally increase demand for pumps for various applications.
Challenges in the Progressing Cavity Pump Market Sector
The market faces challenges including:
- High initial investment costs: Progressing cavity pumps can be more expensive than alternative technologies, potentially hindering adoption in cost-sensitive applications.
- Supply chain disruptions: Global supply chain issues can impact the availability and pricing of raw materials and components.
- Intense competition: The presence of several established players leads to intense competition, impacting pricing and profitability.
- Stringent regulatory requirements: Compliance with strict environmental and safety regulations adds to the costs and complexities of operations.
Leading Players in the Progressing Cavity Pump Market Market
- Seepex Inc.
- Xylem Inc.
- Weatherford International PLC
- ChampionX
- Halliburton Company
- National-Oilwell Varco Inc
- PCM Group
- Schlumberger Limited
- NETZSCH Group
Key Developments in Progressing Cavity Pump Market Sector
- February 2023: Netzsch Pumps & Systems expands production and logistics in East Asia with a new plant in Lanzhou, China, significantly increasing manufacturing capacity. This strengthens their position in a key growth market.
- October 2022: Xylem Singapore collaborates with Gross-Wen Technologies to develop sustainable algae-based wastewater treatment solutions, highlighting the increasing focus on environmentally friendly technologies within the industry.
Strategic Progressing Cavity Pump Market Market Outlook
The progressing cavity pump market is poised for continued growth, driven by increasing demand from various sectors and technological advancements. Strategic opportunities lie in developing energy-efficient and sustainable pump solutions, expanding into emerging markets, and leveraging digital technologies to optimize operations. The focus on sustainability and smart technologies will shape future market dynamics and present lucrative avenues for innovation and growth. The market is expected to witness further consolidation through mergers and acquisitions as companies strive for increased market share and global reach.
Progressing Cavity Pump Market Segmentation
-
1. Power Rating
- 1.1. Up to 50 HP
- 1.2. Between 51 to 150 HP
- 1.3. Above 150 HP
-
2. End-User Vertical
- 2.1. Water and Wastewater
- 2.2. Oil and Gas
- 2.3. Chemicals and Petrochemicals
- 2.4. Food and Beverage
- 2.5. Other End-Users
Progressing Cavity Pump Market Segmentation By Geography
- 1. North America
- 2. Europe
- 3. Asia Pacific
- 4. Latin America
- 5. Middle East and Africa
Progressing Cavity Pump Market REPORT HIGHLIGHTS
| Aspects | Details |
|---|---|
| Study Period | 2019-2033 |
| Base Year | 2024 |
| Estimated Year | 2025 |
| Forecast Period | 2025-2033 |
| Historical Period | 2019-2024 |
| Growth Rate | CAGR of 5.80% from 2019-2033 |
| Segmentation |
|
Table of Contents
- 1. Introduction
- 1.1. Research Scope
- 1.2. Market Segmentation
- 1.3. Research Methodology
- 1.4. Definitions and Assumptions
- 2. Executive Summary
- 2.1. Introduction
- 3. Market Dynamics
- 3.1. Introduction
- 3.2. Market Drivers
- 3.2.1. Increasing Demand From Water and Wastewater Management Infrastructure Industry Across the World; Suitability for Handling High-viscosity Fluids
- 3.3. Market Restrains
- 3.3.1. High Deployment and Maintenance Cost
- 3.4. Market Trends
- 3.4.1. Waste and Wastewater is Expected to Hold Major Share
- 4. Market Factor Analysis
- 4.1. Porters Five Forces
- 4.2. Supply/Value Chain
- 4.3. PESTEL analysis
- 4.4. Market Entropy
- 4.5. Patent/Trademark Analysis
- 5. Global Progressing Cavity Pump Market Analysis, Insights and Forecast, 2019-2031
- 5.1. Market Analysis, Insights and Forecast - by Power Rating
- 5.1.1. Up to 50 HP
- 5.1.2. Between 51 to 150 HP
- 5.1.3. Above 150 HP
- 5.2. Market Analysis, Insights and Forecast - by End-User Vertical
- 5.2.1. Water and Wastewater
- 5.2.2. Oil and Gas
- 5.2.3. Chemicals and Petrochemicals
- 5.2.4. Food and Beverage
- 5.2.5. Other End-Users
- 5.3. Market Analysis, Insights and Forecast - by Region
- 5.3.1. North America
- 5.3.2. Europe
- 5.3.3. Asia Pacific
- 5.3.4. Latin America
- 5.3.5. Middle East and Africa
- 5.1. Market Analysis, Insights and Forecast - by Power Rating
- 6. North America Progressing Cavity Pump Market Analysis, Insights and Forecast, 2019-2031
- 6.1. Market Analysis, Insights and Forecast - by Power Rating
- 6.1.1. Up to 50 HP
- 6.1.2. Between 51 to 150 HP
- 6.1.3. Above 150 HP
- 6.2. Market Analysis, Insights and Forecast - by End-User Vertical
- 6.2.1. Water and Wastewater
- 6.2.2. Oil and Gas
- 6.2.3. Chemicals and Petrochemicals
- 6.2.4. Food and Beverage
- 6.2.5. Other End-Users
- 6.1. Market Analysis, Insights and Forecast - by Power Rating
- 7. Europe Progressing Cavity Pump Market Analysis, Insights and Forecast, 2019-2031
- 7.1. Market Analysis, Insights and Forecast - by Power Rating
- 7.1.1. Up to 50 HP
- 7.1.2. Between 51 to 150 HP
- 7.1.3. Above 150 HP
- 7.2. Market Analysis, Insights and Forecast - by End-User Vertical
- 7.2.1. Water and Wastewater
- 7.2.2. Oil and Gas
- 7.2.3. Chemicals and Petrochemicals
- 7.2.4. Food and Beverage
- 7.2.5. Other End-Users
- 7.1. Market Analysis, Insights and Forecast - by Power Rating
- 8. Asia Pacific Progressing Cavity Pump Market Analysis, Insights and Forecast, 2019-2031
- 8.1. Market Analysis, Insights and Forecast - by Power Rating
- 8.1.1. Up to 50 HP
- 8.1.2. Between 51 to 150 HP
- 8.1.3. Above 150 HP
- 8.2. Market Analysis, Insights and Forecast - by End-User Vertical
- 8.2.1. Water and Wastewater
- 8.2.2. Oil and Gas
- 8.2.3. Chemicals and Petrochemicals
- 8.2.4. Food and Beverage
- 8.2.5. Other End-Users
- 8.1. Market Analysis, Insights and Forecast - by Power Rating
- 9. Latin America Progressing Cavity Pump Market Analysis, Insights and Forecast, 2019-2031
- 9.1. Market Analysis, Insights and Forecast - by Power Rating
- 9.1.1. Up to 50 HP
- 9.1.2. Between 51 to 150 HP
- 9.1.3. Above 150 HP
- 9.2. Market Analysis, Insights and Forecast - by End-User Vertical
- 9.2.1. Water and Wastewater
- 9.2.2. Oil and Gas
- 9.2.3. Chemicals and Petrochemicals
- 9.2.4. Food and Beverage
- 9.2.5. Other End-Users
- 9.1. Market Analysis, Insights and Forecast - by Power Rating
- 10. Middle East and Africa Progressing Cavity Pump Market Analysis, Insights and Forecast, 2019-2031
- 10.1. Market Analysis, Insights and Forecast - by Power Rating
- 10.1.1. Up to 50 HP
- 10.1.2. Between 51 to 150 HP
- 10.1.3. Above 150 HP
- 10.2. Market Analysis, Insights and Forecast - by End-User Vertical
- 10.2.1. Water and Wastewater
- 10.2.2. Oil and Gas
- 10.2.3. Chemicals and Petrochemicals
- 10.2.4. Food and Beverage
- 10.2.5. Other End-Users
- 10.1. Market Analysis, Insights and Forecast - by Power Rating
- 11. North America Progressing Cavity Pump Market Analysis, Insights and Forecast, 2019-2031
- 11.1. Market Analysis, Insights and Forecast - By Country/Sub-region
- 11.1.1.
- 12. Europe Progressing Cavity Pump Market Analysis, Insights and Forecast, 2019-2031
- 12.1. Market Analysis, Insights and Forecast - By Country/Sub-region
- 12.1.1.
- 13. Asia Pacific Progressing Cavity Pump Market Analysis, Insights and Forecast, 2019-2031
- 13.1. Market Analysis, Insights and Forecast - By Country/Sub-region
- 13.1.1.
- 14. Latin America Progressing Cavity Pump Market Analysis, Insights and Forecast, 2019-2031
- 14.1. Market Analysis, Insights and Forecast - By Country/Sub-region
- 14.1.1.
- 15. Middle East and Africa Progressing Cavity Pump Market Analysis, Insights and Forecast, 2019-2031
- 15.1. Market Analysis, Insights and Forecast - By Country/Sub-region
- 15.1.1.
- 16. Competitive Analysis
- 16.1. Global Market Share Analysis 2024
- 16.2. Company Profiles
- 16.2.1 Seepex Inc
- 16.2.1.1. Overview
- 16.2.1.2. Products
- 16.2.1.3. SWOT Analysis
- 16.2.1.4. Recent Developments
- 16.2.1.5. Financials (Based on Availability)
- 16.2.2 Xylem Inc
- 16.2.2.1. Overview
- 16.2.2.2. Products
- 16.2.2.3. SWOT Analysis
- 16.2.2.4. Recent Developments
- 16.2.2.5. Financials (Based on Availability)
- 16.2.3 Weatherford International PLC
- 16.2.3.1. Overview
- 16.2.3.2. Products
- 16.2.3.3. SWOT Analysis
- 16.2.3.4. Recent Developments
- 16.2.3.5. Financials (Based on Availability)
- 16.2.4 ChampionX*List Not Exhaustive
- 16.2.4.1. Overview
- 16.2.4.2. Products
- 16.2.4.3. SWOT Analysis
- 16.2.4.4. Recent Developments
- 16.2.4.5. Financials (Based on Availability)
- 16.2.5 Halliburton Company
- 16.2.5.1. Overview
- 16.2.5.2. Products
- 16.2.5.3. SWOT Analysis
- 16.2.5.4. Recent Developments
- 16.2.5.5. Financials (Based on Availability)
- 16.2.6 National-Oilwell Varco Inc
- 16.2.6.1. Overview
- 16.2.6.2. Products
- 16.2.6.3. SWOT Analysis
- 16.2.6.4. Recent Developments
- 16.2.6.5. Financials (Based on Availability)
- 16.2.7 PCM Group
- 16.2.7.1. Overview
- 16.2.7.2. Products
- 16.2.7.3. SWOT Analysis
- 16.2.7.4. Recent Developments
- 16.2.7.5. Financials (Based on Availability)
- 16.2.8 Schlumberger Limited
- 16.2.8.1. Overview
- 16.2.8.2. Products
- 16.2.8.3. SWOT Analysis
- 16.2.8.4. Recent Developments
- 16.2.8.5. Financials (Based on Availability)
- 16.2.9 NETZSCH Group
- 16.2.9.1. Overview
- 16.2.9.2. Products
- 16.2.9.3. SWOT Analysis
- 16.2.9.4. Recent Developments
- 16.2.9.5. Financials (Based on Availability)
- 16.2.1 Seepex Inc
List of Figures
- Figure 1: Global Progressing Cavity Pump Market Revenue Breakdown (Million, %) by Region 2024 & 2032
- Figure 2: North America Progressing Cavity Pump Market Revenue (Million), by Country 2024 & 2032
- Figure 3: North America Progressing Cavity Pump Market Revenue Share (%), by Country 2024 & 2032
- Figure 4: Europe Progressing Cavity Pump Market Revenue (Million), by Country 2024 & 2032
- Figure 5: Europe Progressing Cavity Pump Market Revenue Share (%), by Country 2024 & 2032
- Figure 6: Asia Pacific Progressing Cavity Pump Market Revenue (Million), by Country 2024 & 2032
- Figure 7: Asia Pacific Progressing Cavity Pump Market Revenue Share (%), by Country 2024 & 2032
- Figure 8: Latin America Progressing Cavity Pump Market Revenue (Million), by Country 2024 & 2032
- Figure 9: Latin America Progressing Cavity Pump Market Revenue Share (%), by Country 2024 & 2032
- Figure 10: Middle East and Africa Progressing Cavity Pump Market Revenue (Million), by Country 2024 & 2032
- Figure 11: Middle East and Africa Progressing Cavity Pump Market Revenue Share (%), by Country 2024 & 2032
- Figure 12: North America Progressing Cavity Pump Market Revenue (Million), by Power Rating 2024 & 2032
- Figure 13: North America Progressing Cavity Pump Market Revenue Share (%), by Power Rating 2024 & 2032
- Figure 14: North America Progressing Cavity Pump Market Revenue (Million), by End-User Vertical 2024 & 2032
- Figure 15: North America Progressing Cavity Pump Market Revenue Share (%), by End-User Vertical 2024 & 2032
- Figure 16: North America Progressing Cavity Pump Market Revenue (Million), by Country 2024 & 2032
- Figure 17: North America Progressing Cavity Pump Market Revenue Share (%), by Country 2024 & 2032
- Figure 18: Europe Progressing Cavity Pump Market Revenue (Million), by Power Rating 2024 & 2032
- Figure 19: Europe Progressing Cavity Pump Market Revenue Share (%), by Power Rating 2024 & 2032
- Figure 20: Europe Progressing Cavity Pump Market Revenue (Million), by End-User Vertical 2024 & 2032
- Figure 21: Europe Progressing Cavity Pump Market Revenue Share (%), by End-User Vertical 2024 & 2032
- Figure 22: Europe Progressing Cavity Pump Market Revenue (Million), by Country 2024 & 2032
- Figure 23: Europe Progressing Cavity Pump Market Revenue Share (%), by Country 2024 & 2032
- Figure 24: Asia Pacific Progressing Cavity Pump Market Revenue (Million), by Power Rating 2024 & 2032
- Figure 25: Asia Pacific Progressing Cavity Pump Market Revenue Share (%), by Power Rating 2024 & 2032
- Figure 26: Asia Pacific Progressing Cavity Pump Market Revenue (Million), by End-User Vertical 2024 & 2032
- Figure 27: Asia Pacific Progressing Cavity Pump Market Revenue Share (%), by End-User Vertical 2024 & 2032
- Figure 28: Asia Pacific Progressing Cavity Pump Market Revenue (Million), by Country 2024 & 2032
- Figure 29: Asia Pacific Progressing Cavity Pump Market Revenue Share (%), by Country 2024 & 2032
- Figure 30: Latin America Progressing Cavity Pump Market Revenue (Million), by Power Rating 2024 & 2032
- Figure 31: Latin America Progressing Cavity Pump Market Revenue Share (%), by Power Rating 2024 & 2032
- Figure 32: Latin America Progressing Cavity Pump Market Revenue (Million), by End-User Vertical 2024 & 2032
- Figure 33: Latin America Progressing Cavity Pump Market Revenue Share (%), by End-User Vertical 2024 & 2032
- Figure 34: Latin America Progressing Cavity Pump Market Revenue (Million), by Country 2024 & 2032
- Figure 35: Latin America Progressing Cavity Pump Market Revenue Share (%), by Country 2024 & 2032
- Figure 36: Middle East and Africa Progressing Cavity Pump Market Revenue (Million), by Power Rating 2024 & 2032
- Figure 37: Middle East and Africa Progressing Cavity Pump Market Revenue Share (%), by Power Rating 2024 & 2032
- Figure 38: Middle East and Africa Progressing Cavity Pump Market Revenue (Million), by End-User Vertical 2024 & 2032
- Figure 39: Middle East and Africa Progressing Cavity Pump Market Revenue Share (%), by End-User Vertical 2024 & 2032
- Figure 40: Middle East and Africa Progressing Cavity Pump Market Revenue (Million), by Country 2024 & 2032
- Figure 41: Middle East and Africa Progressing Cavity Pump Market Revenue Share (%), by Country 2024 & 2032
List of Tables
- Table 1: Global Progressing Cavity Pump Market Revenue Million Forecast, by Region 2019 & 2032
- Table 2: Global Progressing Cavity Pump Market Revenue Million Forecast, by Power Rating 2019 & 2032
- Table 3: Global Progressing Cavity Pump Market Revenue Million Forecast, by End-User Vertical 2019 & 2032
- Table 4: Global Progressing Cavity Pump Market Revenue Million Forecast, by Region 2019 & 2032
- Table 5: Global Progressing Cavity Pump Market Revenue Million Forecast, by Country 2019 & 2032
- Table 6: Progressing Cavity Pump Market Revenue (Million) Forecast, by Application 2019 & 2032
- Table 7: Global Progressing Cavity Pump Market Revenue Million Forecast, by Country 2019 & 2032
- Table 8: Progressing Cavity Pump Market Revenue (Million) Forecast, by Application 2019 & 2032
- Table 9: Global Progressing Cavity Pump Market Revenue Million Forecast, by Country 2019 & 2032
- Table 10: Progressing Cavity Pump Market Revenue (Million) Forecast, by Application 2019 & 2032
- Table 11: Global Progressing Cavity Pump Market Revenue Million Forecast, by Country 2019 & 2032
- Table 12: Progressing Cavity Pump Market Revenue (Million) Forecast, by Application 2019 & 2032
- Table 13: Global Progressing Cavity Pump Market Revenue Million Forecast, by Country 2019 & 2032
- Table 14: Progressing Cavity Pump Market Revenue (Million) Forecast, by Application 2019 & 2032
- Table 15: Global Progressing Cavity Pump Market Revenue Million Forecast, by Power Rating 2019 & 2032
- Table 16: Global Progressing Cavity Pump Market Revenue Million Forecast, by End-User Vertical 2019 & 2032
- Table 17: Global Progressing Cavity Pump Market Revenue Million Forecast, by Country 2019 & 2032
- Table 18: Global Progressing Cavity Pump Market Revenue Million Forecast, by Power Rating 2019 & 2032
- Table 19: Global Progressing Cavity Pump Market Revenue Million Forecast, by End-User Vertical 2019 & 2032
- Table 20: Global Progressing Cavity Pump Market Revenue Million Forecast, by Country 2019 & 2032
- Table 21: Global Progressing Cavity Pump Market Revenue Million Forecast, by Power Rating 2019 & 2032
- Table 22: Global Progressing Cavity Pump Market Revenue Million Forecast, by End-User Vertical 2019 & 2032
- Table 23: Global Progressing Cavity Pump Market Revenue Million Forecast, by Country 2019 & 2032
- Table 24: Global Progressing Cavity Pump Market Revenue Million Forecast, by Power Rating 2019 & 2032
- Table 25: Global Progressing Cavity Pump Market Revenue Million Forecast, by End-User Vertical 2019 & 2032
- Table 26: Global Progressing Cavity Pump Market Revenue Million Forecast, by Country 2019 & 2032
- Table 27: Global Progressing Cavity Pump Market Revenue Million Forecast, by Power Rating 2019 & 2032
- Table 28: Global Progressing Cavity Pump Market Revenue Million Forecast, by End-User Vertical 2019 & 2032
- Table 29: Global Progressing Cavity Pump Market Revenue Million Forecast, by Country 2019 & 2032
Frequently Asked Questions
1. What is the projected Compound Annual Growth Rate (CAGR) of the Progressing Cavity Pump Market?
The projected CAGR is approximately 5.80%.
2. Which companies are prominent players in the Progressing Cavity Pump Market?
Key companies in the market include Seepex Inc, Xylem Inc, Weatherford International PLC, ChampionX*List Not Exhaustive, Halliburton Company, National-Oilwell Varco Inc, PCM Group, Schlumberger Limited, NETZSCH Group.
3. What are the main segments of the Progressing Cavity Pump Market?
The market segments include Power Rating, End-User Vertical.
4. Can you provide details about the market size?
The market size is estimated to be USD XX Million as of 2022.
5. What are some drivers contributing to market growth?
Increasing Demand From Water and Wastewater Management Infrastructure Industry Across the World; Suitability for Handling High-viscosity Fluids.
6. What are the notable trends driving market growth?
Waste and Wastewater is Expected to Hold Major Share.
7. Are there any restraints impacting market growth?
High Deployment and Maintenance Cost.
8. Can you provide examples of recent developments in the market?
February 2023: Netzsch Pumps & Systems has announced expanding its production and logistics in East Asia. The production plant relocation in Lanzhou, China, is the leading investment. The "Lanzhou New Plant" project is expanding the Lanzhou site's production and logistics network, strengthening its presence in East Asia, and resulting in a significant rise in the number of pumps manufactured here in Lanzhou each year.
9. What pricing options are available for accessing the report?
Pricing options include single-user, multi-user, and enterprise licenses priced at USD 4750, USD 5250, and USD 8750 respectively.
10. Is the market size provided in terms of value or volume?
The market size is provided in terms of value, measured in Million.
11. Are there any specific market keywords associated with the report?
Yes, the market keyword associated with the report is "Progressing Cavity Pump Market," which aids in identifying and referencing the specific market segment covered.
12. How do I determine which pricing option suits my needs best?
The pricing options vary based on user requirements and access needs. Individual users may opt for single-user licenses, while businesses requiring broader access may choose multi-user or enterprise licenses for cost-effective access to the report.
13. Are there any additional resources or data provided in the Progressing Cavity Pump Market report?
While the report offers comprehensive insights, it's advisable to review the specific contents or supplementary materials provided to ascertain if additional resources or data are available.
14. How can I stay updated on further developments or reports in the Progressing Cavity Pump Market?
To stay informed about further developments, trends, and reports in the Progressing Cavity Pump Market, consider subscribing to industry newsletters, following relevant companies and organizations, or regularly checking reputable industry news sources and publications.
Methodology
Step 1 - Identification of Relevant Samples Size from Population Database


Step 2 - Approaches for Defining Global Market Size (Value, Volume* & Price*)

Note*: In applicable scenarios
Step 3 - Data Sources
Primary Research
- Web Analytics
- Survey Reports
- Research Institute
- Latest Research Reports
- Opinion Leaders
Secondary Research
- Annual Reports
- White Paper
- Latest Press Release
- Industry Association
- Paid Database
- Investor Presentations

Step 4 - Data Triangulation
Involves using different sources of information in order to increase the validity of a study
These sources are likely to be stakeholders in a program - participants, other researchers, program staff, other community members, and so on.
Then we put all data in single framework & apply various statistical tools to find out the dynamic on the market.
During the analysis stage, feedback from the stakeholder groups would be compared to determine areas of agreement as well as areas of divergence


