
Key Insights
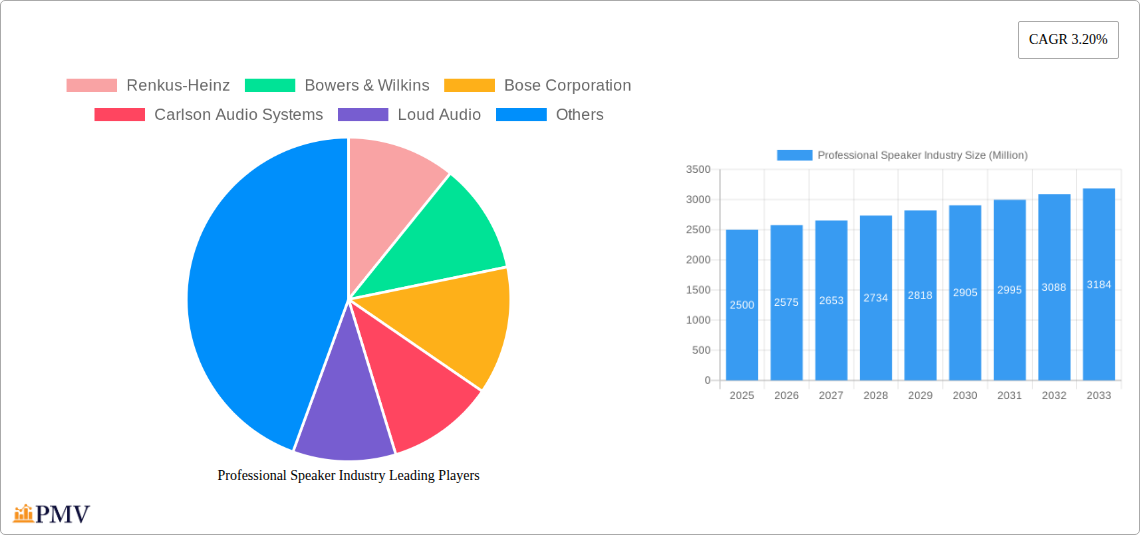
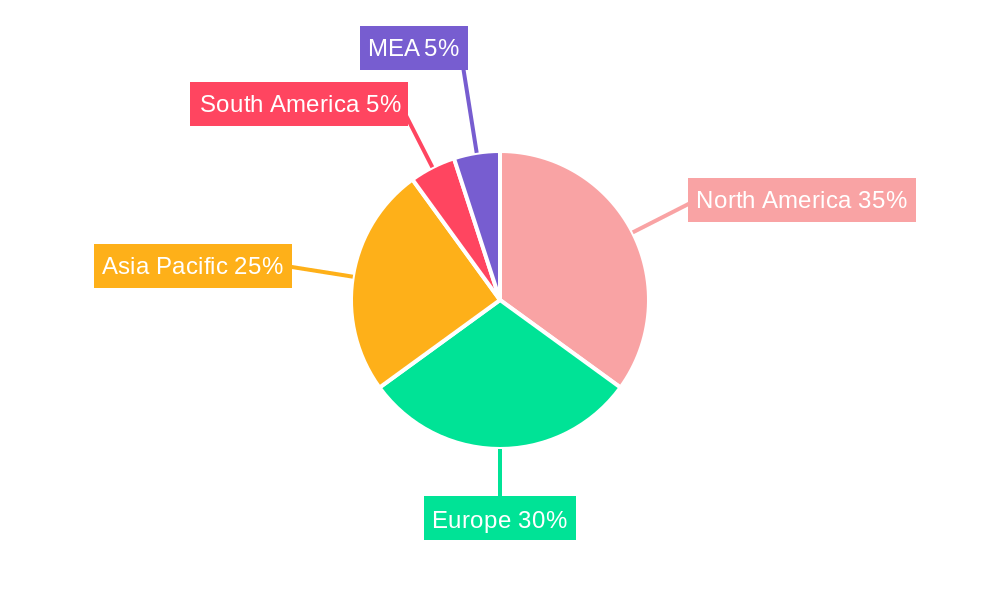
The professional speaker market, valued at approximately $XX million in 2025, is projected to experience steady growth, driven by a compound annual growth rate (CAGR) of 3.20% from 2025 to 2033. This expansion is fueled by several key factors. The increasing popularity of live events, concerts, and corporate presentations necessitates high-quality audio solutions, boosting demand for professional speaker systems. Furthermore, technological advancements, such as the development of more compact and powerful speakers with improved sound clarity and dispersion, are contributing to market growth. The rise of immersive audio experiences in various settings, from stadiums to studios, also fuels demand for sophisticated speaker systems. Growth is further segmented by product type (point source, line arrays, subwoofers), amplification method (passive, powered), and end-user (corporates, venues, educational institutions, etc.). North America and Europe currently dominate the market, but the Asia-Pacific region is expected to witness significant growth due to rising disposable incomes and expanding entertainment industries.
However, certain restraints influence market expansion. High initial investment costs for advanced professional speaker systems can limit adoption, particularly for smaller businesses or organizations. Fluctuations in raw material prices and global economic conditions also pose challenges. Competitive intensity, with established players like Bose, Yamaha, and Harman International alongside emerging brands, also impacts market dynamics. Successfully navigating these challenges will require manufacturers to focus on innovation, cost-effective solutions, and strategic partnerships to reach broader market segments. The trend towards integration with digital audio processing and control systems is likely to shape future market developments. Companies are actively incorporating networkability and smart features to enhance user experience and operational efficiency, a key factor in future market expansion.
Professional Speaker Industry Market Report: 2019-2033
This comprehensive report provides an in-depth analysis of the global professional speaker industry, projecting a market value exceeding $XX Million by 2033. The study covers the period 2019-2033, with 2025 as the base and estimated year. It offers actionable insights for industry stakeholders, including manufacturers, distributors, and end-users. The report meticulously segments the market by product type, amplification method, end-user, and distribution channel, providing a granular understanding of market dynamics and growth potential.
Professional Speaker Industry Market Structure & Competitive Dynamics
The professional speaker market is characterized by a moderately concentrated structure, with several key players holding significant market share. The top ten companies, including Renkus-Heinz, Bowers & Wilkins, Bose Corporation, Carlson Audio Systems, Loud Audio, L-Acoustics, D&B Audiotechnik, Harman International (Samsung), Yamaha Corporation, and Music Group (Music Tribe), collectively account for approximately 60% of the global market in 2025. The remaining market share is distributed among numerous smaller players, fostering a competitive landscape.
Innovation ecosystems play a crucial role, with companies continuously investing in R&D to improve sound quality, durability, and energy efficiency. Regulatory frameworks, particularly concerning safety and environmental standards, influence product design and manufacturing processes. Product substitutes, such as alternative audio technologies, pose a moderate threat, while end-user trends towards immersive audio experiences drive market demand. M&A activities have been relatively moderate in recent years, with a total deal value of approximately $XX Million recorded between 2019 and 2024. Notable deals included [insert specific examples if available, otherwise use “strategic acquisitions focused on expanding product portfolios and geographical reach”].
Professional Speaker Industry Industry Trends & Insights
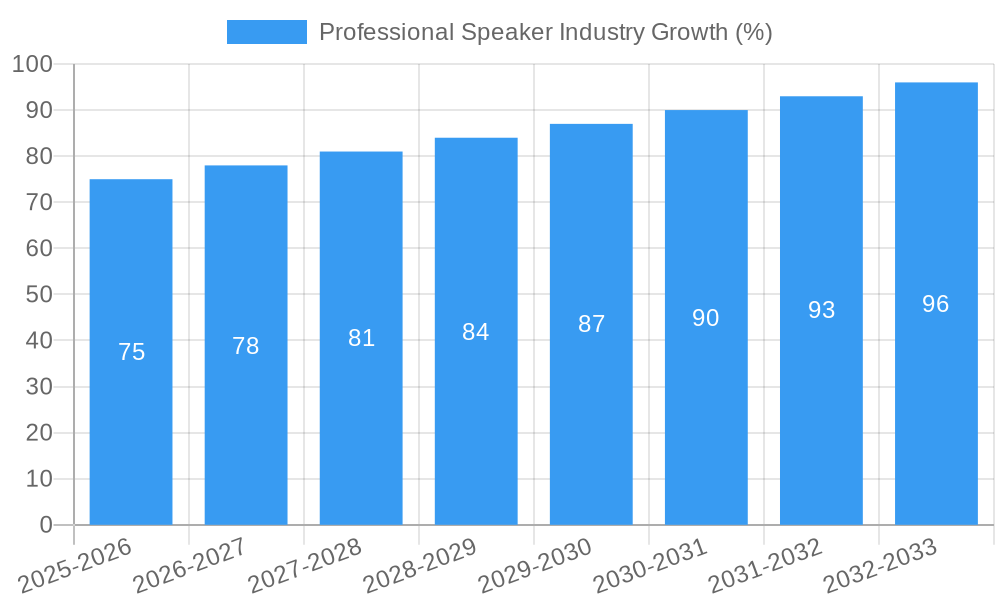
The professional speaker industry is experiencing robust growth, driven by increasing demand across various sectors. The market is projected to exhibit a CAGR of XX% during the forecast period (2025-2033), reaching a value of $XX Million by 2033. This growth is fueled by several factors, including the rising popularity of live events, the expansion of the entertainment industry, and the adoption of advanced audio technologies in corporate settings and educational institutions. Technological advancements, such as the development of higher-fidelity speakers and sophisticated sound processing systems, are further driving market expansion. Market penetration of powered speaker systems is steadily increasing, reflecting a shift towards convenience and ease of use. However, competitive pressures, particularly from emerging players offering cost-effective alternatives, present a challenge for established players. Consumer preferences are shifting towards more compact, versatile, and aesthetically pleasing speakers that seamlessly integrate with modern designs. This trend is pushing manufacturers to innovate and develop products that meet these evolving demands.
Dominant Markets & Segments in Professional Speaker Industry
Leading Region: North America currently holds the largest market share, driven by robust spending in the entertainment and corporate sectors. Key drivers include strong economic growth, well-developed infrastructure, and a high concentration of large-scale events.
Dominant Product Type: Line array speaker systems represent the largest segment, driven by their ability to deliver high-quality sound across large venues.
Leading Amplification Method: Powered speaker systems are gaining traction due to their ease of use and integrated amplification capabilities.
Largest End-User Segment: Large venues & events constitute the most significant end-user segment, followed closely by corporates and educational institutions. Growth in this segment is fueled by increasing demand for high-quality audio experiences.
Primary Distribution Channel: Manufacturing, production, and distribution represent the primary distribution channel, reflecting the dominance of large-scale manufacturers and established distribution networks.
Professional Speaker Industry Product Innovations
Recent product innovations have focused on enhanced sound quality, improved durability, and compact design. Manufacturers are increasingly incorporating advanced technologies such as digital signal processing (DSP) and wireless connectivity into their products. The market is witnessing the emergence of portable, yet powerful, speaker systems designed for ease of transportation and setup, particularly relevant for mobile applications and small-scale events. These developments reflect the ongoing demand for greater versatility and user-friendliness in professional audio equipment.
Report Segmentation & Scope
This report segments the professional speaker market based on product type (point source speaker systems, line array speaker systems, subwoofers, others), amplification method (passive pro speaker systems, powered speaker systems), end-user (corporates, large venues & events, educational institutions, government & military, studio & broadcasting, hospitality, other sectors), and distribution channel (manufacturing, production & distribution, distribution through retail stores, distribution through online websites). Each segment's growth projections, market size, and competitive dynamics are analyzed, providing detailed insights for strategic decision-making. The detailed analysis includes forecast data up to 2033 for each segment, highlighting the expected growth trajectory for various market segments based on their specific characteristics and factors impacting their respective growth potential.
Key Drivers of Professional Speaker Industry Growth
Several factors are driving the growth of the professional speaker industry. Technological advancements, such as the development of higher-fidelity speakers and advanced sound processing systems, are enhancing audio quality and user experience. The expansion of the entertainment industry, coupled with the increasing demand for high-quality audio in corporate settings and educational institutions, contributes significantly to market growth. Government initiatives promoting infrastructure development and cultural events in various regions also contribute to the overall market growth by encouraging investment in professional audio systems.
Challenges in the Professional Speaker Industry Sector
The professional speaker industry faces several challenges, including increasing competition from emerging players, rising raw material costs, and supply chain disruptions. Regulatory hurdles in certain regions pose challenges for market entry and expansion. Furthermore, fluctuations in economic conditions can influence purchasing decisions, potentially slowing down market growth. The industry's competitive landscape requires continuous innovation and cost optimization to remain viable in a constantly evolving environment.
Leading Players in the Professional Speaker Industry Market
- Renkus-Heinz
- Bowers & Wilkins
- Bose Corporation
- Carlson Audio Systems
- Loud Audio
- L-Acoustics
- D&B Audiotechnik
- Harman International (Samsung)
- Yamaha Corporation
- Music Group (Music Tribe)
- Sony Corporation
- B&C Speakers
- K-Array
- Meyer Sound Laboratories
- Nady Systems
- AEB Industriale (DB Technologies)
Key Developments in Professional Speaker Industry Sector
- 2022 Q4: L-Acoustics launched a new line of compact line array speakers.
- 2023 Q1: Harman International acquired a smaller speaker manufacturer, expanding its product portfolio.
- 2023 Q3: Bose Corporation introduced new software updates for its professional speaker systems.
- [Add more relevant developments as needed with specific dates]
Strategic Professional Speaker Industry Market Outlook
The professional speaker market is poised for continued growth, driven by ongoing technological advancements and the increasing demand for high-quality audio across diverse sectors. Strategic opportunities exist for companies that can effectively innovate, adapt to changing consumer preferences, and capitalize on emerging trends such as the increasing adoption of immersive audio technologies. Expansion into new markets and strategic partnerships will be crucial for achieving sustained growth in this dynamic and competitive landscape. The focus on sustainability and environmentally friendly manufacturing processes also represents a crucial aspect for long-term success in the professional speaker market.
Professional Speaker Industry Segmentation
-
1. Product Type
- 1.1. Point Source Speaker System
- 1.2. Line Array Speaker Systems
- 1.3. Subwoofers
- 1.4. Others
-
2. Amplification Method
- 2.1. Passive Pro Speaker Systems
- 2.2. Powered Speaker Systems
-
3. End-User
- 3.1. Corporates
- 3.2. Large Venues & Events
- 3.3. Educational Institutions
- 3.4. Government & Military
- 3.5. Studio & Broadcasting
- 3.6. Hospitality
- 3.7. Other Sectors
-
4. Distribution Channel
- 4.1. Manufacturing, Production, & Distribution
- 4.2. Distribution Through Retail Stores
- 4.3. Distribution Through Online Websites
Professional Speaker Industry Segmentation By Geography
- 1. North America
- 2. Europe
- 3. Asia Pacific
- 4. Middle East and Africa
- 5. Latin America
Professional Speaker Industry REPORT HIGHLIGHTS
| Aspects | Details |
|---|---|
| Study Period | 2019-2033 |
| Base Year | 2024 |
| Estimated Year | 2025 |
| Forecast Period | 2025-2033 |
| Historical Period | 2019-2024 |
| Growth Rate | CAGR of 3.20% from 2019-2033 |
| Segmentation |
|
Table of Contents
- 1. Introduction
- 1.1. Research Scope
- 1.2. Market Segmentation
- 1.3. Research Methodology
- 1.4. Definitions and Assumptions
- 2. Executive Summary
- 2.1. Introduction
- 3. Market Dynamics
- 3.1. Introduction
- 3.2. Market Drivers
- 3.2.1 ; Increased Demand from Corporate
- 3.2.2 Governments
- 3.2.3 and Institutions; Expansion of Live Music Industry; Growth in Music Production and Recording Equipment Market
- 3.3. Market Restrains
- 3.3.1. ; Volatility in Raw Material Costs; Acoustical Challenges
- 3.4. Market Trends
- 3.4.1. Music Production and Recording Equipment to Boost the Growth of the Market
- 4. Market Factor Analysis
- 4.1. Porters Five Forces
- 4.2. Supply/Value Chain
- 4.3. PESTEL analysis
- 4.4. Market Entropy
- 4.5. Patent/Trademark Analysis
- 5. Global Professional Speaker Industry Analysis, Insights and Forecast, 2019-2031
- 5.1. Market Analysis, Insights and Forecast - by Product Type
- 5.1.1. Point Source Speaker System
- 5.1.2. Line Array Speaker Systems
- 5.1.3. Subwoofers
- 5.1.4. Others
- 5.2. Market Analysis, Insights and Forecast - by Amplification Method
- 5.2.1. Passive Pro Speaker Systems
- 5.2.2. Powered Speaker Systems
- 5.3. Market Analysis, Insights and Forecast - by End-User
- 5.3.1. Corporates
- 5.3.2. Large Venues & Events
- 5.3.3. Educational Institutions
- 5.3.4. Government & Military
- 5.3.5. Studio & Broadcasting
- 5.3.6. Hospitality
- 5.3.7. Other Sectors
- 5.4. Market Analysis, Insights and Forecast - by Distribution Channel
- 5.4.1. Manufacturing, Production, & Distribution
- 5.4.2. Distribution Through Retail Stores
- 5.4.3. Distribution Through Online Websites
- 5.5. Market Analysis, Insights and Forecast - by Region
- 5.5.1. North America
- 5.5.2. Europe
- 5.5.3. Asia Pacific
- 5.5.4. Middle East and Africa
- 5.5.5. Latin America
- 5.1. Market Analysis, Insights and Forecast - by Product Type
- 6. North America Professional Speaker Industry Analysis, Insights and Forecast, 2019-2031
- 6.1. Market Analysis, Insights and Forecast - by Product Type
- 6.1.1. Point Source Speaker System
- 6.1.2. Line Array Speaker Systems
- 6.1.3. Subwoofers
- 6.1.4. Others
- 6.2. Market Analysis, Insights and Forecast - by Amplification Method
- 6.2.1. Passive Pro Speaker Systems
- 6.2.2. Powered Speaker Systems
- 6.3. Market Analysis, Insights and Forecast - by End-User
- 6.3.1. Corporates
- 6.3.2. Large Venues & Events
- 6.3.3. Educational Institutions
- 6.3.4. Government & Military
- 6.3.5. Studio & Broadcasting
- 6.3.6. Hospitality
- 6.3.7. Other Sectors
- 6.4. Market Analysis, Insights and Forecast - by Distribution Channel
- 6.4.1. Manufacturing, Production, & Distribution
- 6.4.2. Distribution Through Retail Stores
- 6.4.3. Distribution Through Online Websites
- 6.1. Market Analysis, Insights and Forecast - by Product Type
- 7. Europe Professional Speaker Industry Analysis, Insights and Forecast, 2019-2031
- 7.1. Market Analysis, Insights and Forecast - by Product Type
- 7.1.1. Point Source Speaker System
- 7.1.2. Line Array Speaker Systems
- 7.1.3. Subwoofers
- 7.1.4. Others
- 7.2. Market Analysis, Insights and Forecast - by Amplification Method
- 7.2.1. Passive Pro Speaker Systems
- 7.2.2. Powered Speaker Systems
- 7.3. Market Analysis, Insights and Forecast - by End-User
- 7.3.1. Corporates
- 7.3.2. Large Venues & Events
- 7.3.3. Educational Institutions
- 7.3.4. Government & Military
- 7.3.5. Studio & Broadcasting
- 7.3.6. Hospitality
- 7.3.7. Other Sectors
- 7.4. Market Analysis, Insights and Forecast - by Distribution Channel
- 7.4.1. Manufacturing, Production, & Distribution
- 7.4.2. Distribution Through Retail Stores
- 7.4.3. Distribution Through Online Websites
- 7.1. Market Analysis, Insights and Forecast - by Product Type
- 8. Asia Pacific Professional Speaker Industry Analysis, Insights and Forecast, 2019-2031
- 8.1. Market Analysis, Insights and Forecast - by Product Type
- 8.1.1. Point Source Speaker System
- 8.1.2. Line Array Speaker Systems
- 8.1.3. Subwoofers
- 8.1.4. Others
- 8.2. Market Analysis, Insights and Forecast - by Amplification Method
- 8.2.1. Passive Pro Speaker Systems
- 8.2.2. Powered Speaker Systems
- 8.3. Market Analysis, Insights and Forecast - by End-User
- 8.3.1. Corporates
- 8.3.2. Large Venues & Events
- 8.3.3. Educational Institutions
- 8.3.4. Government & Military
- 8.3.5. Studio & Broadcasting
- 8.3.6. Hospitality
- 8.3.7. Other Sectors
- 8.4. Market Analysis, Insights and Forecast - by Distribution Channel
- 8.4.1. Manufacturing, Production, & Distribution
- 8.4.2. Distribution Through Retail Stores
- 8.4.3. Distribution Through Online Websites
- 8.1. Market Analysis, Insights and Forecast - by Product Type
- 9. Middle East and Africa Professional Speaker Industry Analysis, Insights and Forecast, 2019-2031
- 9.1. Market Analysis, Insights and Forecast - by Product Type
- 9.1.1. Point Source Speaker System
- 9.1.2. Line Array Speaker Systems
- 9.1.3. Subwoofers
- 9.1.4. Others
- 9.2. Market Analysis, Insights and Forecast - by Amplification Method
- 9.2.1. Passive Pro Speaker Systems
- 9.2.2. Powered Speaker Systems
- 9.3. Market Analysis, Insights and Forecast - by End-User
- 9.3.1. Corporates
- 9.3.2. Large Venues & Events
- 9.3.3. Educational Institutions
- 9.3.4. Government & Military
- 9.3.5. Studio & Broadcasting
- 9.3.6. Hospitality
- 9.3.7. Other Sectors
- 9.4. Market Analysis, Insights and Forecast - by Distribution Channel
- 9.4.1. Manufacturing, Production, & Distribution
- 9.4.2. Distribution Through Retail Stores
- 9.4.3. Distribution Through Online Websites
- 9.1. Market Analysis, Insights and Forecast - by Product Type
- 10. Latin America Professional Speaker Industry Analysis, Insights and Forecast, 2019-2031
- 10.1. Market Analysis, Insights and Forecast - by Product Type
- 10.1.1. Point Source Speaker System
- 10.1.2. Line Array Speaker Systems
- 10.1.3. Subwoofers
- 10.1.4. Others
- 10.2. Market Analysis, Insights and Forecast - by Amplification Method
- 10.2.1. Passive Pro Speaker Systems
- 10.2.2. Powered Speaker Systems
- 10.3. Market Analysis, Insights and Forecast - by End-User
- 10.3.1. Corporates
- 10.3.2. Large Venues & Events
- 10.3.3. Educational Institutions
- 10.3.4. Government & Military
- 10.3.5. Studio & Broadcasting
- 10.3.6. Hospitality
- 10.3.7. Other Sectors
- 10.4. Market Analysis, Insights and Forecast - by Distribution Channel
- 10.4.1. Manufacturing, Production, & Distribution
- 10.4.2. Distribution Through Retail Stores
- 10.4.3. Distribution Through Online Websites
- 10.1. Market Analysis, Insights and Forecast - by Product Type
- 11. North America Professional Speaker Industry Analysis, Insights and Forecast, 2019-2031
- 11.1. Market Analysis, Insights and Forecast - By Country/Sub-region
- 11.1.1 United States
- 11.1.2 Canada
- 11.1.3 Mexico
- 12. Europe Professional Speaker Industry Analysis, Insights and Forecast, 2019-2031
- 12.1. Market Analysis, Insights and Forecast - By Country/Sub-region
- 12.1.1 Germany
- 12.1.2 United Kingdom
- 12.1.3 France
- 12.1.4 Spain
- 12.1.5 Italy
- 12.1.6 Spain
- 12.1.7 Belgium
- 12.1.8 Netherland
- 12.1.9 Nordics
- 12.1.10 Rest of Europe
- 13. Asia Pacific Professional Speaker Industry Analysis, Insights and Forecast, 2019-2031
- 13.1. Market Analysis, Insights and Forecast - By Country/Sub-region
- 13.1.1 China
- 13.1.2 Japan
- 13.1.3 India
- 13.1.4 South Korea
- 13.1.5 Southeast Asia
- 13.1.6 Australia
- 13.1.7 Indonesia
- 13.1.8 Phillipes
- 13.1.9 Singapore
- 13.1.10 Thailandc
- 13.1.11 Rest of Asia Pacific
- 14. South America Professional Speaker Industry Analysis, Insights and Forecast, 2019-2031
- 14.1. Market Analysis, Insights and Forecast - By Country/Sub-region
- 14.1.1 Brazil
- 14.1.2 Argentina
- 14.1.3 Peru
- 14.1.4 Chile
- 14.1.5 Colombia
- 14.1.6 Ecuador
- 14.1.7 Venezuela
- 14.1.8 Rest of South America
- 15. North America Professional Speaker Industry Analysis, Insights and Forecast, 2019-2031
- 15.1. Market Analysis, Insights and Forecast - By Country/Sub-region
- 15.1.1 United States
- 15.1.2 Canada
- 15.1.3 Mexico
- 16. MEA Professional Speaker Industry Analysis, Insights and Forecast, 2019-2031
- 16.1. Market Analysis, Insights and Forecast - By Country/Sub-region
- 16.1.1 United Arab Emirates
- 16.1.2 Saudi Arabia
- 16.1.3 South Africa
- 16.1.4 Rest of Middle East and Africa
- 17. Competitive Analysis
- 17.1. Global Market Share Analysis 2024
- 17.2. Company Profiles
- 17.2.1 Renkus-Heinz
- 17.2.1.1. Overview
- 17.2.1.2. Products
- 17.2.1.3. SWOT Analysis
- 17.2.1.4. Recent Developments
- 17.2.1.5. Financials (Based on Availability)
- 17.2.2 Bowers & Wilkins
- 17.2.2.1. Overview
- 17.2.2.2. Products
- 17.2.2.3. SWOT Analysis
- 17.2.2.4. Recent Developments
- 17.2.2.5. Financials (Based on Availability)
- 17.2.3 Bose Corporation
- 17.2.3.1. Overview
- 17.2.3.2. Products
- 17.2.3.3. SWOT Analysis
- 17.2.3.4. Recent Developments
- 17.2.3.5. Financials (Based on Availability)
- 17.2.4 Carlson Audio Systems
- 17.2.4.1. Overview
- 17.2.4.2. Products
- 17.2.4.3. SWOT Analysis
- 17.2.4.4. Recent Developments
- 17.2.4.5. Financials (Based on Availability)
- 17.2.5 Loud Audio
- 17.2.5.1. Overview
- 17.2.5.2. Products
- 17.2.5.3. SWOT Analysis
- 17.2.5.4. Recent Developments
- 17.2.5.5. Financials (Based on Availability)
- 17.2.6 L-Acoustics
- 17.2.6.1. Overview
- 17.2.6.2. Products
- 17.2.6.3. SWOT Analysis
- 17.2.6.4. Recent Developments
- 17.2.6.5. Financials (Based on Availability)
- 17.2.7 D&B Audiotechnik
- 17.2.7.1. Overview
- 17.2.7.2. Products
- 17.2.7.3. SWOT Analysis
- 17.2.7.4. Recent Developments
- 17.2.7.5. Financials (Based on Availability)
- 17.2.8 Harman International (Samsung)
- 17.2.8.1. Overview
- 17.2.8.2. Products
- 17.2.8.3. SWOT Analysis
- 17.2.8.4. Recent Developments
- 17.2.8.5. Financials (Based on Availability)
- 17.2.9 Yamaha Corporation
- 17.2.9.1. Overview
- 17.2.9.2. Products
- 17.2.9.3. SWOT Analysis
- 17.2.9.4. Recent Developments
- 17.2.9.5. Financials (Based on Availability)
- 17.2.10 Music Group (Music Tribe)
- 17.2.10.1. Overview
- 17.2.10.2. Products
- 17.2.10.3. SWOT Analysis
- 17.2.10.4. Recent Developments
- 17.2.10.5. Financials (Based on Availability)
- 17.2.11 Sony Corporation
- 17.2.11.1. Overview
- 17.2.11.2. Products
- 17.2.11.3. SWOT Analysis
- 17.2.11.4. Recent Developments
- 17.2.11.5. Financials (Based on Availability)
- 17.2.12 B&C Speakers
- 17.2.12.1. Overview
- 17.2.12.2. Products
- 17.2.12.3. SWOT Analysis
- 17.2.12.4. Recent Developments
- 17.2.12.5. Financials (Based on Availability)
- 17.2.13 K-Array
- 17.2.13.1. Overview
- 17.2.13.2. Products
- 17.2.13.3. SWOT Analysis
- 17.2.13.4. Recent Developments
- 17.2.13.5. Financials (Based on Availability)
- 17.2.14 Meyer Sound Laboratories
- 17.2.14.1. Overview
- 17.2.14.2. Products
- 17.2.14.3. SWOT Analysis
- 17.2.14.4. Recent Developments
- 17.2.14.5. Financials (Based on Availability)
- 17.2.15 Nady Systems
- 17.2.15.1. Overview
- 17.2.15.2. Products
- 17.2.15.3. SWOT Analysis
- 17.2.15.4. Recent Developments
- 17.2.15.5. Financials (Based on Availability)
- 17.2.16 AEB Industriale (DB Technologies)
- 17.2.16.1. Overview
- 17.2.16.2. Products
- 17.2.16.3. SWOT Analysis
- 17.2.16.4. Recent Developments
- 17.2.16.5. Financials (Based on Availability)
- 17.2.1 Renkus-Heinz
List of Figures
- Figure 1: Global Professional Speaker Industry Revenue Breakdown (Million, %) by Region 2024 & 2032
- Figure 2: Global Professional Speaker Industry Volume Breakdown (K Unit, %) by Region 2024 & 2032
- Figure 3: North America Professional Speaker Industry Revenue (Million), by Country 2024 & 2032
- Figure 4: North America Professional Speaker Industry Volume (K Unit), by Country 2024 & 2032
- Figure 5: North America Professional Speaker Industry Revenue Share (%), by Country 2024 & 2032
- Figure 6: North America Professional Speaker Industry Volume Share (%), by Country 2024 & 2032
- Figure 7: Europe Professional Speaker Industry Revenue (Million), by Country 2024 & 2032
- Figure 8: Europe Professional Speaker Industry Volume (K Unit), by Country 2024 & 2032
- Figure 9: Europe Professional Speaker Industry Revenue Share (%), by Country 2024 & 2032
- Figure 10: Europe Professional Speaker Industry Volume Share (%), by Country 2024 & 2032
- Figure 11: Asia Pacific Professional Speaker Industry Revenue (Million), by Country 2024 & 2032
- Figure 12: Asia Pacific Professional Speaker Industry Volume (K Unit), by Country 2024 & 2032
- Figure 13: Asia Pacific Professional Speaker Industry Revenue Share (%), by Country 2024 & 2032
- Figure 14: Asia Pacific Professional Speaker Industry Volume Share (%), by Country 2024 & 2032
- Figure 15: South America Professional Speaker Industry Revenue (Million), by Country 2024 & 2032
- Figure 16: South America Professional Speaker Industry Volume (K Unit), by Country 2024 & 2032
- Figure 17: South America Professional Speaker Industry Revenue Share (%), by Country 2024 & 2032
- Figure 18: South America Professional Speaker Industry Volume Share (%), by Country 2024 & 2032
- Figure 19: North America Professional Speaker Industry Revenue (Million), by Country 2024 & 2032
- Figure 20: North America Professional Speaker Industry Volume (K Unit), by Country 2024 & 2032
- Figure 21: North America Professional Speaker Industry Revenue Share (%), by Country 2024 & 2032
- Figure 22: North America Professional Speaker Industry Volume Share (%), by Country 2024 & 2032
- Figure 23: MEA Professional Speaker Industry Revenue (Million), by Country 2024 & 2032
- Figure 24: MEA Professional Speaker Industry Volume (K Unit), by Country 2024 & 2032
- Figure 25: MEA Professional Speaker Industry Revenue Share (%), by Country 2024 & 2032
- Figure 26: MEA Professional Speaker Industry Volume Share (%), by Country 2024 & 2032
- Figure 27: North America Professional Speaker Industry Revenue (Million), by Product Type 2024 & 2032
- Figure 28: North America Professional Speaker Industry Volume (K Unit), by Product Type 2024 & 2032
- Figure 29: North America Professional Speaker Industry Revenue Share (%), by Product Type 2024 & 2032
- Figure 30: North America Professional Speaker Industry Volume Share (%), by Product Type 2024 & 2032
- Figure 31: North America Professional Speaker Industry Revenue (Million), by Amplification Method 2024 & 2032
- Figure 32: North America Professional Speaker Industry Volume (K Unit), by Amplification Method 2024 & 2032
- Figure 33: North America Professional Speaker Industry Revenue Share (%), by Amplification Method 2024 & 2032
- Figure 34: North America Professional Speaker Industry Volume Share (%), by Amplification Method 2024 & 2032
- Figure 35: North America Professional Speaker Industry Revenue (Million), by End-User 2024 & 2032
- Figure 36: North America Professional Speaker Industry Volume (K Unit), by End-User 2024 & 2032
- Figure 37: North America Professional Speaker Industry Revenue Share (%), by End-User 2024 & 2032
- Figure 38: North America Professional Speaker Industry Volume Share (%), by End-User 2024 & 2032
- Figure 39: North America Professional Speaker Industry Revenue (Million), by Distribution Channel 2024 & 2032
- Figure 40: North America Professional Speaker Industry Volume (K Unit), by Distribution Channel 2024 & 2032
- Figure 41: North America Professional Speaker Industry Revenue Share (%), by Distribution Channel 2024 & 2032
- Figure 42: North America Professional Speaker Industry Volume Share (%), by Distribution Channel 2024 & 2032
- Figure 43: North America Professional Speaker Industry Revenue (Million), by Country 2024 & 2032
- Figure 44: North America Professional Speaker Industry Volume (K Unit), by Country 2024 & 2032
- Figure 45: North America Professional Speaker Industry Revenue Share (%), by Country 2024 & 2032
- Figure 46: North America Professional Speaker Industry Volume Share (%), by Country 2024 & 2032
- Figure 47: Europe Professional Speaker Industry Revenue (Million), by Product Type 2024 & 2032
- Figure 48: Europe Professional Speaker Industry Volume (K Unit), by Product Type 2024 & 2032
- Figure 49: Europe Professional Speaker Industry Revenue Share (%), by Product Type 2024 & 2032
- Figure 50: Europe Professional Speaker Industry Volume Share (%), by Product Type 2024 & 2032
- Figure 51: Europe Professional Speaker Industry Revenue (Million), by Amplification Method 2024 & 2032
- Figure 52: Europe Professional Speaker Industry Volume (K Unit), by Amplification Method 2024 & 2032
- Figure 53: Europe Professional Speaker Industry Revenue Share (%), by Amplification Method 2024 & 2032
- Figure 54: Europe Professional Speaker Industry Volume Share (%), by Amplification Method 2024 & 2032
- Figure 55: Europe Professional Speaker Industry Revenue (Million), by End-User 2024 & 2032
- Figure 56: Europe Professional Speaker Industry Volume (K Unit), by End-User 2024 & 2032
- Figure 57: Europe Professional Speaker Industry Revenue Share (%), by End-User 2024 & 2032
- Figure 58: Europe Professional Speaker Industry Volume Share (%), by End-User 2024 & 2032
- Figure 59: Europe Professional Speaker Industry Revenue (Million), by Distribution Channel 2024 & 2032
- Figure 60: Europe Professional Speaker Industry Volume (K Unit), by Distribution Channel 2024 & 2032
- Figure 61: Europe Professional Speaker Industry Revenue Share (%), by Distribution Channel 2024 & 2032
- Figure 62: Europe Professional Speaker Industry Volume Share (%), by Distribution Channel 2024 & 2032
- Figure 63: Europe Professional Speaker Industry Revenue (Million), by Country 2024 & 2032
- Figure 64: Europe Professional Speaker Industry Volume (K Unit), by Country 2024 & 2032
- Figure 65: Europe Professional Speaker Industry Revenue Share (%), by Country 2024 & 2032
- Figure 66: Europe Professional Speaker Industry Volume Share (%), by Country 2024 & 2032
- Figure 67: Asia Pacific Professional Speaker Industry Revenue (Million), by Product Type 2024 & 2032
- Figure 68: Asia Pacific Professional Speaker Industry Volume (K Unit), by Product Type 2024 & 2032
- Figure 69: Asia Pacific Professional Speaker Industry Revenue Share (%), by Product Type 2024 & 2032
- Figure 70: Asia Pacific Professional Speaker Industry Volume Share (%), by Product Type 2024 & 2032
- Figure 71: Asia Pacific Professional Speaker Industry Revenue (Million), by Amplification Method 2024 & 2032
- Figure 72: Asia Pacific Professional Speaker Industry Volume (K Unit), by Amplification Method 2024 & 2032
- Figure 73: Asia Pacific Professional Speaker Industry Revenue Share (%), by Amplification Method 2024 & 2032
- Figure 74: Asia Pacific Professional Speaker Industry Volume Share (%), by Amplification Method 2024 & 2032
- Figure 75: Asia Pacific Professional Speaker Industry Revenue (Million), by End-User 2024 & 2032
- Figure 76: Asia Pacific Professional Speaker Industry Volume (K Unit), by End-User 2024 & 2032
- Figure 77: Asia Pacific Professional Speaker Industry Revenue Share (%), by End-User 2024 & 2032
- Figure 78: Asia Pacific Professional Speaker Industry Volume Share (%), by End-User 2024 & 2032
- Figure 79: Asia Pacific Professional Speaker Industry Revenue (Million), by Distribution Channel 2024 & 2032
- Figure 80: Asia Pacific Professional Speaker Industry Volume (K Unit), by Distribution Channel 2024 & 2032
- Figure 81: Asia Pacific Professional Speaker Industry Revenue Share (%), by Distribution Channel 2024 & 2032
- Figure 82: Asia Pacific Professional Speaker Industry Volume Share (%), by Distribution Channel 2024 & 2032
- Figure 83: Asia Pacific Professional Speaker Industry Revenue (Million), by Country 2024 & 2032
- Figure 84: Asia Pacific Professional Speaker Industry Volume (K Unit), by Country 2024 & 2032
- Figure 85: Asia Pacific Professional Speaker Industry Revenue Share (%), by Country 2024 & 2032
- Figure 86: Asia Pacific Professional Speaker Industry Volume Share (%), by Country 2024 & 2032
- Figure 87: Middle East and Africa Professional Speaker Industry Revenue (Million), by Product Type 2024 & 2032
- Figure 88: Middle East and Africa Professional Speaker Industry Volume (K Unit), by Product Type 2024 & 2032
- Figure 89: Middle East and Africa Professional Speaker Industry Revenue Share (%), by Product Type 2024 & 2032
- Figure 90: Middle East and Africa Professional Speaker Industry Volume Share (%), by Product Type 2024 & 2032
- Figure 91: Middle East and Africa Professional Speaker Industry Revenue (Million), by Amplification Method 2024 & 2032
- Figure 92: Middle East and Africa Professional Speaker Industry Volume (K Unit), by Amplification Method 2024 & 2032
- Figure 93: Middle East and Africa Professional Speaker Industry Revenue Share (%), by Amplification Method 2024 & 2032
- Figure 94: Middle East and Africa Professional Speaker Industry Volume Share (%), by Amplification Method 2024 & 2032
- Figure 95: Middle East and Africa Professional Speaker Industry Revenue (Million), by End-User 2024 & 2032
- Figure 96: Middle East and Africa Professional Speaker Industry Volume (K Unit), by End-User 2024 & 2032
- Figure 97: Middle East and Africa Professional Speaker Industry Revenue Share (%), by End-User 2024 & 2032
- Figure 98: Middle East and Africa Professional Speaker Industry Volume Share (%), by End-User 2024 & 2032
- Figure 99: Middle East and Africa Professional Speaker Industry Revenue (Million), by Distribution Channel 2024 & 2032
- Figure 100: Middle East and Africa Professional Speaker Industry Volume (K Unit), by Distribution Channel 2024 & 2032
- Figure 101: Middle East and Africa Professional Speaker Industry Revenue Share (%), by Distribution Channel 2024 & 2032
- Figure 102: Middle East and Africa Professional Speaker Industry Volume Share (%), by Distribution Channel 2024 & 2032
- Figure 103: Middle East and Africa Professional Speaker Industry Revenue (Million), by Country 2024 & 2032
- Figure 104: Middle East and Africa Professional Speaker Industry Volume (K Unit), by Country 2024 & 2032
- Figure 105: Middle East and Africa Professional Speaker Industry Revenue Share (%), by Country 2024 & 2032
- Figure 106: Middle East and Africa Professional Speaker Industry Volume Share (%), by Country 2024 & 2032
- Figure 107: Latin America Professional Speaker Industry Revenue (Million), by Product Type 2024 & 2032
- Figure 108: Latin America Professional Speaker Industry Volume (K Unit), by Product Type 2024 & 2032
- Figure 109: Latin America Professional Speaker Industry Revenue Share (%), by Product Type 2024 & 2032
- Figure 110: Latin America Professional Speaker Industry Volume Share (%), by Product Type 2024 & 2032
- Figure 111: Latin America Professional Speaker Industry Revenue (Million), by Amplification Method 2024 & 2032
- Figure 112: Latin America Professional Speaker Industry Volume (K Unit), by Amplification Method 2024 & 2032
- Figure 113: Latin America Professional Speaker Industry Revenue Share (%), by Amplification Method 2024 & 2032
- Figure 114: Latin America Professional Speaker Industry Volume Share (%), by Amplification Method 2024 & 2032
- Figure 115: Latin America Professional Speaker Industry Revenue (Million), by End-User 2024 & 2032
- Figure 116: Latin America Professional Speaker Industry Volume (K Unit), by End-User 2024 & 2032
- Figure 117: Latin America Professional Speaker Industry Revenue Share (%), by End-User 2024 & 2032
- Figure 118: Latin America Professional Speaker Industry Volume Share (%), by End-User 2024 & 2032
- Figure 119: Latin America Professional Speaker Industry Revenue (Million), by Distribution Channel 2024 & 2032
- Figure 120: Latin America Professional Speaker Industry Volume (K Unit), by Distribution Channel 2024 & 2032
- Figure 121: Latin America Professional Speaker Industry Revenue Share (%), by Distribution Channel 2024 & 2032
- Figure 122: Latin America Professional Speaker Industry Volume Share (%), by Distribution Channel 2024 & 2032
- Figure 123: Latin America Professional Speaker Industry Revenue (Million), by Country 2024 & 2032
- Figure 124: Latin America Professional Speaker Industry Volume (K Unit), by Country 2024 & 2032
- Figure 125: Latin America Professional Speaker Industry Revenue Share (%), by Country 2024 & 2032
- Figure 126: Latin America Professional Speaker Industry Volume Share (%), by Country 2024 & 2032
List of Tables
- Table 1: Global Professional Speaker Industry Revenue Million Forecast, by Region 2019 & 2032
- Table 2: Global Professional Speaker Industry Volume K Unit Forecast, by Region 2019 & 2032
- Table 3: Global Professional Speaker Industry Revenue Million Forecast, by Product Type 2019 & 2032
- Table 4: Global Professional Speaker Industry Volume K Unit Forecast, by Product Type 2019 & 2032
- Table 5: Global Professional Speaker Industry Revenue Million Forecast, by Amplification Method 2019 & 2032
- Table 6: Global Professional Speaker Industry Volume K Unit Forecast, by Amplification Method 2019 & 2032
- Table 7: Global Professional Speaker Industry Revenue Million Forecast, by End-User 2019 & 2032
- Table 8: Global Professional Speaker Industry Volume K Unit Forecast, by End-User 2019 & 2032
- Table 9: Global Professional Speaker Industry Revenue Million Forecast, by Distribution Channel 2019 & 2032
- Table 10: Global Professional Speaker Industry Volume K Unit Forecast, by Distribution Channel 2019 & 2032
- Table 11: Global Professional Speaker Industry Revenue Million Forecast, by Region 2019 & 2032
- Table 12: Global Professional Speaker Industry Volume K Unit Forecast, by Region 2019 & 2032
- Table 13: Global Professional Speaker Industry Revenue Million Forecast, by Country 2019 & 2032
- Table 14: Global Professional Speaker Industry Volume K Unit Forecast, by Country 2019 & 2032
- Table 15: United States Professional Speaker Industry Revenue (Million) Forecast, by Application 2019 & 2032
- Table 16: United States Professional Speaker Industry Volume (K Unit) Forecast, by Application 2019 & 2032
- Table 17: Canada Professional Speaker Industry Revenue (Million) Forecast, by Application 2019 & 2032
- Table 18: Canada Professional Speaker Industry Volume (K Unit) Forecast, by Application 2019 & 2032
- Table 19: Mexico Professional Speaker Industry Revenue (Million) Forecast, by Application 2019 & 2032
- Table 20: Mexico Professional Speaker Industry Volume (K Unit) Forecast, by Application 2019 & 2032
- Table 21: Global Professional Speaker Industry Revenue Million Forecast, by Country 2019 & 2032
- Table 22: Global Professional Speaker Industry Volume K Unit Forecast, by Country 2019 & 2032
- Table 23: Germany Professional Speaker Industry Revenue (Million) Forecast, by Application 2019 & 2032
- Table 24: Germany Professional Speaker Industry Volume (K Unit) Forecast, by Application 2019 & 2032
- Table 25: United Kingdom Professional Speaker Industry Revenue (Million) Forecast, by Application 2019 & 2032
- Table 26: United Kingdom Professional Speaker Industry Volume (K Unit) Forecast, by Application 2019 & 2032
- Table 27: France Professional Speaker Industry Revenue (Million) Forecast, by Application 2019 & 2032
- Table 28: France Professional Speaker Industry Volume (K Unit) Forecast, by Application 2019 & 2032
- Table 29: Spain Professional Speaker Industry Revenue (Million) Forecast, by Application 2019 & 2032
- Table 30: Spain Professional Speaker Industry Volume (K Unit) Forecast, by Application 2019 & 2032
- Table 31: Italy Professional Speaker Industry Revenue (Million) Forecast, by Application 2019 & 2032
- Table 32: Italy Professional Speaker Industry Volume (K Unit) Forecast, by Application 2019 & 2032
- Table 33: Spain Professional Speaker Industry Revenue (Million) Forecast, by Application 2019 & 2032
- Table 34: Spain Professional Speaker Industry Volume (K Unit) Forecast, by Application 2019 & 2032
- Table 35: Belgium Professional Speaker Industry Revenue (Million) Forecast, by Application 2019 & 2032
- Table 36: Belgium Professional Speaker Industry Volume (K Unit) Forecast, by Application 2019 & 2032
- Table 37: Netherland Professional Speaker Industry Revenue (Million) Forecast, by Application 2019 & 2032
- Table 38: Netherland Professional Speaker Industry Volume (K Unit) Forecast, by Application 2019 & 2032
- Table 39: Nordics Professional Speaker Industry Revenue (Million) Forecast, by Application 2019 & 2032
- Table 40: Nordics Professional Speaker Industry Volume (K Unit) Forecast, by Application 2019 & 2032
- Table 41: Rest of Europe Professional Speaker Industry Revenue (Million) Forecast, by Application 2019 & 2032
- Table 42: Rest of Europe Professional Speaker Industry Volume (K Unit) Forecast, by Application 2019 & 2032
- Table 43: Global Professional Speaker Industry Revenue Million Forecast, by Country 2019 & 2032
- Table 44: Global Professional Speaker Industry Volume K Unit Forecast, by Country 2019 & 2032
- Table 45: China Professional Speaker Industry Revenue (Million) Forecast, by Application 2019 & 2032
- Table 46: China Professional Speaker Industry Volume (K Unit) Forecast, by Application 2019 & 2032
- Table 47: Japan Professional Speaker Industry Revenue (Million) Forecast, by Application 2019 & 2032
- Table 48: Japan Professional Speaker Industry Volume (K Unit) Forecast, by Application 2019 & 2032
- Table 49: India Professional Speaker Industry Revenue (Million) Forecast, by Application 2019 & 2032
- Table 50: India Professional Speaker Industry Volume (K Unit) Forecast, by Application 2019 & 2032
- Table 51: South Korea Professional Speaker Industry Revenue (Million) Forecast, by Application 2019 & 2032
- Table 52: South Korea Professional Speaker Industry Volume (K Unit) Forecast, by Application 2019 & 2032
- Table 53: Southeast Asia Professional Speaker Industry Revenue (Million) Forecast, by Application 2019 & 2032
- Table 54: Southeast Asia Professional Speaker Industry Volume (K Unit) Forecast, by Application 2019 & 2032
- Table 55: Australia Professional Speaker Industry Revenue (Million) Forecast, by Application 2019 & 2032
- Table 56: Australia Professional Speaker Industry Volume (K Unit) Forecast, by Application 2019 & 2032
- Table 57: Indonesia Professional Speaker Industry Revenue (Million) Forecast, by Application 2019 & 2032
- Table 58: Indonesia Professional Speaker Industry Volume (K Unit) Forecast, by Application 2019 & 2032
- Table 59: Phillipes Professional Speaker Industry Revenue (Million) Forecast, by Application 2019 & 2032
- Table 60: Phillipes Professional Speaker Industry Volume (K Unit) Forecast, by Application 2019 & 2032
- Table 61: Singapore Professional Speaker Industry Revenue (Million) Forecast, by Application 2019 & 2032
- Table 62: Singapore Professional Speaker Industry Volume (K Unit) Forecast, by Application 2019 & 2032
- Table 63: Thailandc Professional Speaker Industry Revenue (Million) Forecast, by Application 2019 & 2032
- Table 64: Thailandc Professional Speaker Industry Volume (K Unit) Forecast, by Application 2019 & 2032
- Table 65: Rest of Asia Pacific Professional Speaker Industry Revenue (Million) Forecast, by Application 2019 & 2032
- Table 66: Rest of Asia Pacific Professional Speaker Industry Volume (K Unit) Forecast, by Application 2019 & 2032
- Table 67: Global Professional Speaker Industry Revenue Million Forecast, by Country 2019 & 2032
- Table 68: Global Professional Speaker Industry Volume K Unit Forecast, by Country 2019 & 2032
- Table 69: Brazil Professional Speaker Industry Revenue (Million) Forecast, by Application 2019 & 2032
- Table 70: Brazil Professional Speaker Industry Volume (K Unit) Forecast, by Application 2019 & 2032
- Table 71: Argentina Professional Speaker Industry Revenue (Million) Forecast, by Application 2019 & 2032
- Table 72: Argentina Professional Speaker Industry Volume (K Unit) Forecast, by Application 2019 & 2032
- Table 73: Peru Professional Speaker Industry Revenue (Million) Forecast, by Application 2019 & 2032
- Table 74: Peru Professional Speaker Industry Volume (K Unit) Forecast, by Application 2019 & 2032
- Table 75: Chile Professional Speaker Industry Revenue (Million) Forecast, by Application 2019 & 2032
- Table 76: Chile Professional Speaker Industry Volume (K Unit) Forecast, by Application 2019 & 2032
- Table 77: Colombia Professional Speaker Industry Revenue (Million) Forecast, by Application 2019 & 2032
- Table 78: Colombia Professional Speaker Industry Volume (K Unit) Forecast, by Application 2019 & 2032
- Table 79: Ecuador Professional Speaker Industry Revenue (Million) Forecast, by Application 2019 & 2032
- Table 80: Ecuador Professional Speaker Industry Volume (K Unit) Forecast, by Application 2019 & 2032
- Table 81: Venezuela Professional Speaker Industry Revenue (Million) Forecast, by Application 2019 & 2032
- Table 82: Venezuela Professional Speaker Industry Volume (K Unit) Forecast, by Application 2019 & 2032
- Table 83: Rest of South America Professional Speaker Industry Revenue (Million) Forecast, by Application 2019 & 2032
- Table 84: Rest of South America Professional Speaker Industry Volume (K Unit) Forecast, by Application 2019 & 2032
- Table 85: Global Professional Speaker Industry Revenue Million Forecast, by Country 2019 & 2032
- Table 86: Global Professional Speaker Industry Volume K Unit Forecast, by Country 2019 & 2032
- Table 87: United States Professional Speaker Industry Revenue (Million) Forecast, by Application 2019 & 2032
- Table 88: United States Professional Speaker Industry Volume (K Unit) Forecast, by Application 2019 & 2032
- Table 89: Canada Professional Speaker Industry Revenue (Million) Forecast, by Application 2019 & 2032
- Table 90: Canada Professional Speaker Industry Volume (K Unit) Forecast, by Application 2019 & 2032
- Table 91: Mexico Professional Speaker Industry Revenue (Million) Forecast, by Application 2019 & 2032
- Table 92: Mexico Professional Speaker Industry Volume (K Unit) Forecast, by Application 2019 & 2032
- Table 93: Global Professional Speaker Industry Revenue Million Forecast, by Country 2019 & 2032
- Table 94: Global Professional Speaker Industry Volume K Unit Forecast, by Country 2019 & 2032
- Table 95: United Arab Emirates Professional Speaker Industry Revenue (Million) Forecast, by Application 2019 & 2032
- Table 96: United Arab Emirates Professional Speaker Industry Volume (K Unit) Forecast, by Application 2019 & 2032
- Table 97: Saudi Arabia Professional Speaker Industry Revenue (Million) Forecast, by Application 2019 & 2032
- Table 98: Saudi Arabia Professional Speaker Industry Volume (K Unit) Forecast, by Application 2019 & 2032
- Table 99: South Africa Professional Speaker Industry Revenue (Million) Forecast, by Application 2019 & 2032
- Table 100: South Africa Professional Speaker Industry Volume (K Unit) Forecast, by Application 2019 & 2032
- Table 101: Rest of Middle East and Africa Professional Speaker Industry Revenue (Million) Forecast, by Application 2019 & 2032
- Table 102: Rest of Middle East and Africa Professional Speaker Industry Volume (K Unit) Forecast, by Application 2019 & 2032
- Table 103: Global Professional Speaker Industry Revenue Million Forecast, by Product Type 2019 & 2032
- Table 104: Global Professional Speaker Industry Volume K Unit Forecast, by Product Type 2019 & 2032
- Table 105: Global Professional Speaker Industry Revenue Million Forecast, by Amplification Method 2019 & 2032
- Table 106: Global Professional Speaker Industry Volume K Unit Forecast, by Amplification Method 2019 & 2032
- Table 107: Global Professional Speaker Industry Revenue Million Forecast, by End-User 2019 & 2032
- Table 108: Global Professional Speaker Industry Volume K Unit Forecast, by End-User 2019 & 2032
- Table 109: Global Professional Speaker Industry Revenue Million Forecast, by Distribution Channel 2019 & 2032
- Table 110: Global Professional Speaker Industry Volume K Unit Forecast, by Distribution Channel 2019 & 2032
- Table 111: Global Professional Speaker Industry Revenue Million Forecast, by Country 2019 & 2032
- Table 112: Global Professional Speaker Industry Volume K Unit Forecast, by Country 2019 & 2032
- Table 113: Global Professional Speaker Industry Revenue Million Forecast, by Product Type 2019 & 2032
- Table 114: Global Professional Speaker Industry Volume K Unit Forecast, by Product Type 2019 & 2032
- Table 115: Global Professional Speaker Industry Revenue Million Forecast, by Amplification Method 2019 & 2032
- Table 116: Global Professional Speaker Industry Volume K Unit Forecast, by Amplification Method 2019 & 2032
- Table 117: Global Professional Speaker Industry Revenue Million Forecast, by End-User 2019 & 2032
- Table 118: Global Professional Speaker Industry Volume K Unit Forecast, by End-User 2019 & 2032
- Table 119: Global Professional Speaker Industry Revenue Million Forecast, by Distribution Channel 2019 & 2032
- Table 120: Global Professional Speaker Industry Volume K Unit Forecast, by Distribution Channel 2019 & 2032
- Table 121: Global Professional Speaker Industry Revenue Million Forecast, by Country 2019 & 2032
- Table 122: Global Professional Speaker Industry Volume K Unit Forecast, by Country 2019 & 2032
- Table 123: Global Professional Speaker Industry Revenue Million Forecast, by Product Type 2019 & 2032
- Table 124: Global Professional Speaker Industry Volume K Unit Forecast, by Product Type 2019 & 2032
- Table 125: Global Professional Speaker Industry Revenue Million Forecast, by Amplification Method 2019 & 2032
- Table 126: Global Professional Speaker Industry Volume K Unit Forecast, by Amplification Method 2019 & 2032
- Table 127: Global Professional Speaker Industry Revenue Million Forecast, by End-User 2019 & 2032
- Table 128: Global Professional Speaker Industry Volume K Unit Forecast, by End-User 2019 & 2032
- Table 129: Global Professional Speaker Industry Revenue Million Forecast, by Distribution Channel 2019 & 2032
- Table 130: Global Professional Speaker Industry Volume K Unit Forecast, by Distribution Channel 2019 & 2032
- Table 131: Global Professional Speaker Industry Revenue Million Forecast, by Country 2019 & 2032
- Table 132: Global Professional Speaker Industry Volume K Unit Forecast, by Country 2019 & 2032
- Table 133: Global Professional Speaker Industry Revenue Million Forecast, by Product Type 2019 & 2032
- Table 134: Global Professional Speaker Industry Volume K Unit Forecast, by Product Type 2019 & 2032
- Table 135: Global Professional Speaker Industry Revenue Million Forecast, by Amplification Method 2019 & 2032
- Table 136: Global Professional Speaker Industry Volume K Unit Forecast, by Amplification Method 2019 & 2032
- Table 137: Global Professional Speaker Industry Revenue Million Forecast, by End-User 2019 & 2032
- Table 138: Global Professional Speaker Industry Volume K Unit Forecast, by End-User 2019 & 2032
- Table 139: Global Professional Speaker Industry Revenue Million Forecast, by Distribution Channel 2019 & 2032
- Table 140: Global Professional Speaker Industry Volume K Unit Forecast, by Distribution Channel 2019 & 2032
- Table 141: Global Professional Speaker Industry Revenue Million Forecast, by Country 2019 & 2032
- Table 142: Global Professional Speaker Industry Volume K Unit Forecast, by Country 2019 & 2032
- Table 143: Global Professional Speaker Industry Revenue Million Forecast, by Product Type 2019 & 2032
- Table 144: Global Professional Speaker Industry Volume K Unit Forecast, by Product Type 2019 & 2032
- Table 145: Global Professional Speaker Industry Revenue Million Forecast, by Amplification Method 2019 & 2032
- Table 146: Global Professional Speaker Industry Volume K Unit Forecast, by Amplification Method 2019 & 2032
- Table 147: Global Professional Speaker Industry Revenue Million Forecast, by End-User 2019 & 2032
- Table 148: Global Professional Speaker Industry Volume K Unit Forecast, by End-User 2019 & 2032
- Table 149: Global Professional Speaker Industry Revenue Million Forecast, by Distribution Channel 2019 & 2032
- Table 150: Global Professional Speaker Industry Volume K Unit Forecast, by Distribution Channel 2019 & 2032
- Table 151: Global Professional Speaker Industry Revenue Million Forecast, by Country 2019 & 2032
- Table 152: Global Professional Speaker Industry Volume K Unit Forecast, by Country 2019 & 2032
Frequently Asked Questions
1. What is the projected Compound Annual Growth Rate (CAGR) of the Professional Speaker Industry?
The projected CAGR is approximately 3.20%.
2. Which companies are prominent players in the Professional Speaker Industry?
Key companies in the market include Renkus-Heinz, Bowers & Wilkins, Bose Corporation, Carlson Audio Systems, Loud Audio, L-Acoustics, D&B Audiotechnik, Harman International (Samsung), Yamaha Corporation, Music Group (Music Tribe), Sony Corporation, B&C Speakers, K-Array, Meyer Sound Laboratories, Nady Systems, AEB Industriale (DB Technologies).
3. What are the main segments of the Professional Speaker Industry?
The market segments include Product Type, Amplification Method, End-User, Distribution Channel.
4. Can you provide details about the market size?
The market size is estimated to be USD XX Million as of 2022.
5. What are some drivers contributing to market growth?
; Increased Demand from Corporate. Governments. and Institutions; Expansion of Live Music Industry; Growth in Music Production and Recording Equipment Market.
6. What are the notable trends driving market growth?
Music Production and Recording Equipment to Boost the Growth of the Market.
7. Are there any restraints impacting market growth?
; Volatility in Raw Material Costs; Acoustical Challenges.
8. Can you provide examples of recent developments in the market?
N/A
9. What pricing options are available for accessing the report?
Pricing options include single-user, multi-user, and enterprise licenses priced at USD 4750, USD 5250, and USD 8750 respectively.
10. Is the market size provided in terms of value or volume?
The market size is provided in terms of value, measured in Million and volume, measured in K Unit.
11. Are there any specific market keywords associated with the report?
Yes, the market keyword associated with the report is "Professional Speaker Industry," which aids in identifying and referencing the specific market segment covered.
12. How do I determine which pricing option suits my needs best?
The pricing options vary based on user requirements and access needs. Individual users may opt for single-user licenses, while businesses requiring broader access may choose multi-user or enterprise licenses for cost-effective access to the report.
13. Are there any additional resources or data provided in the Professional Speaker Industry report?
While the report offers comprehensive insights, it's advisable to review the specific contents or supplementary materials provided to ascertain if additional resources or data are available.
14. How can I stay updated on further developments or reports in the Professional Speaker Industry?
To stay informed about further developments, trends, and reports in the Professional Speaker Industry, consider subscribing to industry newsletters, following relevant companies and organizations, or regularly checking reputable industry news sources and publications.
Methodology
Step 1 - Identification of Relevant Samples Size from Population Database


Step 2 - Approaches for Defining Global Market Size (Value, Volume* & Price*)

Note*: In applicable scenarios
Step 3 - Data Sources
Primary Research
- Web Analytics
- Survey Reports
- Research Institute
- Latest Research Reports
- Opinion Leaders
Secondary Research
- Annual Reports
- White Paper
- Latest Press Release
- Industry Association
- Paid Database
- Investor Presentations

Step 4 - Data Triangulation
Involves using different sources of information in order to increase the validity of a study
These sources are likely to be stakeholders in a program - participants, other researchers, program staff, other community members, and so on.
Then we put all data in single framework & apply various statistical tools to find out the dynamic on the market.
During the analysis stage, feedback from the stakeholder groups would be compared to determine areas of agreement as well as areas of divergence


