
Key Insights
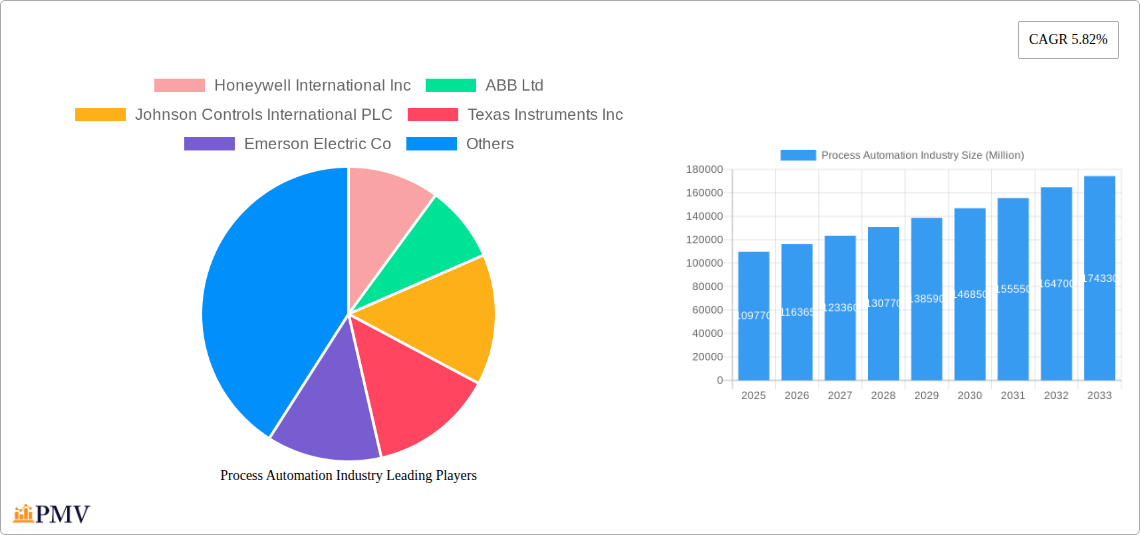
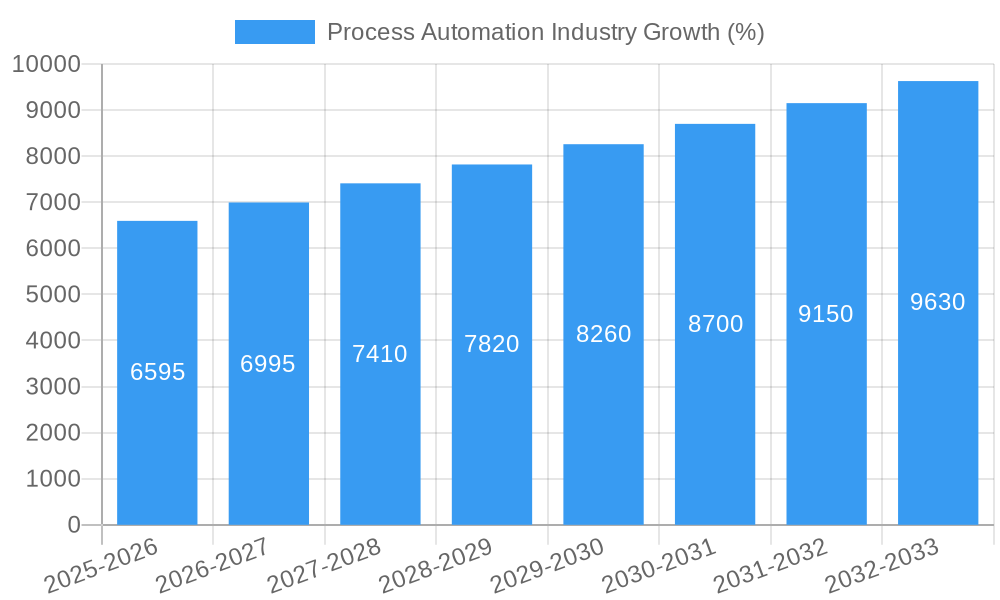
The process automation market, valued at $109.77 billion in 2025, is projected to experience robust growth, driven by increasing demand for enhanced efficiency, productivity, and safety across various industries. A Compound Annual Growth Rate (CAGR) of 5.82% from 2025 to 2033 indicates a significant expansion of this market, fueled by the widespread adoption of advanced technologies like artificial intelligence (AI) and the Internet of Things (IoT) for process optimization. Key segments driving this growth include Supervisory Control and Data Acquisition (SCADA) systems, Programmable Logic Controllers (PLCs), and Distributed Control Systems (DCSs), which are crucial for automating complex industrial processes. The rising adoption of Industry 4.0 principles across sectors like chemicals, oil & gas, and pharmaceuticals further accelerates market expansion. Growing concerns regarding operational safety and the need for predictive maintenance are also significant contributors to this upward trend. The chemical and petrochemical industries represent a substantial portion of the market due to their complex processes and high demand for automation solutions. Geographic expansion, particularly in rapidly developing economies of Asia-Pacific, is expected to contribute significantly to overall market growth.
However, the market faces certain challenges. High initial investment costs associated with implementing automation systems might restrain smaller companies from adopting these technologies. Furthermore, the need for skilled labor to manage and maintain these complex systems presents another obstacle. Despite these restraints, the long-term benefits in terms of increased efficiency and reduced operational costs outweigh these challenges, driving continued market expansion. The ongoing trend towards digitalization and the increasing adoption of cloud-based solutions will likely reshape the market landscape in the coming years, presenting new opportunities for innovation and growth. The competitive landscape is populated by major players like Honeywell, ABB, and Siemens, who constantly strive for innovation and market share through strategic partnerships and technological advancements.
Process Automation Industry Market Report: 2019-2033
This comprehensive report provides an in-depth analysis of the global process automation industry, offering invaluable insights for stakeholders, investors, and industry professionals. With a study period spanning 2019-2033, a base year of 2025, and a forecast period of 2025-2033, this report offers a detailed overview of market dynamics, trends, and future growth potential. The market size is projected to reach xx Million by 2033, exhibiting a robust CAGR of xx% during the forecast period.
Process Automation Industry Market Structure & Competitive Dynamics
The process automation market is characterized by a moderately concentrated landscape, with several multinational corporations holding significant market share. Key players such as Honeywell International Inc, ABB Ltd, and Siemens Corporation compete intensely based on technological innovation, product portfolios, and global reach. The market share of the top 10 players is estimated to be around xx%, with Honeywell International Inc holding the leading position at approximately xx% in 2025.
The industry exhibits a complex innovation ecosystem involving established players, specialized technology providers, and startups. Regulatory frameworks, varying across regions, influence adoption rates and necessitate compliance with safety and environmental standards. Product substitutes, such as manual control systems, exist but are gradually being replaced due to the increasing benefits of automation. End-user trends, driven by factors like increasing operational efficiency and sustainability goals, fuel the market's growth.
Mergers and acquisitions (M&A) activity has been significant, with several large-scale deals observed in the historical period (2019-2024). The total value of M&A deals in the process automation sector during this period is estimated at approximately $xx Million. These activities reflect the consolidation efforts within the industry and the strategic acquisition of specialized technologies.
- Market Concentration: Moderately concentrated, with top 10 players holding xx% market share in 2025.
- Innovation Ecosystems: A blend of established players, specialized technology providers, and emerging startups.
- Regulatory Frameworks: Vary significantly by region, impacting adoption rates.
- M&A Activity (2019-2024): Total deal value estimated at $xx Million.
Process Automation Industry Industry Trends & Insights
The process automation industry is experiencing significant transformation fueled by several key trends. The increasing demand for enhanced operational efficiency, improved productivity, and reduced operational costs drives market growth. Technological advancements, such as the adoption of Artificial Intelligence (AI), Machine Learning (ML), and the Industrial Internet of Things (IIoT), are revolutionizing process control and optimization. Consumer preferences are shifting towards sustainable and environmentally friendly automation solutions, leading to the adoption of energy-efficient technologies and reduced environmental impact. The competitive landscape remains dynamic, with companies continually innovating and seeking new market opportunities. The market is projected to witness substantial growth, with a CAGR of xx% during the forecast period (2025-2033), driven by the factors mentioned above and the increasing adoption of automation across various end-user industries. Market penetration in key sectors like oil & gas and pharmaceuticals is expected to reach xx% by 2033.
Dominant Markets & Segments in Process Automation Industry
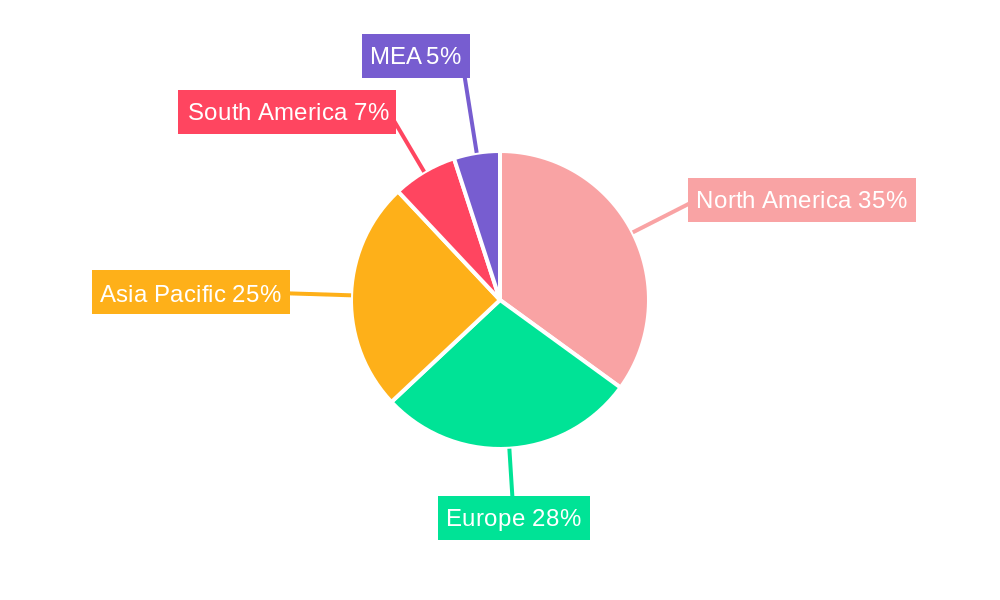
The process automation market demonstrates significant regional variations in dominance, with North America and Europe currently leading. However, the Asia-Pacific region is experiencing rapid growth, driven by significant investments in infrastructure development and industrialization. Within segments, the PLC and DCS systems hold the largest market share among system types, while the chemical and petrochemical industry dominates across end-user segments.
- Leading Region: North America (2025)
- Fastest-Growing Region: Asia-Pacific
- Dominant System Type: Programmable Logic Controller (PLC) and Distributed Control System (DCS)
- Dominant End-User Industry: Chemical and Petrochemical
Key Drivers for Dominance:
- North America & Europe: Established industrial base, high technological advancements, stringent regulatory frameworks driving automation adoption.
- Asia-Pacific: Rapid industrialization, increasing infrastructure investments, government initiatives promoting automation.
- PLC & DCS: Established technologies with proven reliability and wide applicability across various industries.
- Chemical & Petrochemical: High demand for process optimization, safety, and efficiency improvements.
Process Automation Industry Product Innovations
Recent product innovations focus on enhancing connectivity, improving data analytics capabilities, and integrating advanced technologies like AI and cloud computing. New process automation systems offer improved scalability, flexibility, and cybersecurity features, catering to the growing demand for robust and secure solutions. The integration of advanced analytics tools enables predictive maintenance and optimized process control, enhancing operational efficiency and reducing downtime.
Report Segmentation & Scope
This report segments the process automation market based on system type (SCADA, PLC, DCS, MES, Valves & Actuators, Electric Motors, HMI, Process Safety Systems, Sensors & Transmitters, Other Systems), communication protocol (Wired, Wireless), and end-user industry (Chemical & Petrochemical, Paper & Pulp, Water & Wastewater Treatment, Energy & Utilities, Oil & Gas, Pharmaceutical, Food & Beverages, Other End-user Industries). Each segment's growth projections, market sizes, and competitive dynamics are thoroughly analyzed, providing a detailed understanding of market opportunities and challenges within specific niches. For example, the DCS segment is expected to experience significant growth driven by the increasing adoption in the energy and utilities sectors. The wireless protocol segment is witnessing rapid expansion, driven by its advantages in remote monitoring and flexible deployment.
Key Drivers of Process Automation Industry Growth
Several factors are driving the growth of the process automation industry. Technological advancements, including the rise of AI, ML, and IoT, are enabling sophisticated automation solutions. Favorable government policies and regulations promoting industrial automation, particularly in developing economies, are creating significant market opportunities. The increasing demand for operational efficiency and cost reduction across various industries is further fueling the adoption of process automation technologies. The need for enhanced safety and environmental compliance also plays a crucial role in driving market growth.
Challenges in the Process Automation Industry Sector
Despite the promising growth prospects, several challenges hinder the process automation industry's expansion. High initial investment costs associated with implementing advanced automation systems can be a barrier for smaller companies. Concerns surrounding cybersecurity threats and data security remain a major concern. Supply chain disruptions and the availability of skilled labor for installation and maintenance pose additional challenges. The complexity of integrating various automation systems across different platforms can also impede widespread adoption. These factors collectively impact the market's growth trajectory, requiring proactive strategies to mitigate their effects.
Leading Players in the Process Automation Industry Market
- Honeywell International Inc
- ABB Ltd
- Johnson Controls International PLC
- Texas Instruments Inc
- Emerson Electric Co
- Mitsubishi Electric Corporation
- Schneider Electric SE
- Eaton Corporation PLC
- Siemens Corporation
- Rockwell Automation Inc
- Bosch Rexroth AG (Robert Bosch GmBH)
- Dassault Systemes SE
- Yokogawa Electric Corporation
Key Developments in Process Automation Industry Sector
- 2023: Honeywell launched a new AI-powered process optimization solution.
- 2022: ABB and Siemens announced a strategic partnership to develop next-generation automation technologies.
- 2021: Emerson acquired a startup specializing in IIoT solutions. (Further examples would be added here based on actual data.)
Strategic Process Automation Industry Market Outlook
The process automation industry is poised for significant growth, driven by ongoing technological advancements, increasing adoption across various industries, and the growing emphasis on operational efficiency and sustainability. Strategic opportunities lie in developing innovative solutions leveraging AI, ML, and cloud computing, focusing on specific niche markets, and strengthening partnerships across the value chain. The market's future trajectory hinges on addressing challenges related to cybersecurity, supply chain stability, and skills development within the industry. Companies that effectively adapt to these dynamics and deliver innovative, cost-effective solutions are best positioned to succeed in this rapidly evolving market.
Process Automation Industry Segmentation
-
1. System Type
- 1.1. Supervisory Control and Data Acquisition (SCADA)
- 1.2. Programmable Logic Controller (PLC)
- 1.3. Distributed Control System (DCS)
- 1.4. Machine Execution System (MES)
- 1.5. Valves and Actuators
- 1.6. Electric Motors
- 1.7. Human Machine Interface (HMI)
- 1.8. Process Safety Systems
- 1.9. Sensors and Transmitters
- 1.10. Other Systems
-
2. Communication Protocol
- 2.1. Wired Protocol
- 2.2. Wireless Protocol
-
3. End-user Industry
- 3.1. Chemical and Petrochemical
- 3.2. Paper and Pulp
- 3.3. Water and Wastewater Treatment
- 3.4. Energy and Utilities
- 3.5. Oil and Gas
- 3.6. Pharmaceutical
- 3.7. Food and Beverages
- 3.8. Other End-user Industries
Process Automation Industry Segmentation By Geography
-
1. North America
- 1.1. United States
- 1.2. Canada
-
2. Europe
- 2.1. United Kingdom
- 2.2. Germany
- 2.3. France
- 2.4. Rest of Europe
-
3. Asia Pacific
- 3.1. China
- 3.2. India
- 3.3. Japan
- 3.4. Rest of Asia Pacific
- 4. Latin America
- 5. Middle East and Africa
Process Automation Industry REPORT HIGHLIGHTS
| Aspects | Details |
|---|---|
| Study Period | 2019-2033 |
| Base Year | 2024 |
| Estimated Year | 2025 |
| Forecast Period | 2025-2033 |
| Historical Period | 2019-2024 |
| Growth Rate | CAGR of 5.82% from 2019-2033 |
| Segmentation |
|
Table of Contents
- 1. Introduction
- 1.1. Research Scope
- 1.2. Market Segmentation
- 1.3. Research Methodology
- 1.4. Definitions and Assumptions
- 2. Executive Summary
- 2.1. Introduction
- 3. Market Dynamics
- 3.1. Introduction
- 3.2. Market Drivers
- 3.2.1. ; Rising Adoption of Robotics; Growing Emphasis on Energy Efficiency and Cost Reduction; Emergence of IIoT; Demand for Safety Automation Systems
- 3.3. Market Restrains
- 3.3.1. High Up-front Installation Costs and Interoperability Issues; Unavailability for Skilled Workforce
- 3.4. Market Trends
- 3.4.1. Paper and Pulp Segment is Expected to Register a Significant Growth
- 4. Market Factor Analysis
- 4.1. Porters Five Forces
- 4.2. Supply/Value Chain
- 4.3. PESTEL analysis
- 4.4. Market Entropy
- 4.5. Patent/Trademark Analysis
- 5. Global Process Automation Industry Analysis, Insights and Forecast, 2019-2031
- 5.1. Market Analysis, Insights and Forecast - by System Type
- 5.1.1. Supervisory Control and Data Acquisition (SCADA)
- 5.1.2. Programmable Logic Controller (PLC)
- 5.1.3. Distributed Control System (DCS)
- 5.1.4. Machine Execution System (MES)
- 5.1.5. Valves and Actuators
- 5.1.6. Electric Motors
- 5.1.7. Human Machine Interface (HMI)
- 5.1.8. Process Safety Systems
- 5.1.9. Sensors and Transmitters
- 5.1.10. Other Systems
- 5.2. Market Analysis, Insights and Forecast - by Communication Protocol
- 5.2.1. Wired Protocol
- 5.2.2. Wireless Protocol
- 5.3. Market Analysis, Insights and Forecast - by End-user Industry
- 5.3.1. Chemical and Petrochemical
- 5.3.2. Paper and Pulp
- 5.3.3. Water and Wastewater Treatment
- 5.3.4. Energy and Utilities
- 5.3.5. Oil and Gas
- 5.3.6. Pharmaceutical
- 5.3.7. Food and Beverages
- 5.3.8. Other End-user Industries
- 5.4. Market Analysis, Insights and Forecast - by Region
- 5.4.1. North America
- 5.4.2. Europe
- 5.4.3. Asia Pacific
- 5.4.4. Latin America
- 5.4.5. Middle East and Africa
- 5.1. Market Analysis, Insights and Forecast - by System Type
- 6. North America Process Automation Industry Analysis, Insights and Forecast, 2019-2031
- 6.1. Market Analysis, Insights and Forecast - by System Type
- 6.1.1. Supervisory Control and Data Acquisition (SCADA)
- 6.1.2. Programmable Logic Controller (PLC)
- 6.1.3. Distributed Control System (DCS)
- 6.1.4. Machine Execution System (MES)
- 6.1.5. Valves and Actuators
- 6.1.6. Electric Motors
- 6.1.7. Human Machine Interface (HMI)
- 6.1.8. Process Safety Systems
- 6.1.9. Sensors and Transmitters
- 6.1.10. Other Systems
- 6.2. Market Analysis, Insights and Forecast - by Communication Protocol
- 6.2.1. Wired Protocol
- 6.2.2. Wireless Protocol
- 6.3. Market Analysis, Insights and Forecast - by End-user Industry
- 6.3.1. Chemical and Petrochemical
- 6.3.2. Paper and Pulp
- 6.3.3. Water and Wastewater Treatment
- 6.3.4. Energy and Utilities
- 6.3.5. Oil and Gas
- 6.3.6. Pharmaceutical
- 6.3.7. Food and Beverages
- 6.3.8. Other End-user Industries
- 6.1. Market Analysis, Insights and Forecast - by System Type
- 7. Europe Process Automation Industry Analysis, Insights and Forecast, 2019-2031
- 7.1. Market Analysis, Insights and Forecast - by System Type
- 7.1.1. Supervisory Control and Data Acquisition (SCADA)
- 7.1.2. Programmable Logic Controller (PLC)
- 7.1.3. Distributed Control System (DCS)
- 7.1.4. Machine Execution System (MES)
- 7.1.5. Valves and Actuators
- 7.1.6. Electric Motors
- 7.1.7. Human Machine Interface (HMI)
- 7.1.8. Process Safety Systems
- 7.1.9. Sensors and Transmitters
- 7.1.10. Other Systems
- 7.2. Market Analysis, Insights and Forecast - by Communication Protocol
- 7.2.1. Wired Protocol
- 7.2.2. Wireless Protocol
- 7.3. Market Analysis, Insights and Forecast - by End-user Industry
- 7.3.1. Chemical and Petrochemical
- 7.3.2. Paper and Pulp
- 7.3.3. Water and Wastewater Treatment
- 7.3.4. Energy and Utilities
- 7.3.5. Oil and Gas
- 7.3.6. Pharmaceutical
- 7.3.7. Food and Beverages
- 7.3.8. Other End-user Industries
- 7.1. Market Analysis, Insights and Forecast - by System Type
- 8. Asia Pacific Process Automation Industry Analysis, Insights and Forecast, 2019-2031
- 8.1. Market Analysis, Insights and Forecast - by System Type
- 8.1.1. Supervisory Control and Data Acquisition (SCADA)
- 8.1.2. Programmable Logic Controller (PLC)
- 8.1.3. Distributed Control System (DCS)
- 8.1.4. Machine Execution System (MES)
- 8.1.5. Valves and Actuators
- 8.1.6. Electric Motors
- 8.1.7. Human Machine Interface (HMI)
- 8.1.8. Process Safety Systems
- 8.1.9. Sensors and Transmitters
- 8.1.10. Other Systems
- 8.2. Market Analysis, Insights and Forecast - by Communication Protocol
- 8.2.1. Wired Protocol
- 8.2.2. Wireless Protocol
- 8.3. Market Analysis, Insights and Forecast - by End-user Industry
- 8.3.1. Chemical and Petrochemical
- 8.3.2. Paper and Pulp
- 8.3.3. Water and Wastewater Treatment
- 8.3.4. Energy and Utilities
- 8.3.5. Oil and Gas
- 8.3.6. Pharmaceutical
- 8.3.7. Food and Beverages
- 8.3.8. Other End-user Industries
- 8.1. Market Analysis, Insights and Forecast - by System Type
- 9. Latin America Process Automation Industry Analysis, Insights and Forecast, 2019-2031
- 9.1. Market Analysis, Insights and Forecast - by System Type
- 9.1.1. Supervisory Control and Data Acquisition (SCADA)
- 9.1.2. Programmable Logic Controller (PLC)
- 9.1.3. Distributed Control System (DCS)
- 9.1.4. Machine Execution System (MES)
- 9.1.5. Valves and Actuators
- 9.1.6. Electric Motors
- 9.1.7. Human Machine Interface (HMI)
- 9.1.8. Process Safety Systems
- 9.1.9. Sensors and Transmitters
- 9.1.10. Other Systems
- 9.2. Market Analysis, Insights and Forecast - by Communication Protocol
- 9.2.1. Wired Protocol
- 9.2.2. Wireless Protocol
- 9.3. Market Analysis, Insights and Forecast - by End-user Industry
- 9.3.1. Chemical and Petrochemical
- 9.3.2. Paper and Pulp
- 9.3.3. Water and Wastewater Treatment
- 9.3.4. Energy and Utilities
- 9.3.5. Oil and Gas
- 9.3.6. Pharmaceutical
- 9.3.7. Food and Beverages
- 9.3.8. Other End-user Industries
- 9.1. Market Analysis, Insights and Forecast - by System Type
- 10. Middle East and Africa Process Automation Industry Analysis, Insights and Forecast, 2019-2031
- 10.1. Market Analysis, Insights and Forecast - by System Type
- 10.1.1. Supervisory Control and Data Acquisition (SCADA)
- 10.1.2. Programmable Logic Controller (PLC)
- 10.1.3. Distributed Control System (DCS)
- 10.1.4. Machine Execution System (MES)
- 10.1.5. Valves and Actuators
- 10.1.6. Electric Motors
- 10.1.7. Human Machine Interface (HMI)
- 10.1.8. Process Safety Systems
- 10.1.9. Sensors and Transmitters
- 10.1.10. Other Systems
- 10.2. Market Analysis, Insights and Forecast - by Communication Protocol
- 10.2.1. Wired Protocol
- 10.2.2. Wireless Protocol
- 10.3. Market Analysis, Insights and Forecast - by End-user Industry
- 10.3.1. Chemical and Petrochemical
- 10.3.2. Paper and Pulp
- 10.3.3. Water and Wastewater Treatment
- 10.3.4. Energy and Utilities
- 10.3.5. Oil and Gas
- 10.3.6. Pharmaceutical
- 10.3.7. Food and Beverages
- 10.3.8. Other End-user Industries
- 10.1. Market Analysis, Insights and Forecast - by System Type
- 11. North America Process Automation Industry Analysis, Insights and Forecast, 2019-2031
- 11.1. Market Analysis, Insights and Forecast - By Country/Sub-region
- 11.1.1 United States
- 11.1.2 Canada
- 11.1.3 Mexico
- 12. Europe Process Automation Industry Analysis, Insights and Forecast, 2019-2031
- 12.1. Market Analysis, Insights and Forecast - By Country/Sub-region
- 12.1.1 Germany
- 12.1.2 United Kingdom
- 12.1.3 France
- 12.1.4 Spain
- 12.1.5 Italy
- 12.1.6 Spain
- 12.1.7 Belgium
- 12.1.8 Netherland
- 12.1.9 Nordics
- 12.1.10 Rest of Europe
- 13. Asia Pacific Process Automation Industry Analysis, Insights and Forecast, 2019-2031
- 13.1. Market Analysis, Insights and Forecast - By Country/Sub-region
- 13.1.1 China
- 13.1.2 Japan
- 13.1.3 India
- 13.1.4 South Korea
- 13.1.5 Southeast Asia
- 13.1.6 Australia
- 13.1.7 Indonesia
- 13.1.8 Phillipes
- 13.1.9 Singapore
- 13.1.10 Thailandc
- 13.1.11 Rest of Asia Pacific
- 14. South America Process Automation Industry Analysis, Insights and Forecast, 2019-2031
- 14.1. Market Analysis, Insights and Forecast - By Country/Sub-region
- 14.1.1 Brazil
- 14.1.2 Argentina
- 14.1.3 Peru
- 14.1.4 Chile
- 14.1.5 Colombia
- 14.1.6 Ecuador
- 14.1.7 Venezuela
- 14.1.8 Rest of South America
- 15. MEA Process Automation Industry Analysis, Insights and Forecast, 2019-2031
- 15.1. Market Analysis, Insights and Forecast - By Country/Sub-region
- 15.1.1 United Arab Emirates
- 15.1.2 Saudi Arabia
- 15.1.3 South Africa
- 15.1.4 Rest of Middle East and Africa
- 16. Competitive Analysis
- 16.1. Global Market Share Analysis 2024
- 16.2. Company Profiles
- 16.2.1 Honeywell International Inc
- 16.2.1.1. Overview
- 16.2.1.2. Products
- 16.2.1.3. SWOT Analysis
- 16.2.1.4. Recent Developments
- 16.2.1.5. Financials (Based on Availability)
- 16.2.2 ABB Ltd
- 16.2.2.1. Overview
- 16.2.2.2. Products
- 16.2.2.3. SWOT Analysis
- 16.2.2.4. Recent Developments
- 16.2.2.5. Financials (Based on Availability)
- 16.2.3 Johnson Controls International PLC
- 16.2.3.1. Overview
- 16.2.3.2. Products
- 16.2.3.3. SWOT Analysis
- 16.2.3.4. Recent Developments
- 16.2.3.5. Financials (Based on Availability)
- 16.2.4 Texas Instruments Inc
- 16.2.4.1. Overview
- 16.2.4.2. Products
- 16.2.4.3. SWOT Analysis
- 16.2.4.4. Recent Developments
- 16.2.4.5. Financials (Based on Availability)
- 16.2.5 Emerson Electric Co
- 16.2.5.1. Overview
- 16.2.5.2. Products
- 16.2.5.3. SWOT Analysis
- 16.2.5.4. Recent Developments
- 16.2.5.5. Financials (Based on Availability)
- 16.2.6 Mitsubishi Electric Corporation
- 16.2.6.1. Overview
- 16.2.6.2. Products
- 16.2.6.3. SWOT Analysis
- 16.2.6.4. Recent Developments
- 16.2.6.5. Financials (Based on Availability)
- 16.2.7 Schneider Electric SE
- 16.2.7.1. Overview
- 16.2.7.2. Products
- 16.2.7.3. SWOT Analysis
- 16.2.7.4. Recent Developments
- 16.2.7.5. Financials (Based on Availability)
- 16.2.8 Eaton Corporation PLC
- 16.2.8.1. Overview
- 16.2.8.2. Products
- 16.2.8.3. SWOT Analysis
- 16.2.8.4. Recent Developments
- 16.2.8.5. Financials (Based on Availability)
- 16.2.9 Siemens Corporation
- 16.2.9.1. Overview
- 16.2.9.2. Products
- 16.2.9.3. SWOT Analysis
- 16.2.9.4. Recent Developments
- 16.2.9.5. Financials (Based on Availability)
- 16.2.10 Rockwell Automation Inc
- 16.2.10.1. Overview
- 16.2.10.2. Products
- 16.2.10.3. SWOT Analysis
- 16.2.10.4. Recent Developments
- 16.2.10.5. Financials (Based on Availability)
- 16.2.11 Bosch Rexroth AG (Robert Bosch GmBH)
- 16.2.11.1. Overview
- 16.2.11.2. Products
- 16.2.11.3. SWOT Analysis
- 16.2.11.4. Recent Developments
- 16.2.11.5. Financials (Based on Availability)
- 16.2.12 Dassault Systemes SE
- 16.2.12.1. Overview
- 16.2.12.2. Products
- 16.2.12.3. SWOT Analysis
- 16.2.12.4. Recent Developments
- 16.2.12.5. Financials (Based on Availability)
- 16.2.13 Yokogawa Electric Corporation
- 16.2.13.1. Overview
- 16.2.13.2. Products
- 16.2.13.3. SWOT Analysis
- 16.2.13.4. Recent Developments
- 16.2.13.5. Financials (Based on Availability)
- 16.2.1 Honeywell International Inc
List of Figures
- Figure 1: Global Process Automation Industry Revenue Breakdown (Million, %) by Region 2024 & 2032
- Figure 2: North America Process Automation Industry Revenue (Million), by Country 2024 & 2032
- Figure 3: North America Process Automation Industry Revenue Share (%), by Country 2024 & 2032
- Figure 4: Europe Process Automation Industry Revenue (Million), by Country 2024 & 2032
- Figure 5: Europe Process Automation Industry Revenue Share (%), by Country 2024 & 2032
- Figure 6: Asia Pacific Process Automation Industry Revenue (Million), by Country 2024 & 2032
- Figure 7: Asia Pacific Process Automation Industry Revenue Share (%), by Country 2024 & 2032
- Figure 8: South America Process Automation Industry Revenue (Million), by Country 2024 & 2032
- Figure 9: South America Process Automation Industry Revenue Share (%), by Country 2024 & 2032
- Figure 10: MEA Process Automation Industry Revenue (Million), by Country 2024 & 2032
- Figure 11: MEA Process Automation Industry Revenue Share (%), by Country 2024 & 2032
- Figure 12: North America Process Automation Industry Revenue (Million), by System Type 2024 & 2032
- Figure 13: North America Process Automation Industry Revenue Share (%), by System Type 2024 & 2032
- Figure 14: North America Process Automation Industry Revenue (Million), by Communication Protocol 2024 & 2032
- Figure 15: North America Process Automation Industry Revenue Share (%), by Communication Protocol 2024 & 2032
- Figure 16: North America Process Automation Industry Revenue (Million), by End-user Industry 2024 & 2032
- Figure 17: North America Process Automation Industry Revenue Share (%), by End-user Industry 2024 & 2032
- Figure 18: North America Process Automation Industry Revenue (Million), by Country 2024 & 2032
- Figure 19: North America Process Automation Industry Revenue Share (%), by Country 2024 & 2032
- Figure 20: Europe Process Automation Industry Revenue (Million), by System Type 2024 & 2032
- Figure 21: Europe Process Automation Industry Revenue Share (%), by System Type 2024 & 2032
- Figure 22: Europe Process Automation Industry Revenue (Million), by Communication Protocol 2024 & 2032
- Figure 23: Europe Process Automation Industry Revenue Share (%), by Communication Protocol 2024 & 2032
- Figure 24: Europe Process Automation Industry Revenue (Million), by End-user Industry 2024 & 2032
- Figure 25: Europe Process Automation Industry Revenue Share (%), by End-user Industry 2024 & 2032
- Figure 26: Europe Process Automation Industry Revenue (Million), by Country 2024 & 2032
- Figure 27: Europe Process Automation Industry Revenue Share (%), by Country 2024 & 2032
- Figure 28: Asia Pacific Process Automation Industry Revenue (Million), by System Type 2024 & 2032
- Figure 29: Asia Pacific Process Automation Industry Revenue Share (%), by System Type 2024 & 2032
- Figure 30: Asia Pacific Process Automation Industry Revenue (Million), by Communication Protocol 2024 & 2032
- Figure 31: Asia Pacific Process Automation Industry Revenue Share (%), by Communication Protocol 2024 & 2032
- Figure 32: Asia Pacific Process Automation Industry Revenue (Million), by End-user Industry 2024 & 2032
- Figure 33: Asia Pacific Process Automation Industry Revenue Share (%), by End-user Industry 2024 & 2032
- Figure 34: Asia Pacific Process Automation Industry Revenue (Million), by Country 2024 & 2032
- Figure 35: Asia Pacific Process Automation Industry Revenue Share (%), by Country 2024 & 2032
- Figure 36: Latin America Process Automation Industry Revenue (Million), by System Type 2024 & 2032
- Figure 37: Latin America Process Automation Industry Revenue Share (%), by System Type 2024 & 2032
- Figure 38: Latin America Process Automation Industry Revenue (Million), by Communication Protocol 2024 & 2032
- Figure 39: Latin America Process Automation Industry Revenue Share (%), by Communication Protocol 2024 & 2032
- Figure 40: Latin America Process Automation Industry Revenue (Million), by End-user Industry 2024 & 2032
- Figure 41: Latin America Process Automation Industry Revenue Share (%), by End-user Industry 2024 & 2032
- Figure 42: Latin America Process Automation Industry Revenue (Million), by Country 2024 & 2032
- Figure 43: Latin America Process Automation Industry Revenue Share (%), by Country 2024 & 2032
- Figure 44: Middle East and Africa Process Automation Industry Revenue (Million), by System Type 2024 & 2032
- Figure 45: Middle East and Africa Process Automation Industry Revenue Share (%), by System Type 2024 & 2032
- Figure 46: Middle East and Africa Process Automation Industry Revenue (Million), by Communication Protocol 2024 & 2032
- Figure 47: Middle East and Africa Process Automation Industry Revenue Share (%), by Communication Protocol 2024 & 2032
- Figure 48: Middle East and Africa Process Automation Industry Revenue (Million), by End-user Industry 2024 & 2032
- Figure 49: Middle East and Africa Process Automation Industry Revenue Share (%), by End-user Industry 2024 & 2032
- Figure 50: Middle East and Africa Process Automation Industry Revenue (Million), by Country 2024 & 2032
- Figure 51: Middle East and Africa Process Automation Industry Revenue Share (%), by Country 2024 & 2032
List of Tables
- Table 1: Global Process Automation Industry Revenue Million Forecast, by Region 2019 & 2032
- Table 2: Global Process Automation Industry Revenue Million Forecast, by System Type 2019 & 2032
- Table 3: Global Process Automation Industry Revenue Million Forecast, by Communication Protocol 2019 & 2032
- Table 4: Global Process Automation Industry Revenue Million Forecast, by End-user Industry 2019 & 2032
- Table 5: Global Process Automation Industry Revenue Million Forecast, by Region 2019 & 2032
- Table 6: Global Process Automation Industry Revenue Million Forecast, by Country 2019 & 2032
- Table 7: United States Process Automation Industry Revenue (Million) Forecast, by Application 2019 & 2032
- Table 8: Canada Process Automation Industry Revenue (Million) Forecast, by Application 2019 & 2032
- Table 9: Mexico Process Automation Industry Revenue (Million) Forecast, by Application 2019 & 2032
- Table 10: Global Process Automation Industry Revenue Million Forecast, by Country 2019 & 2032
- Table 11: Germany Process Automation Industry Revenue (Million) Forecast, by Application 2019 & 2032
- Table 12: United Kingdom Process Automation Industry Revenue (Million) Forecast, by Application 2019 & 2032
- Table 13: France Process Automation Industry Revenue (Million) Forecast, by Application 2019 & 2032
- Table 14: Spain Process Automation Industry Revenue (Million) Forecast, by Application 2019 & 2032
- Table 15: Italy Process Automation Industry Revenue (Million) Forecast, by Application 2019 & 2032
- Table 16: Spain Process Automation Industry Revenue (Million) Forecast, by Application 2019 & 2032
- Table 17: Belgium Process Automation Industry Revenue (Million) Forecast, by Application 2019 & 2032
- Table 18: Netherland Process Automation Industry Revenue (Million) Forecast, by Application 2019 & 2032
- Table 19: Nordics Process Automation Industry Revenue (Million) Forecast, by Application 2019 & 2032
- Table 20: Rest of Europe Process Automation Industry Revenue (Million) Forecast, by Application 2019 & 2032
- Table 21: Global Process Automation Industry Revenue Million Forecast, by Country 2019 & 2032
- Table 22: China Process Automation Industry Revenue (Million) Forecast, by Application 2019 & 2032
- Table 23: Japan Process Automation Industry Revenue (Million) Forecast, by Application 2019 & 2032
- Table 24: India Process Automation Industry Revenue (Million) Forecast, by Application 2019 & 2032
- Table 25: South Korea Process Automation Industry Revenue (Million) Forecast, by Application 2019 & 2032
- Table 26: Southeast Asia Process Automation Industry Revenue (Million) Forecast, by Application 2019 & 2032
- Table 27: Australia Process Automation Industry Revenue (Million) Forecast, by Application 2019 & 2032
- Table 28: Indonesia Process Automation Industry Revenue (Million) Forecast, by Application 2019 & 2032
- Table 29: Phillipes Process Automation Industry Revenue (Million) Forecast, by Application 2019 & 2032
- Table 30: Singapore Process Automation Industry Revenue (Million) Forecast, by Application 2019 & 2032
- Table 31: Thailandc Process Automation Industry Revenue (Million) Forecast, by Application 2019 & 2032
- Table 32: Rest of Asia Pacific Process Automation Industry Revenue (Million) Forecast, by Application 2019 & 2032
- Table 33: Global Process Automation Industry Revenue Million Forecast, by Country 2019 & 2032
- Table 34: Brazil Process Automation Industry Revenue (Million) Forecast, by Application 2019 & 2032
- Table 35: Argentina Process Automation Industry Revenue (Million) Forecast, by Application 2019 & 2032
- Table 36: Peru Process Automation Industry Revenue (Million) Forecast, by Application 2019 & 2032
- Table 37: Chile Process Automation Industry Revenue (Million) Forecast, by Application 2019 & 2032
- Table 38: Colombia Process Automation Industry Revenue (Million) Forecast, by Application 2019 & 2032
- Table 39: Ecuador Process Automation Industry Revenue (Million) Forecast, by Application 2019 & 2032
- Table 40: Venezuela Process Automation Industry Revenue (Million) Forecast, by Application 2019 & 2032
- Table 41: Rest of South America Process Automation Industry Revenue (Million) Forecast, by Application 2019 & 2032
- Table 42: Global Process Automation Industry Revenue Million Forecast, by Country 2019 & 2032
- Table 43: United Arab Emirates Process Automation Industry Revenue (Million) Forecast, by Application 2019 & 2032
- Table 44: Saudi Arabia Process Automation Industry Revenue (Million) Forecast, by Application 2019 & 2032
- Table 45: South Africa Process Automation Industry Revenue (Million) Forecast, by Application 2019 & 2032
- Table 46: Rest of Middle East and Africa Process Automation Industry Revenue (Million) Forecast, by Application 2019 & 2032
- Table 47: Global Process Automation Industry Revenue Million Forecast, by System Type 2019 & 2032
- Table 48: Global Process Automation Industry Revenue Million Forecast, by Communication Protocol 2019 & 2032
- Table 49: Global Process Automation Industry Revenue Million Forecast, by End-user Industry 2019 & 2032
- Table 50: Global Process Automation Industry Revenue Million Forecast, by Country 2019 & 2032
- Table 51: United States Process Automation Industry Revenue (Million) Forecast, by Application 2019 & 2032
- Table 52: Canada Process Automation Industry Revenue (Million) Forecast, by Application 2019 & 2032
- Table 53: Global Process Automation Industry Revenue Million Forecast, by System Type 2019 & 2032
- Table 54: Global Process Automation Industry Revenue Million Forecast, by Communication Protocol 2019 & 2032
- Table 55: Global Process Automation Industry Revenue Million Forecast, by End-user Industry 2019 & 2032
- Table 56: Global Process Automation Industry Revenue Million Forecast, by Country 2019 & 2032
- Table 57: United Kingdom Process Automation Industry Revenue (Million) Forecast, by Application 2019 & 2032
- Table 58: Germany Process Automation Industry Revenue (Million) Forecast, by Application 2019 & 2032
- Table 59: France Process Automation Industry Revenue (Million) Forecast, by Application 2019 & 2032
- Table 60: Rest of Europe Process Automation Industry Revenue (Million) Forecast, by Application 2019 & 2032
- Table 61: Global Process Automation Industry Revenue Million Forecast, by System Type 2019 & 2032
- Table 62: Global Process Automation Industry Revenue Million Forecast, by Communication Protocol 2019 & 2032
- Table 63: Global Process Automation Industry Revenue Million Forecast, by End-user Industry 2019 & 2032
- Table 64: Global Process Automation Industry Revenue Million Forecast, by Country 2019 & 2032
- Table 65: China Process Automation Industry Revenue (Million) Forecast, by Application 2019 & 2032
- Table 66: India Process Automation Industry Revenue (Million) Forecast, by Application 2019 & 2032
- Table 67: Japan Process Automation Industry Revenue (Million) Forecast, by Application 2019 & 2032
- Table 68: Rest of Asia Pacific Process Automation Industry Revenue (Million) Forecast, by Application 2019 & 2032
- Table 69: Global Process Automation Industry Revenue Million Forecast, by System Type 2019 & 2032
- Table 70: Global Process Automation Industry Revenue Million Forecast, by Communication Protocol 2019 & 2032
- Table 71: Global Process Automation Industry Revenue Million Forecast, by End-user Industry 2019 & 2032
- Table 72: Global Process Automation Industry Revenue Million Forecast, by Country 2019 & 2032
- Table 73: Global Process Automation Industry Revenue Million Forecast, by System Type 2019 & 2032
- Table 74: Global Process Automation Industry Revenue Million Forecast, by Communication Protocol 2019 & 2032
- Table 75: Global Process Automation Industry Revenue Million Forecast, by End-user Industry 2019 & 2032
- Table 76: Global Process Automation Industry Revenue Million Forecast, by Country 2019 & 2032
Frequently Asked Questions
1. What is the projected Compound Annual Growth Rate (CAGR) of the Process Automation Industry?
The projected CAGR is approximately 5.82%.
2. Which companies are prominent players in the Process Automation Industry?
Key companies in the market include Honeywell International Inc, ABB Ltd, Johnson Controls International PLC, Texas Instruments Inc, Emerson Electric Co, Mitsubishi Electric Corporation, Schneider Electric SE, Eaton Corporation PLC, Siemens Corporation, Rockwell Automation Inc, Bosch Rexroth AG (Robert Bosch GmBH), Dassault Systemes SE, Yokogawa Electric Corporation.
3. What are the main segments of the Process Automation Industry?
The market segments include System Type, Communication Protocol, End-user Industry.
4. Can you provide details about the market size?
The market size is estimated to be USD 109.77 Million as of 2022.
5. What are some drivers contributing to market growth?
; Rising Adoption of Robotics; Growing Emphasis on Energy Efficiency and Cost Reduction; Emergence of IIoT; Demand for Safety Automation Systems.
6. What are the notable trends driving market growth?
Paper and Pulp Segment is Expected to Register a Significant Growth.
7. Are there any restraints impacting market growth?
High Up-front Installation Costs and Interoperability Issues; Unavailability for Skilled Workforce.
8. Can you provide examples of recent developments in the market?
N/A
9. What pricing options are available for accessing the report?
Pricing options include single-user, multi-user, and enterprise licenses priced at USD 4750, USD 5250, and USD 8750 respectively.
10. Is the market size provided in terms of value or volume?
The market size is provided in terms of value, measured in Million.
11. Are there any specific market keywords associated with the report?
Yes, the market keyword associated with the report is "Process Automation Industry," which aids in identifying and referencing the specific market segment covered.
12. How do I determine which pricing option suits my needs best?
The pricing options vary based on user requirements and access needs. Individual users may opt for single-user licenses, while businesses requiring broader access may choose multi-user or enterprise licenses for cost-effective access to the report.
13. Are there any additional resources or data provided in the Process Automation Industry report?
While the report offers comprehensive insights, it's advisable to review the specific contents or supplementary materials provided to ascertain if additional resources or data are available.
14. How can I stay updated on further developments or reports in the Process Automation Industry?
To stay informed about further developments, trends, and reports in the Process Automation Industry, consider subscribing to industry newsletters, following relevant companies and organizations, or regularly checking reputable industry news sources and publications.
Methodology
Step 1 - Identification of Relevant Samples Size from Population Database


Step 2 - Approaches for Defining Global Market Size (Value, Volume* & Price*)

Note*: In applicable scenarios
Step 3 - Data Sources
Primary Research
- Web Analytics
- Survey Reports
- Research Institute
- Latest Research Reports
- Opinion Leaders
Secondary Research
- Annual Reports
- White Paper
- Latest Press Release
- Industry Association
- Paid Database
- Investor Presentations

Step 4 - Data Triangulation
Involves using different sources of information in order to increase the validity of a study
These sources are likely to be stakeholders in a program - participants, other researchers, program staff, other community members, and so on.
Then we put all data in single framework & apply various statistical tools to find out the dynamic on the market.
During the analysis stage, feedback from the stakeholder groups would be compared to determine areas of agreement as well as areas of divergence


