
Key Insights
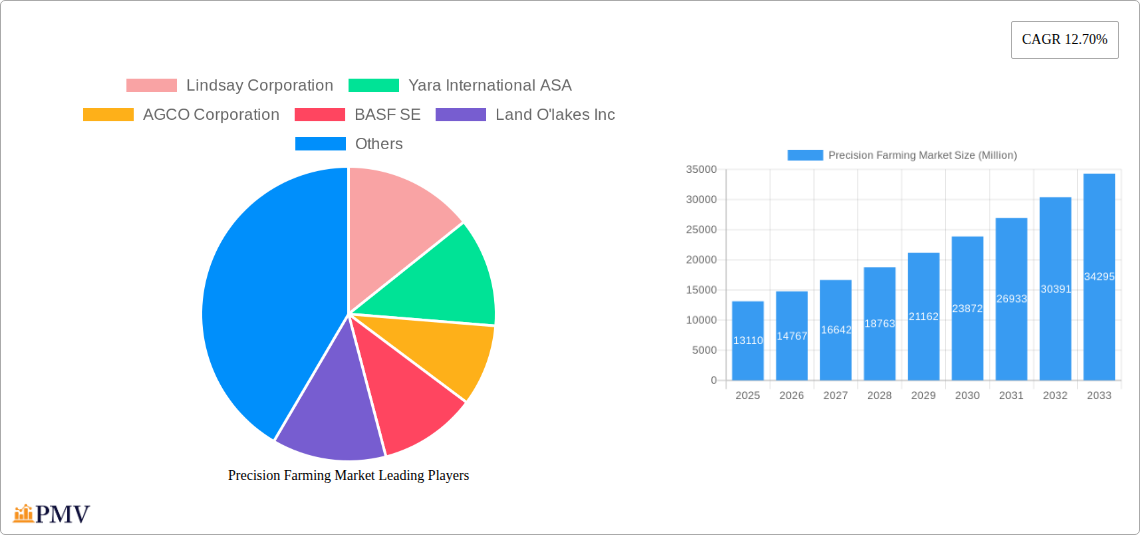
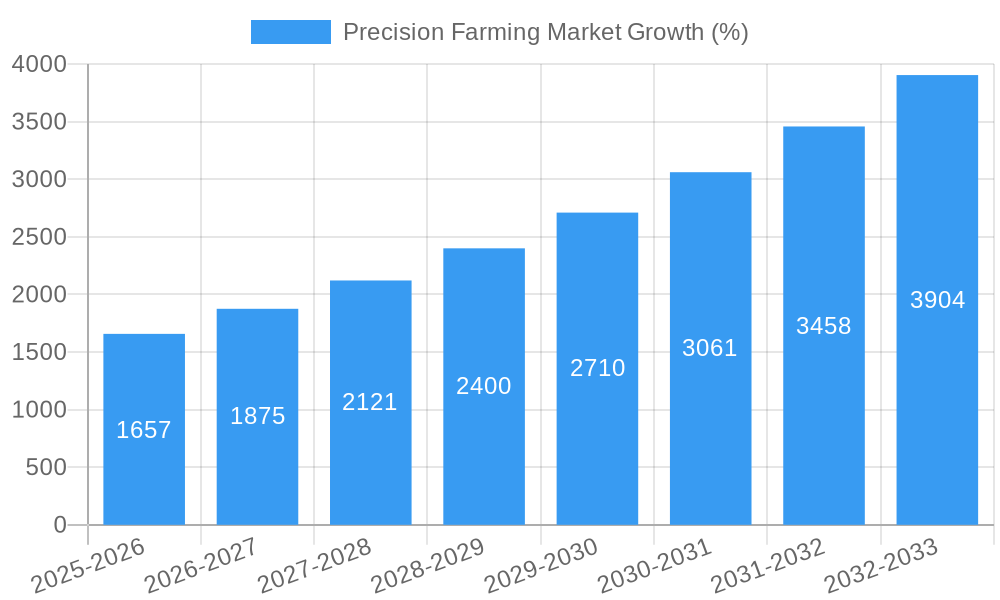
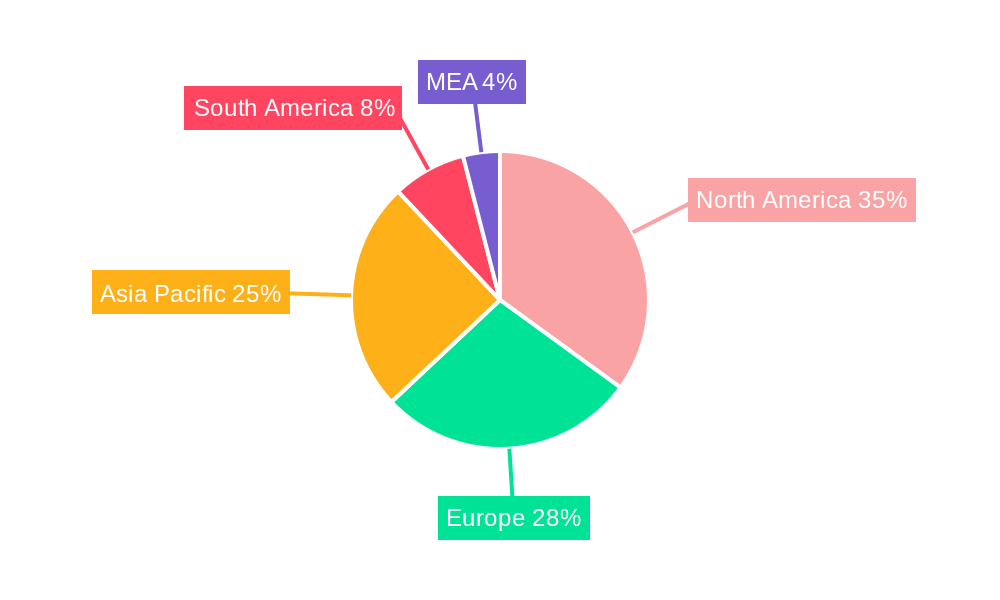
The precision farming market, valued at $13.11 billion in 2025, is experiencing robust growth, projected to expand at a compound annual growth rate (CAGR) of 12.70% from 2025 to 2033. This surge is driven by several key factors. Firstly, the increasing need for enhanced agricultural efficiency and productivity in the face of growing global food demand is a major catalyst. Farmers are increasingly adopting precision technologies to optimize resource utilization, minimize waste, and maximize yields. Secondly, technological advancements in areas like sensor technology, GPS, GIS, and data analytics are continuously improving the accuracy and effectiveness of precision farming tools. The integration of artificial intelligence and machine learning further enhances data analysis, leading to more informed decision-making and optimized farming practices. Finally, supportive government policies and initiatives promoting sustainable agriculture and technological adoption in many regions are also contributing to market expansion. The market is segmented by variable rate pesticide application methods (drones, UAVs, and other technologies), components (hardware, software, services), applications (yield monitoring, variable rate application, field mapping, etc.), and technologies (guidance systems, GIS, remote sensing). North America currently holds a significant market share due to high adoption rates and technological advancements, but the Asia-Pacific region is expected to witness substantial growth owing to increasing agricultural land and rising demand for food security.
Competition within the precision farming market is intense, with established players like John Deere, AGCO, and BASF alongside specialized precision agriculture technology providers. The market is likely to experience further consolidation as companies strategically acquire smaller firms to expand their product portfolios and technological capabilities. Potential challenges include the high initial investment cost of precision farming technologies, which may act as a barrier to entry for smaller farmers, and the need for reliable internet connectivity and skilled labor in data management and analysis. However, the long-term benefits of increased efficiency and profitability are likely to outweigh these challenges, resulting in sustained growth throughout the forecast period. The continued development of user-friendly software, affordable hardware, and accessible training programs will further accelerate market penetration and expansion, especially in developing economies.
Precision Farming Market: A Comprehensive Report (2019-2033)
This comprehensive report provides an in-depth analysis of the Precision Farming Market, offering invaluable insights for stakeholders across the agricultural technology sector. With a study period spanning 2019-2033, a base year of 2025, and a forecast period of 2025-2033, this report delivers a meticulous examination of market trends, competitive dynamics, and future growth prospects. The market is expected to reach xx Million by 2033, exhibiting a CAGR of xx% during the forecast period. This report is crucial for businesses seeking to capitalize on the expanding opportunities within this dynamic market.
Precision Farming Market Market Structure & Competitive Dynamics
The Precision Farming market is characterized by a moderately concentrated structure, with several key players holding significant market share. The market is witnessing considerable innovation, fueled by advancements in sensor technologies, data analytics, and AI-powered solutions. Regulatory frameworks, while varying across geographies, increasingly emphasize sustainable and efficient agricultural practices, creating both opportunities and challenges. Product substitutes, such as traditional farming methods, still exist, but their market share is steadily declining due to the demonstrable benefits of precision farming. End-user trends indicate a growing preference for data-driven decision-making, leading to increased adoption of precision farming technologies.
Mergers and acquisitions (M&A) activities are frequent, reflecting the intense competition and the pursuit of technological synergies. Recent significant deals include:
- Deere & Company's acquisition of Smart Apply Inc. (July 2023), valued at xx Million, demonstrates a strategic move to bolster its precision spraying capabilities.
- The partnership between AgEagle Aerial Systems Inc. and Wingtra AG (May 2023) showcases the growing integration of drone technology within precision farming solutions.
Market share distribution among key players:
- John Deere: xx%
- Lindsay Corporation: xx%
- Yara International ASA: xx%
- Other players: xx%
The average M&A deal value in the last 5 years was approximately xx Million, reflecting the substantial investment in the sector. This report will delve deeper into these dynamics providing a detailed competitive landscape analysis.
Precision Farming Market Industry Trends & Insights
The Precision Farming market is experiencing robust growth, driven by factors such as increasing demand for higher crop yields, rising awareness of resource efficiency, and government initiatives promoting sustainable agriculture. Technological advancements, including the development of more sophisticated sensors, GPS technology, and data analytics tools, are significantly impacting market growth. The adoption of drones and UAVs for various precision farming applications (variable rate pesticide application, crop monitoring, etc.) is accelerating, driven by their cost-effectiveness and efficiency. Consumer preferences are shifting towards precision farming solutions that offer enhanced data transparency, ease of use, and seamless integration with existing farm management systems. The competitive landscape is characterized by intense innovation, strategic alliances, and acquisitions, driving continuous improvements in product offerings and service capabilities. The market is witnessing a shift towards cloud-based solutions and data sharing platforms, fostering greater collaboration and knowledge sharing among farmers and industry stakeholders.
The market penetration of precision farming technologies varies across different regions and crops. In developed countries, the adoption rate is higher due to greater access to technology and infrastructure, while emerging markets are witnessing increased adoption rates, driven by rising agricultural productivity needs and government support programs.
Dominant Markets & Segments in Precision Farming Market
The North American region currently holds the largest market share within the global Precision Farming market. This dominance is driven by several factors:
- High level of agricultural mechanization: North America has a long history of technological adoption in agriculture.
- Strong government support: Policies and programs incentivize the adoption of precision farming technologies.
- Established technological infrastructure: Well-developed digital infrastructure facilitates easy adoption and data integration.
Key Drivers for the Dominance of North America
- High adoption rates due to technological advancements
- Favorable government policies and subsidies
- Strong technological infrastructure
- Large-scale farming operations
Within specific segments, the Variable Rate Application segment exhibits the highest growth rate, driven by the ability to optimize input usage and maximize yield. Hardware components, including sensors and GPS receivers, continue to dominate the component market, while software and service offerings are rapidly growing, driven by advancements in data analytics and farm management software. Yield monitoring remains a leading application, while soil monitoring and crop scouting are witnessing increased adoption. Guidance systems are the most prevalent technology, while the adoption of GIS and variable-rate technologies is growing steadily.
Other regions, such as Europe and Asia-Pacific, are also experiencing rapid growth. Europe has a strong focus on sustainable agriculture practices and environmental protection, stimulating the adoption of precision farming techniques. The Asia-Pacific region, characterized by a large agricultural population and increasing demand for food, is witnessing a surge in the implementation of precision farming technologies.
Precision Farming Market Product Innovations
Recent product innovations focus on integrating AI and machine learning capabilities into precision farming systems. This enables more accurate data analysis, predictive modeling of crop yields and disease risks, and optimized resource management. The market is also witnessing an increase in the development of user-friendly interfaces and cloud-based platforms, making precision farming technologies more accessible to farmers of all technical skill levels. These innovative solutions offer significant competitive advantages by enhancing efficiency, reducing costs, and increasing the overall sustainability of agricultural practices.
Report Segmentation & Scope
This report segments the Precision Farming market across several key parameters:
- By Variable Rate Pesticide Application: Drones and UAVs, Other Technologies. The drone segment is experiencing rapid growth due to its efficiency and versatility.
- By Component: Hardware (sensors, GPS receivers, etc.), Software (farm management software, data analytics platforms), Services (data analysis, consulting). Software and services are emerging as high-growth segments.
- By Application: Yield Monitoring, Variable Rate Application, Field Mapping, Soil Monitoring, Crop Scouting, Other Applications. Variable Rate Application is the fastest-growing application segment.
- By Technology: Guidance System, Global Information System (GIS): Remote Sensing, Variable-rate Technology. Guidance systems are widely adopted, while GIS and variable-rate technologies show increasing adoption rates.
Each segment's growth projections, market sizes, and competitive dynamics are thoroughly analyzed within the report.
Key Drivers of Precision Farming Market Growth
Technological advancements, specifically in sensor technology, data analytics, and AI, are key drivers. Economic incentives, such as government subsidies and cost savings from optimized resource use, further stimulate market growth. Rising demand for food production and the need for sustainable agricultural practices are also significant factors. Furthermore, favorable regulatory frameworks, promoting the adoption of precision farming technologies, accelerate market expansion.
Challenges in the Precision Farming Market Sector
High initial investment costs for precision farming technologies can be a barrier for some farmers, particularly in developing economies. Data security and privacy concerns related to the collection and use of farm data also represent significant challenges. The complexity of implementing and integrating various precision farming technologies can also present difficulties for farmers. Finally, competition from established players and the emergence of new entrants can make the market challenging for some players.
Leading Players in the Precision Farming Market Market
- Lindsay Corporation
- Yara International ASA
- AGCO Corporation
- BASF SE
- Land O'Lakes Inc
- Topcon Precision Agriculture
- TeeJet Technologies
- John Deere
- DICKEY-john Corporation
- Raven Industries Inc
- Ag Junction Inc
Key Developments in Precision Farming Market Sector
- July 2023: Deere & Company acquires Smart Apply Inc., expanding its precision spraying solutions.
- May 2023: AgEagle Aerial Systems Inc. announces a supply agreement with Wingtra AG for RedEdge-P sensor kits.
- February 2023: Murata and Sentinum launch the GAIA soil monitoring solution for smart agriculture.
Strategic Precision Farming Market Market Outlook
The Precision Farming market is poised for significant growth in the coming years, driven by ongoing technological advancements, increasing adoption rates, and supportive regulatory frameworks. Strategic opportunities lie in developing innovative solutions that address the specific needs of farmers in various regions and crop types. Investing in research and development to enhance the accuracy, efficiency, and affordability of precision farming technologies will be crucial for success. Furthermore, fostering collaborations and partnerships across the value chain can create synergistic opportunities and accelerate market expansion.
Precision Farming Market Segmentation
-
1. Technology
- 1.1. Guidance System
- 1.2. Remote Sensing
- 1.3. Variable-rate Technology
- 1.4. Drones and UAVs
- 1.5. Other Technologies
-
2. Component
- 2.1. Hardware
- 2.2. Software
- 2.3. Services
-
3. Application
- 3.1. Yield Monitoring
- 3.2. Variable Rate Application
- 3.3. Field Mapping
- 3.4. Soil Monitoring
- 3.5. Crop Scouting
- 3.6. Other Applications
Precision Farming Market Segmentation By Geography
-
1. North America
- 1.1. United States
- 1.2. Canada
-
2. Europe
- 2.1. Germany
- 2.2. United Kingdom
- 2.3. France
- 2.4. Rest of Europe
-
3. Asia Pacific
- 3.1. China
- 3.2. Japan
- 3.3. India
- 3.4. Australia
- 3.5. Rest of the Asia Pacific
- 4. Latin America
- 5. Middle East
Precision Farming Market REPORT HIGHLIGHTS
| Aspects | Details |
|---|---|
| Study Period | 2019-2033 |
| Base Year | 2024 |
| Estimated Year | 2025 |
| Forecast Period | 2025-2033 |
| Historical Period | 2019-2024 |
| Growth Rate | CAGR of 12.70% from 2019-2033 |
| Segmentation |
|
Table of Contents
- 1. Introduction
- 1.1. Research Scope
- 1.2. Market Segmentation
- 1.3. Research Methodology
- 1.4. Definitions and Assumptions
- 2. Executive Summary
- 2.1. Introduction
- 3. Market Dynamics
- 3.1. Introduction
- 3.2. Market Drivers
- 3.2.1. Soil Monitoring using AI and IOT technologies to drive the market; Emergence of New Technologies; Government Initiative and Increasing Number of Startups
- 3.3. Market Restrains
- 3.3.1. ; Relatively Low Awareness and Lack af Specialists Remain a Concern; High Initial Costs and Sluggish Penetration of Technology
- 3.4. Market Trends
- 3.4.1. Soil Monitoring is Expected to Hold Significant Share
- 4. Market Factor Analysis
- 4.1. Porters Five Forces
- 4.2. Supply/Value Chain
- 4.3. PESTEL analysis
- 4.4. Market Entropy
- 4.5. Patent/Trademark Analysis
- 5. Global Precision Farming Market Analysis, Insights and Forecast, 2019-2031
- 5.1. Market Analysis, Insights and Forecast - by Technology
- 5.1.1. Guidance System
- 5.1.2. Remote Sensing
- 5.1.3. Variable-rate Technology
- 5.1.4. Drones and UAVs
- 5.1.5. Other Technologies
- 5.2. Market Analysis, Insights and Forecast - by Component
- 5.2.1. Hardware
- 5.2.2. Software
- 5.2.3. Services
- 5.3. Market Analysis, Insights and Forecast - by Application
- 5.3.1. Yield Monitoring
- 5.3.2. Variable Rate Application
- 5.3.3. Field Mapping
- 5.3.4. Soil Monitoring
- 5.3.5. Crop Scouting
- 5.3.6. Other Applications
- 5.4. Market Analysis, Insights and Forecast - by Region
- 5.4.1. North America
- 5.4.2. Europe
- 5.4.3. Asia Pacific
- 5.4.4. Latin America
- 5.4.5. Middle East
- 5.1. Market Analysis, Insights and Forecast - by Technology
- 6. North America Precision Farming Market Analysis, Insights and Forecast, 2019-2031
- 6.1. Market Analysis, Insights and Forecast - by Technology
- 6.1.1. Guidance System
- 6.1.2. Remote Sensing
- 6.1.3. Variable-rate Technology
- 6.1.4. Drones and UAVs
- 6.1.5. Other Technologies
- 6.2. Market Analysis, Insights and Forecast - by Component
- 6.2.1. Hardware
- 6.2.2. Software
- 6.2.3. Services
- 6.3. Market Analysis, Insights and Forecast - by Application
- 6.3.1. Yield Monitoring
- 6.3.2. Variable Rate Application
- 6.3.3. Field Mapping
- 6.3.4. Soil Monitoring
- 6.3.5. Crop Scouting
- 6.3.6. Other Applications
- 6.1. Market Analysis, Insights and Forecast - by Technology
- 7. Europe Precision Farming Market Analysis, Insights and Forecast, 2019-2031
- 7.1. Market Analysis, Insights and Forecast - by Technology
- 7.1.1. Guidance System
- 7.1.2. Remote Sensing
- 7.1.3. Variable-rate Technology
- 7.1.4. Drones and UAVs
- 7.1.5. Other Technologies
- 7.2. Market Analysis, Insights and Forecast - by Component
- 7.2.1. Hardware
- 7.2.2. Software
- 7.2.3. Services
- 7.3. Market Analysis, Insights and Forecast - by Application
- 7.3.1. Yield Monitoring
- 7.3.2. Variable Rate Application
- 7.3.3. Field Mapping
- 7.3.4. Soil Monitoring
- 7.3.5. Crop Scouting
- 7.3.6. Other Applications
- 7.1. Market Analysis, Insights and Forecast - by Technology
- 8. Asia Pacific Precision Farming Market Analysis, Insights and Forecast, 2019-2031
- 8.1. Market Analysis, Insights and Forecast - by Technology
- 8.1.1. Guidance System
- 8.1.2. Remote Sensing
- 8.1.3. Variable-rate Technology
- 8.1.4. Drones and UAVs
- 8.1.5. Other Technologies
- 8.2. Market Analysis, Insights and Forecast - by Component
- 8.2.1. Hardware
- 8.2.2. Software
- 8.2.3. Services
- 8.3. Market Analysis, Insights and Forecast - by Application
- 8.3.1. Yield Monitoring
- 8.3.2. Variable Rate Application
- 8.3.3. Field Mapping
- 8.3.4. Soil Monitoring
- 8.3.5. Crop Scouting
- 8.3.6. Other Applications
- 8.1. Market Analysis, Insights and Forecast - by Technology
- 9. Latin America Precision Farming Market Analysis, Insights and Forecast, 2019-2031
- 9.1. Market Analysis, Insights and Forecast - by Technology
- 9.1.1. Guidance System
- 9.1.2. Remote Sensing
- 9.1.3. Variable-rate Technology
- 9.1.4. Drones and UAVs
- 9.1.5. Other Technologies
- 9.2. Market Analysis, Insights and Forecast - by Component
- 9.2.1. Hardware
- 9.2.2. Software
- 9.2.3. Services
- 9.3. Market Analysis, Insights and Forecast - by Application
- 9.3.1. Yield Monitoring
- 9.3.2. Variable Rate Application
- 9.3.3. Field Mapping
- 9.3.4. Soil Monitoring
- 9.3.5. Crop Scouting
- 9.3.6. Other Applications
- 9.1. Market Analysis, Insights and Forecast - by Technology
- 10. Middle East Precision Farming Market Analysis, Insights and Forecast, 2019-2031
- 10.1. Market Analysis, Insights and Forecast - by Technology
- 10.1.1. Guidance System
- 10.1.2. Remote Sensing
- 10.1.3. Variable-rate Technology
- 10.1.4. Drones and UAVs
- 10.1.5. Other Technologies
- 10.2. Market Analysis, Insights and Forecast - by Component
- 10.2.1. Hardware
- 10.2.2. Software
- 10.2.3. Services
- 10.3. Market Analysis, Insights and Forecast - by Application
- 10.3.1. Yield Monitoring
- 10.3.2. Variable Rate Application
- 10.3.3. Field Mapping
- 10.3.4. Soil Monitoring
- 10.3.5. Crop Scouting
- 10.3.6. Other Applications
- 10.1. Market Analysis, Insights and Forecast - by Technology
- 11. North America Precision Farming Market Analysis, Insights and Forecast, 2019-2031
- 11.1. Market Analysis, Insights and Forecast - By Country/Sub-region
- 11.1.1 United States
- 11.1.2 Canada
- 11.1.3 Mexico
- 12. Europe Precision Farming Market Analysis, Insights and Forecast, 2019-2031
- 12.1. Market Analysis, Insights and Forecast - By Country/Sub-region
- 12.1.1 Germany
- 12.1.2 United Kingdom
- 12.1.3 France
- 12.1.4 Spain
- 12.1.5 Italy
- 12.1.6 Spain
- 12.1.7 Belgium
- 12.1.8 Netherland
- 12.1.9 Nordics
- 12.1.10 Rest of Europe
- 13. Asia Pacific Precision Farming Market Analysis, Insights and Forecast, 2019-2031
- 13.1. Market Analysis, Insights and Forecast - By Country/Sub-region
- 13.1.1 China
- 13.1.2 Japan
- 13.1.3 India
- 13.1.4 South Korea
- 13.1.5 Southeast Asia
- 13.1.6 Australia
- 13.1.7 Indonesia
- 13.1.8 Phillipes
- 13.1.9 Singapore
- 13.1.10 Thailandc
- 13.1.11 Rest of Asia Pacific
- 14. South America Precision Farming Market Analysis, Insights and Forecast, 2019-2031
- 14.1. Market Analysis, Insights and Forecast - By Country/Sub-region
- 14.1.1 Brazil
- 14.1.2 Argentina
- 14.1.3 Peru
- 14.1.4 Chile
- 14.1.5 Colombia
- 14.1.6 Ecuador
- 14.1.7 Venezuela
- 14.1.8 Rest of South America
- 15. North America Precision Farming Market Analysis, Insights and Forecast, 2019-2031
- 15.1. Market Analysis, Insights and Forecast - By Country/Sub-region
- 15.1.1 United States
- 15.1.2 Canada
- 15.1.3 Mexico
- 16. MEA Precision Farming Market Analysis, Insights and Forecast, 2019-2031
- 16.1. Market Analysis, Insights and Forecast - By Country/Sub-region
- 16.1.1 United Arab Emirates
- 16.1.2 Saudi Arabia
- 16.1.3 South Africa
- 16.1.4 Rest of Middle East and Africa
- 17. Competitive Analysis
- 17.1. Global Market Share Analysis 2024
- 17.2. Company Profiles
- 17.2.1 Lindsay Corporation
- 17.2.1.1. Overview
- 17.2.1.2. Products
- 17.2.1.3. SWOT Analysis
- 17.2.1.4. Recent Developments
- 17.2.1.5. Financials (Based on Availability)
- 17.2.2 Yara International ASA
- 17.2.2.1. Overview
- 17.2.2.2. Products
- 17.2.2.3. SWOT Analysis
- 17.2.2.4. Recent Developments
- 17.2.2.5. Financials (Based on Availability)
- 17.2.3 AGCO Corporation
- 17.2.3.1. Overview
- 17.2.3.2. Products
- 17.2.3.3. SWOT Analysis
- 17.2.3.4. Recent Developments
- 17.2.3.5. Financials (Based on Availability)
- 17.2.4 BASF SE
- 17.2.4.1. Overview
- 17.2.4.2. Products
- 17.2.4.3. SWOT Analysis
- 17.2.4.4. Recent Developments
- 17.2.4.5. Financials (Based on Availability)
- 17.2.5 Land O'lakes Inc
- 17.2.5.1. Overview
- 17.2.5.2. Products
- 17.2.5.3. SWOT Analysis
- 17.2.5.4. Recent Developments
- 17.2.5.5. Financials (Based on Availability)
- 17.2.6 Topcon Precision Agriculture
- 17.2.6.1. Overview
- 17.2.6.2. Products
- 17.2.6.3. SWOT Analysis
- 17.2.6.4. Recent Developments
- 17.2.6.5. Financials (Based on Availability)
- 17.2.7 TeeJet Technologies
- 17.2.7.1. Overview
- 17.2.7.2. Products
- 17.2.7.3. SWOT Analysis
- 17.2.7.4. Recent Developments
- 17.2.7.5. Financials (Based on Availability)
- 17.2.8 John Deere
- 17.2.8.1. Overview
- 17.2.8.2. Products
- 17.2.8.3. SWOT Analysis
- 17.2.8.4. Recent Developments
- 17.2.8.5. Financials (Based on Availability)
- 17.2.9 DICKEY-john Corporation
- 17.2.9.1. Overview
- 17.2.9.2. Products
- 17.2.9.3. SWOT Analysis
- 17.2.9.4. Recent Developments
- 17.2.9.5. Financials (Based on Availability)
- 17.2.10 Raven Industries Inc
- 17.2.10.1. Overview
- 17.2.10.2. Products
- 17.2.10.3. SWOT Analysis
- 17.2.10.4. Recent Developments
- 17.2.10.5. Financials (Based on Availability)
- 17.2.11 Ag Junction Inc
- 17.2.11.1. Overview
- 17.2.11.2. Products
- 17.2.11.3. SWOT Analysis
- 17.2.11.4. Recent Developments
- 17.2.11.5. Financials (Based on Availability)
- 17.2.1 Lindsay Corporation
List of Figures
- Figure 1: Global Precision Farming Market Revenue Breakdown (Million, %) by Region 2024 & 2032
- Figure 2: Global Precision Farming Market Volume Breakdown (K Unit, %) by Region 2024 & 2032
- Figure 3: North America Precision Farming Market Revenue (Million), by Country 2024 & 2032
- Figure 4: North America Precision Farming Market Volume (K Unit), by Country 2024 & 2032
- Figure 5: North America Precision Farming Market Revenue Share (%), by Country 2024 & 2032
- Figure 6: North America Precision Farming Market Volume Share (%), by Country 2024 & 2032
- Figure 7: Europe Precision Farming Market Revenue (Million), by Country 2024 & 2032
- Figure 8: Europe Precision Farming Market Volume (K Unit), by Country 2024 & 2032
- Figure 9: Europe Precision Farming Market Revenue Share (%), by Country 2024 & 2032
- Figure 10: Europe Precision Farming Market Volume Share (%), by Country 2024 & 2032
- Figure 11: Asia Pacific Precision Farming Market Revenue (Million), by Country 2024 & 2032
- Figure 12: Asia Pacific Precision Farming Market Volume (K Unit), by Country 2024 & 2032
- Figure 13: Asia Pacific Precision Farming Market Revenue Share (%), by Country 2024 & 2032
- Figure 14: Asia Pacific Precision Farming Market Volume Share (%), by Country 2024 & 2032
- Figure 15: South America Precision Farming Market Revenue (Million), by Country 2024 & 2032
- Figure 16: South America Precision Farming Market Volume (K Unit), by Country 2024 & 2032
- Figure 17: South America Precision Farming Market Revenue Share (%), by Country 2024 & 2032
- Figure 18: South America Precision Farming Market Volume Share (%), by Country 2024 & 2032
- Figure 19: North America Precision Farming Market Revenue (Million), by Country 2024 & 2032
- Figure 20: North America Precision Farming Market Volume (K Unit), by Country 2024 & 2032
- Figure 21: North America Precision Farming Market Revenue Share (%), by Country 2024 & 2032
- Figure 22: North America Precision Farming Market Volume Share (%), by Country 2024 & 2032
- Figure 23: MEA Precision Farming Market Revenue (Million), by Country 2024 & 2032
- Figure 24: MEA Precision Farming Market Volume (K Unit), by Country 2024 & 2032
- Figure 25: MEA Precision Farming Market Revenue Share (%), by Country 2024 & 2032
- Figure 26: MEA Precision Farming Market Volume Share (%), by Country 2024 & 2032
- Figure 27: North America Precision Farming Market Revenue (Million), by Technology 2024 & 2032
- Figure 28: North America Precision Farming Market Volume (K Unit), by Technology 2024 & 2032
- Figure 29: North America Precision Farming Market Revenue Share (%), by Technology 2024 & 2032
- Figure 30: North America Precision Farming Market Volume Share (%), by Technology 2024 & 2032
- Figure 31: North America Precision Farming Market Revenue (Million), by Component 2024 & 2032
- Figure 32: North America Precision Farming Market Volume (K Unit), by Component 2024 & 2032
- Figure 33: North America Precision Farming Market Revenue Share (%), by Component 2024 & 2032
- Figure 34: North America Precision Farming Market Volume Share (%), by Component 2024 & 2032
- Figure 35: North America Precision Farming Market Revenue (Million), by Application 2024 & 2032
- Figure 36: North America Precision Farming Market Volume (K Unit), by Application 2024 & 2032
- Figure 37: North America Precision Farming Market Revenue Share (%), by Application 2024 & 2032
- Figure 38: North America Precision Farming Market Volume Share (%), by Application 2024 & 2032
- Figure 39: North America Precision Farming Market Revenue (Million), by Country 2024 & 2032
- Figure 40: North America Precision Farming Market Volume (K Unit), by Country 2024 & 2032
- Figure 41: North America Precision Farming Market Revenue Share (%), by Country 2024 & 2032
- Figure 42: North America Precision Farming Market Volume Share (%), by Country 2024 & 2032
- Figure 43: Europe Precision Farming Market Revenue (Million), by Technology 2024 & 2032
- Figure 44: Europe Precision Farming Market Volume (K Unit), by Technology 2024 & 2032
- Figure 45: Europe Precision Farming Market Revenue Share (%), by Technology 2024 & 2032
- Figure 46: Europe Precision Farming Market Volume Share (%), by Technology 2024 & 2032
- Figure 47: Europe Precision Farming Market Revenue (Million), by Component 2024 & 2032
- Figure 48: Europe Precision Farming Market Volume (K Unit), by Component 2024 & 2032
- Figure 49: Europe Precision Farming Market Revenue Share (%), by Component 2024 & 2032
- Figure 50: Europe Precision Farming Market Volume Share (%), by Component 2024 & 2032
- Figure 51: Europe Precision Farming Market Revenue (Million), by Application 2024 & 2032
- Figure 52: Europe Precision Farming Market Volume (K Unit), by Application 2024 & 2032
- Figure 53: Europe Precision Farming Market Revenue Share (%), by Application 2024 & 2032
- Figure 54: Europe Precision Farming Market Volume Share (%), by Application 2024 & 2032
- Figure 55: Europe Precision Farming Market Revenue (Million), by Country 2024 & 2032
- Figure 56: Europe Precision Farming Market Volume (K Unit), by Country 2024 & 2032
- Figure 57: Europe Precision Farming Market Revenue Share (%), by Country 2024 & 2032
- Figure 58: Europe Precision Farming Market Volume Share (%), by Country 2024 & 2032
- Figure 59: Asia Pacific Precision Farming Market Revenue (Million), by Technology 2024 & 2032
- Figure 60: Asia Pacific Precision Farming Market Volume (K Unit), by Technology 2024 & 2032
- Figure 61: Asia Pacific Precision Farming Market Revenue Share (%), by Technology 2024 & 2032
- Figure 62: Asia Pacific Precision Farming Market Volume Share (%), by Technology 2024 & 2032
- Figure 63: Asia Pacific Precision Farming Market Revenue (Million), by Component 2024 & 2032
- Figure 64: Asia Pacific Precision Farming Market Volume (K Unit), by Component 2024 & 2032
- Figure 65: Asia Pacific Precision Farming Market Revenue Share (%), by Component 2024 & 2032
- Figure 66: Asia Pacific Precision Farming Market Volume Share (%), by Component 2024 & 2032
- Figure 67: Asia Pacific Precision Farming Market Revenue (Million), by Application 2024 & 2032
- Figure 68: Asia Pacific Precision Farming Market Volume (K Unit), by Application 2024 & 2032
- Figure 69: Asia Pacific Precision Farming Market Revenue Share (%), by Application 2024 & 2032
- Figure 70: Asia Pacific Precision Farming Market Volume Share (%), by Application 2024 & 2032
- Figure 71: Asia Pacific Precision Farming Market Revenue (Million), by Country 2024 & 2032
- Figure 72: Asia Pacific Precision Farming Market Volume (K Unit), by Country 2024 & 2032
- Figure 73: Asia Pacific Precision Farming Market Revenue Share (%), by Country 2024 & 2032
- Figure 74: Asia Pacific Precision Farming Market Volume Share (%), by Country 2024 & 2032
- Figure 75: Latin America Precision Farming Market Revenue (Million), by Technology 2024 & 2032
- Figure 76: Latin America Precision Farming Market Volume (K Unit), by Technology 2024 & 2032
- Figure 77: Latin America Precision Farming Market Revenue Share (%), by Technology 2024 & 2032
- Figure 78: Latin America Precision Farming Market Volume Share (%), by Technology 2024 & 2032
- Figure 79: Latin America Precision Farming Market Revenue (Million), by Component 2024 & 2032
- Figure 80: Latin America Precision Farming Market Volume (K Unit), by Component 2024 & 2032
- Figure 81: Latin America Precision Farming Market Revenue Share (%), by Component 2024 & 2032
- Figure 82: Latin America Precision Farming Market Volume Share (%), by Component 2024 & 2032
- Figure 83: Latin America Precision Farming Market Revenue (Million), by Application 2024 & 2032
- Figure 84: Latin America Precision Farming Market Volume (K Unit), by Application 2024 & 2032
- Figure 85: Latin America Precision Farming Market Revenue Share (%), by Application 2024 & 2032
- Figure 86: Latin America Precision Farming Market Volume Share (%), by Application 2024 & 2032
- Figure 87: Latin America Precision Farming Market Revenue (Million), by Country 2024 & 2032
- Figure 88: Latin America Precision Farming Market Volume (K Unit), by Country 2024 & 2032
- Figure 89: Latin America Precision Farming Market Revenue Share (%), by Country 2024 & 2032
- Figure 90: Latin America Precision Farming Market Volume Share (%), by Country 2024 & 2032
- Figure 91: Middle East Precision Farming Market Revenue (Million), by Technology 2024 & 2032
- Figure 92: Middle East Precision Farming Market Volume (K Unit), by Technology 2024 & 2032
- Figure 93: Middle East Precision Farming Market Revenue Share (%), by Technology 2024 & 2032
- Figure 94: Middle East Precision Farming Market Volume Share (%), by Technology 2024 & 2032
- Figure 95: Middle East Precision Farming Market Revenue (Million), by Component 2024 & 2032
- Figure 96: Middle East Precision Farming Market Volume (K Unit), by Component 2024 & 2032
- Figure 97: Middle East Precision Farming Market Revenue Share (%), by Component 2024 & 2032
- Figure 98: Middle East Precision Farming Market Volume Share (%), by Component 2024 & 2032
- Figure 99: Middle East Precision Farming Market Revenue (Million), by Application 2024 & 2032
- Figure 100: Middle East Precision Farming Market Volume (K Unit), by Application 2024 & 2032
- Figure 101: Middle East Precision Farming Market Revenue Share (%), by Application 2024 & 2032
- Figure 102: Middle East Precision Farming Market Volume Share (%), by Application 2024 & 2032
- Figure 103: Middle East Precision Farming Market Revenue (Million), by Country 2024 & 2032
- Figure 104: Middle East Precision Farming Market Volume (K Unit), by Country 2024 & 2032
- Figure 105: Middle East Precision Farming Market Revenue Share (%), by Country 2024 & 2032
- Figure 106: Middle East Precision Farming Market Volume Share (%), by Country 2024 & 2032
List of Tables
- Table 1: Global Precision Farming Market Revenue Million Forecast, by Region 2019 & 2032
- Table 2: Global Precision Farming Market Volume K Unit Forecast, by Region 2019 & 2032
- Table 3: Global Precision Farming Market Revenue Million Forecast, by Technology 2019 & 2032
- Table 4: Global Precision Farming Market Volume K Unit Forecast, by Technology 2019 & 2032
- Table 5: Global Precision Farming Market Revenue Million Forecast, by Component 2019 & 2032
- Table 6: Global Precision Farming Market Volume K Unit Forecast, by Component 2019 & 2032
- Table 7: Global Precision Farming Market Revenue Million Forecast, by Application 2019 & 2032
- Table 8: Global Precision Farming Market Volume K Unit Forecast, by Application 2019 & 2032
- Table 9: Global Precision Farming Market Revenue Million Forecast, by Region 2019 & 2032
- Table 10: Global Precision Farming Market Volume K Unit Forecast, by Region 2019 & 2032
- Table 11: Global Precision Farming Market Revenue Million Forecast, by Country 2019 & 2032
- Table 12: Global Precision Farming Market Volume K Unit Forecast, by Country 2019 & 2032
- Table 13: United States Precision Farming Market Revenue (Million) Forecast, by Application 2019 & 2032
- Table 14: United States Precision Farming Market Volume (K Unit) Forecast, by Application 2019 & 2032
- Table 15: Canada Precision Farming Market Revenue (Million) Forecast, by Application 2019 & 2032
- Table 16: Canada Precision Farming Market Volume (K Unit) Forecast, by Application 2019 & 2032
- Table 17: Mexico Precision Farming Market Revenue (Million) Forecast, by Application 2019 & 2032
- Table 18: Mexico Precision Farming Market Volume (K Unit) Forecast, by Application 2019 & 2032
- Table 19: Global Precision Farming Market Revenue Million Forecast, by Country 2019 & 2032
- Table 20: Global Precision Farming Market Volume K Unit Forecast, by Country 2019 & 2032
- Table 21: Germany Precision Farming Market Revenue (Million) Forecast, by Application 2019 & 2032
- Table 22: Germany Precision Farming Market Volume (K Unit) Forecast, by Application 2019 & 2032
- Table 23: United Kingdom Precision Farming Market Revenue (Million) Forecast, by Application 2019 & 2032
- Table 24: United Kingdom Precision Farming Market Volume (K Unit) Forecast, by Application 2019 & 2032
- Table 25: France Precision Farming Market Revenue (Million) Forecast, by Application 2019 & 2032
- Table 26: France Precision Farming Market Volume (K Unit) Forecast, by Application 2019 & 2032
- Table 27: Spain Precision Farming Market Revenue (Million) Forecast, by Application 2019 & 2032
- Table 28: Spain Precision Farming Market Volume (K Unit) Forecast, by Application 2019 & 2032
- Table 29: Italy Precision Farming Market Revenue (Million) Forecast, by Application 2019 & 2032
- Table 30: Italy Precision Farming Market Volume (K Unit) Forecast, by Application 2019 & 2032
- Table 31: Spain Precision Farming Market Revenue (Million) Forecast, by Application 2019 & 2032
- Table 32: Spain Precision Farming Market Volume (K Unit) Forecast, by Application 2019 & 2032
- Table 33: Belgium Precision Farming Market Revenue (Million) Forecast, by Application 2019 & 2032
- Table 34: Belgium Precision Farming Market Volume (K Unit) Forecast, by Application 2019 & 2032
- Table 35: Netherland Precision Farming Market Revenue (Million) Forecast, by Application 2019 & 2032
- Table 36: Netherland Precision Farming Market Volume (K Unit) Forecast, by Application 2019 & 2032
- Table 37: Nordics Precision Farming Market Revenue (Million) Forecast, by Application 2019 & 2032
- Table 38: Nordics Precision Farming Market Volume (K Unit) Forecast, by Application 2019 & 2032
- Table 39: Rest of Europe Precision Farming Market Revenue (Million) Forecast, by Application 2019 & 2032
- Table 40: Rest of Europe Precision Farming Market Volume (K Unit) Forecast, by Application 2019 & 2032
- Table 41: Global Precision Farming Market Revenue Million Forecast, by Country 2019 & 2032
- Table 42: Global Precision Farming Market Volume K Unit Forecast, by Country 2019 & 2032
- Table 43: China Precision Farming Market Revenue (Million) Forecast, by Application 2019 & 2032
- Table 44: China Precision Farming Market Volume (K Unit) Forecast, by Application 2019 & 2032
- Table 45: Japan Precision Farming Market Revenue (Million) Forecast, by Application 2019 & 2032
- Table 46: Japan Precision Farming Market Volume (K Unit) Forecast, by Application 2019 & 2032
- Table 47: India Precision Farming Market Revenue (Million) Forecast, by Application 2019 & 2032
- Table 48: India Precision Farming Market Volume (K Unit) Forecast, by Application 2019 & 2032
- Table 49: South Korea Precision Farming Market Revenue (Million) Forecast, by Application 2019 & 2032
- Table 50: South Korea Precision Farming Market Volume (K Unit) Forecast, by Application 2019 & 2032
- Table 51: Southeast Asia Precision Farming Market Revenue (Million) Forecast, by Application 2019 & 2032
- Table 52: Southeast Asia Precision Farming Market Volume (K Unit) Forecast, by Application 2019 & 2032
- Table 53: Australia Precision Farming Market Revenue (Million) Forecast, by Application 2019 & 2032
- Table 54: Australia Precision Farming Market Volume (K Unit) Forecast, by Application 2019 & 2032
- Table 55: Indonesia Precision Farming Market Revenue (Million) Forecast, by Application 2019 & 2032
- Table 56: Indonesia Precision Farming Market Volume (K Unit) Forecast, by Application 2019 & 2032
- Table 57: Phillipes Precision Farming Market Revenue (Million) Forecast, by Application 2019 & 2032
- Table 58: Phillipes Precision Farming Market Volume (K Unit) Forecast, by Application 2019 & 2032
- Table 59: Singapore Precision Farming Market Revenue (Million) Forecast, by Application 2019 & 2032
- Table 60: Singapore Precision Farming Market Volume (K Unit) Forecast, by Application 2019 & 2032
- Table 61: Thailandc Precision Farming Market Revenue (Million) Forecast, by Application 2019 & 2032
- Table 62: Thailandc Precision Farming Market Volume (K Unit) Forecast, by Application 2019 & 2032
- Table 63: Rest of Asia Pacific Precision Farming Market Revenue (Million) Forecast, by Application 2019 & 2032
- Table 64: Rest of Asia Pacific Precision Farming Market Volume (K Unit) Forecast, by Application 2019 & 2032
- Table 65: Global Precision Farming Market Revenue Million Forecast, by Country 2019 & 2032
- Table 66: Global Precision Farming Market Volume K Unit Forecast, by Country 2019 & 2032
- Table 67: Brazil Precision Farming Market Revenue (Million) Forecast, by Application 2019 & 2032
- Table 68: Brazil Precision Farming Market Volume (K Unit) Forecast, by Application 2019 & 2032
- Table 69: Argentina Precision Farming Market Revenue (Million) Forecast, by Application 2019 & 2032
- Table 70: Argentina Precision Farming Market Volume (K Unit) Forecast, by Application 2019 & 2032
- Table 71: Peru Precision Farming Market Revenue (Million) Forecast, by Application 2019 & 2032
- Table 72: Peru Precision Farming Market Volume (K Unit) Forecast, by Application 2019 & 2032
- Table 73: Chile Precision Farming Market Revenue (Million) Forecast, by Application 2019 & 2032
- Table 74: Chile Precision Farming Market Volume (K Unit) Forecast, by Application 2019 & 2032
- Table 75: Colombia Precision Farming Market Revenue (Million) Forecast, by Application 2019 & 2032
- Table 76: Colombia Precision Farming Market Volume (K Unit) Forecast, by Application 2019 & 2032
- Table 77: Ecuador Precision Farming Market Revenue (Million) Forecast, by Application 2019 & 2032
- Table 78: Ecuador Precision Farming Market Volume (K Unit) Forecast, by Application 2019 & 2032
- Table 79: Venezuela Precision Farming Market Revenue (Million) Forecast, by Application 2019 & 2032
- Table 80: Venezuela Precision Farming Market Volume (K Unit) Forecast, by Application 2019 & 2032
- Table 81: Rest of South America Precision Farming Market Revenue (Million) Forecast, by Application 2019 & 2032
- Table 82: Rest of South America Precision Farming Market Volume (K Unit) Forecast, by Application 2019 & 2032
- Table 83: Global Precision Farming Market Revenue Million Forecast, by Country 2019 & 2032
- Table 84: Global Precision Farming Market Volume K Unit Forecast, by Country 2019 & 2032
- Table 85: United States Precision Farming Market Revenue (Million) Forecast, by Application 2019 & 2032
- Table 86: United States Precision Farming Market Volume (K Unit) Forecast, by Application 2019 & 2032
- Table 87: Canada Precision Farming Market Revenue (Million) Forecast, by Application 2019 & 2032
- Table 88: Canada Precision Farming Market Volume (K Unit) Forecast, by Application 2019 & 2032
- Table 89: Mexico Precision Farming Market Revenue (Million) Forecast, by Application 2019 & 2032
- Table 90: Mexico Precision Farming Market Volume (K Unit) Forecast, by Application 2019 & 2032
- Table 91: Global Precision Farming Market Revenue Million Forecast, by Country 2019 & 2032
- Table 92: Global Precision Farming Market Volume K Unit Forecast, by Country 2019 & 2032
- Table 93: United Arab Emirates Precision Farming Market Revenue (Million) Forecast, by Application 2019 & 2032
- Table 94: United Arab Emirates Precision Farming Market Volume (K Unit) Forecast, by Application 2019 & 2032
- Table 95: Saudi Arabia Precision Farming Market Revenue (Million) Forecast, by Application 2019 & 2032
- Table 96: Saudi Arabia Precision Farming Market Volume (K Unit) Forecast, by Application 2019 & 2032
- Table 97: South Africa Precision Farming Market Revenue (Million) Forecast, by Application 2019 & 2032
- Table 98: South Africa Precision Farming Market Volume (K Unit) Forecast, by Application 2019 & 2032
- Table 99: Rest of Middle East and Africa Precision Farming Market Revenue (Million) Forecast, by Application 2019 & 2032
- Table 100: Rest of Middle East and Africa Precision Farming Market Volume (K Unit) Forecast, by Application 2019 & 2032
- Table 101: Global Precision Farming Market Revenue Million Forecast, by Technology 2019 & 2032
- Table 102: Global Precision Farming Market Volume K Unit Forecast, by Technology 2019 & 2032
- Table 103: Global Precision Farming Market Revenue Million Forecast, by Component 2019 & 2032
- Table 104: Global Precision Farming Market Volume K Unit Forecast, by Component 2019 & 2032
- Table 105: Global Precision Farming Market Revenue Million Forecast, by Application 2019 & 2032
- Table 106: Global Precision Farming Market Volume K Unit Forecast, by Application 2019 & 2032
- Table 107: Global Precision Farming Market Revenue Million Forecast, by Country 2019 & 2032
- Table 108: Global Precision Farming Market Volume K Unit Forecast, by Country 2019 & 2032
- Table 109: United States Precision Farming Market Revenue (Million) Forecast, by Application 2019 & 2032
- Table 110: United States Precision Farming Market Volume (K Unit) Forecast, by Application 2019 & 2032
- Table 111: Canada Precision Farming Market Revenue (Million) Forecast, by Application 2019 & 2032
- Table 112: Canada Precision Farming Market Volume (K Unit) Forecast, by Application 2019 & 2032
- Table 113: Global Precision Farming Market Revenue Million Forecast, by Technology 2019 & 2032
- Table 114: Global Precision Farming Market Volume K Unit Forecast, by Technology 2019 & 2032
- Table 115: Global Precision Farming Market Revenue Million Forecast, by Component 2019 & 2032
- Table 116: Global Precision Farming Market Volume K Unit Forecast, by Component 2019 & 2032
- Table 117: Global Precision Farming Market Revenue Million Forecast, by Application 2019 & 2032
- Table 118: Global Precision Farming Market Volume K Unit Forecast, by Application 2019 & 2032
- Table 119: Global Precision Farming Market Revenue Million Forecast, by Country 2019 & 2032
- Table 120: Global Precision Farming Market Volume K Unit Forecast, by Country 2019 & 2032
- Table 121: Germany Precision Farming Market Revenue (Million) Forecast, by Application 2019 & 2032
- Table 122: Germany Precision Farming Market Volume (K Unit) Forecast, by Application 2019 & 2032
- Table 123: United Kingdom Precision Farming Market Revenue (Million) Forecast, by Application 2019 & 2032
- Table 124: United Kingdom Precision Farming Market Volume (K Unit) Forecast, by Application 2019 & 2032
- Table 125: France Precision Farming Market Revenue (Million) Forecast, by Application 2019 & 2032
- Table 126: France Precision Farming Market Volume (K Unit) Forecast, by Application 2019 & 2032
- Table 127: Rest of Europe Precision Farming Market Revenue (Million) Forecast, by Application 2019 & 2032
- Table 128: Rest of Europe Precision Farming Market Volume (K Unit) Forecast, by Application 2019 & 2032
- Table 129: Global Precision Farming Market Revenue Million Forecast, by Technology 2019 & 2032
- Table 130: Global Precision Farming Market Volume K Unit Forecast, by Technology 2019 & 2032
- Table 131: Global Precision Farming Market Revenue Million Forecast, by Component 2019 & 2032
- Table 132: Global Precision Farming Market Volume K Unit Forecast, by Component 2019 & 2032
- Table 133: Global Precision Farming Market Revenue Million Forecast, by Application 2019 & 2032
- Table 134: Global Precision Farming Market Volume K Unit Forecast, by Application 2019 & 2032
- Table 135: Global Precision Farming Market Revenue Million Forecast, by Country 2019 & 2032
- Table 136: Global Precision Farming Market Volume K Unit Forecast, by Country 2019 & 2032
- Table 137: China Precision Farming Market Revenue (Million) Forecast, by Application 2019 & 2032
- Table 138: China Precision Farming Market Volume (K Unit) Forecast, by Application 2019 & 2032
- Table 139: Japan Precision Farming Market Revenue (Million) Forecast, by Application 2019 & 2032
- Table 140: Japan Precision Farming Market Volume (K Unit) Forecast, by Application 2019 & 2032
- Table 141: India Precision Farming Market Revenue (Million) Forecast, by Application 2019 & 2032
- Table 142: India Precision Farming Market Volume (K Unit) Forecast, by Application 2019 & 2032
- Table 143: Australia Precision Farming Market Revenue (Million) Forecast, by Application 2019 & 2032
- Table 144: Australia Precision Farming Market Volume (K Unit) Forecast, by Application 2019 & 2032
- Table 145: Rest of the Asia Pacific Precision Farming Market Revenue (Million) Forecast, by Application 2019 & 2032
- Table 146: Rest of the Asia Pacific Precision Farming Market Volume (K Unit) Forecast, by Application 2019 & 2032
- Table 147: Global Precision Farming Market Revenue Million Forecast, by Technology 2019 & 2032
- Table 148: Global Precision Farming Market Volume K Unit Forecast, by Technology 2019 & 2032
- Table 149: Global Precision Farming Market Revenue Million Forecast, by Component 2019 & 2032
- Table 150: Global Precision Farming Market Volume K Unit Forecast, by Component 2019 & 2032
- Table 151: Global Precision Farming Market Revenue Million Forecast, by Application 2019 & 2032
- Table 152: Global Precision Farming Market Volume K Unit Forecast, by Application 2019 & 2032
- Table 153: Global Precision Farming Market Revenue Million Forecast, by Country 2019 & 2032
- Table 154: Global Precision Farming Market Volume K Unit Forecast, by Country 2019 & 2032
- Table 155: Global Precision Farming Market Revenue Million Forecast, by Technology 2019 & 2032
- Table 156: Global Precision Farming Market Volume K Unit Forecast, by Technology 2019 & 2032
- Table 157: Global Precision Farming Market Revenue Million Forecast, by Component 2019 & 2032
- Table 158: Global Precision Farming Market Volume K Unit Forecast, by Component 2019 & 2032
- Table 159: Global Precision Farming Market Revenue Million Forecast, by Application 2019 & 2032
- Table 160: Global Precision Farming Market Volume K Unit Forecast, by Application 2019 & 2032
- Table 161: Global Precision Farming Market Revenue Million Forecast, by Country 2019 & 2032
- Table 162: Global Precision Farming Market Volume K Unit Forecast, by Country 2019 & 2032
Frequently Asked Questions
1. What is the projected Compound Annual Growth Rate (CAGR) of the Precision Farming Market?
The projected CAGR is approximately 12.70%.
2. Which companies are prominent players in the Precision Farming Market?
Key companies in the market include Lindsay Corporation, Yara International ASA, AGCO Corporation, BASF SE, Land O'lakes Inc, Topcon Precision Agriculture, TeeJet Technologies, John Deere, DICKEY-john Corporation, Raven Industries Inc, Ag Junction Inc.
3. What are the main segments of the Precision Farming Market?
The market segments include Technology, Component, Application.
4. Can you provide details about the market size?
The market size is estimated to be USD 13.11 Million as of 2022.
5. What are some drivers contributing to market growth?
Soil Monitoring using AI and IOT technologies to drive the market; Emergence of New Technologies; Government Initiative and Increasing Number of Startups.
6. What are the notable trends driving market growth?
Soil Monitoring is Expected to Hold Significant Share.
7. Are there any restraints impacting market growth?
; Relatively Low Awareness and Lack af Specialists Remain a Concern; High Initial Costs and Sluggish Penetration of Technology.
8. Can you provide examples of recent developments in the market?
In July 2023, The acquisition of Smart Apply Inc., a provider of agricultural technology solutions, has been announced by Deere & Company, In order to assist farmers in dealing with the challenges of regulatory requirements, input costs, labour etc., Deere & Company is focusing on using Smart ApplyTM precision spraying solutions. The acquisition is intended to boost the company's new customer base.
9. What pricing options are available for accessing the report?
Pricing options include single-user, multi-user, and enterprise licenses priced at USD 4750, USD 5250, and USD 8750 respectively.
10. Is the market size provided in terms of value or volume?
The market size is provided in terms of value, measured in Million and volume, measured in K Unit.
11. Are there any specific market keywords associated with the report?
Yes, the market keyword associated with the report is "Precision Farming Market," which aids in identifying and referencing the specific market segment covered.
12. How do I determine which pricing option suits my needs best?
The pricing options vary based on user requirements and access needs. Individual users may opt for single-user licenses, while businesses requiring broader access may choose multi-user or enterprise licenses for cost-effective access to the report.
13. Are there any additional resources or data provided in the Precision Farming Market report?
While the report offers comprehensive insights, it's advisable to review the specific contents or supplementary materials provided to ascertain if additional resources or data are available.
14. How can I stay updated on further developments or reports in the Precision Farming Market?
To stay informed about further developments, trends, and reports in the Precision Farming Market, consider subscribing to industry newsletters, following relevant companies and organizations, or regularly checking reputable industry news sources and publications.
Methodology
Step 1 - Identification of Relevant Samples Size from Population Database


Step 2 - Approaches for Defining Global Market Size (Value, Volume* & Price*)

Note*: In applicable scenarios
Step 3 - Data Sources
Primary Research
- Web Analytics
- Survey Reports
- Research Institute
- Latest Research Reports
- Opinion Leaders
Secondary Research
- Annual Reports
- White Paper
- Latest Press Release
- Industry Association
- Paid Database
- Investor Presentations

Step 4 - Data Triangulation
Involves using different sources of information in order to increase the validity of a study
These sources are likely to be stakeholders in a program - participants, other researchers, program staff, other community members, and so on.
Then we put all data in single framework & apply various statistical tools to find out the dynamic on the market.
During the analysis stage, feedback from the stakeholder groups would be compared to determine areas of agreement as well as areas of divergence


