
Key Insights
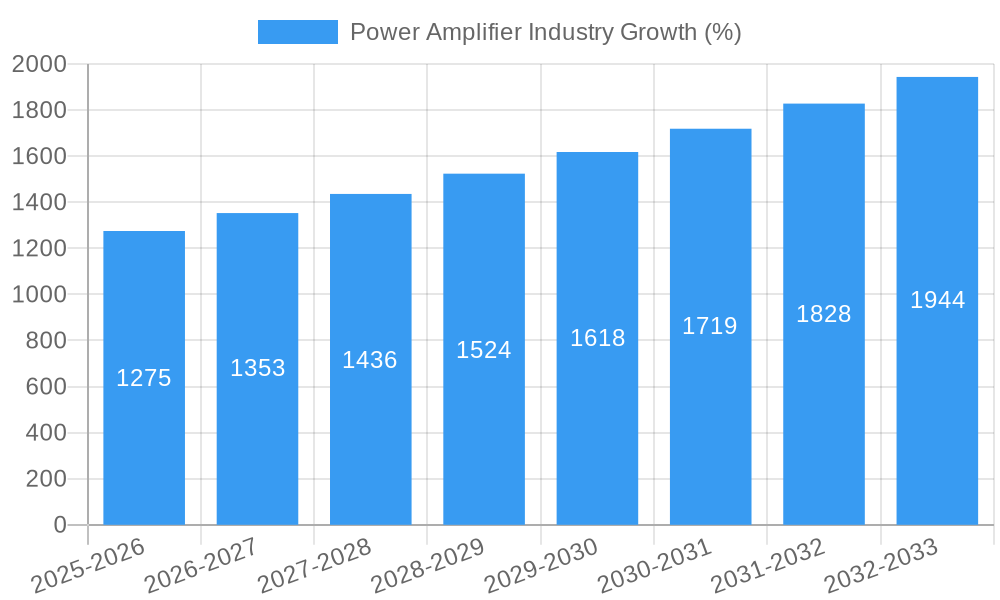
The power amplifier market, currently exhibiting robust growth, is projected to reach a substantial size in the coming years. Driven by the increasing demand for high-speed data transmission in 5G networks, the proliferation of smart devices, and the rapid expansion of the electric vehicle (EV) sector, this market segment shows considerable promise. The 8.50% CAGR indicates a sustained period of expansion, with key industry verticals like consumer electronics and telecommunications acting as major growth catalysts. Technological advancements leading to higher efficiency, smaller form factors, and improved power handling capabilities are further fueling market expansion. While component shortages and supply chain disruptions may pose some temporary challenges, the long-term outlook remains positive, particularly considering the ongoing integration of power amplifiers into various applications, including advanced driver-assistance systems (ADAS) in automobiles and industrial automation systems.
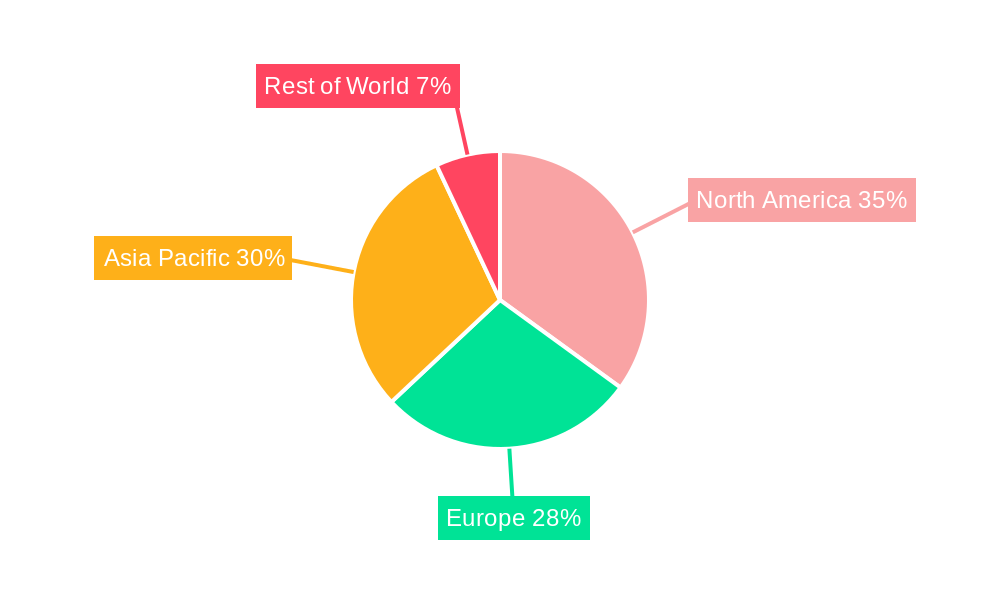
Competition within the power amplifier market is fierce, with established players like Infineon Technologies AG, Broadcom Limited, and NXP Semiconductor vying for market share alongside other significant manufacturers. Regional growth is expected to be diverse, with North America and Asia-Pacific acting as key markets. The continued growth of data centers, the rising adoption of Internet of Things (IoT) devices, and the escalating demand for higher bandwidth in wireless communication are expected to create significant growth opportunities. However, manufacturers must navigate challenges such as stringent regulatory requirements, increasing competition, and ensuring stable supply chains to fully capitalize on the market's potential. Strategic partnerships, technological innovation, and a focus on cost-optimization will likely be crucial for success in this dynamic market. The market's segmentation by industry vertical allows for a targeted approach to address specific application needs, fostering further growth.

Power Amplifier Industry Market Report: 2019-2033
This comprehensive report provides a detailed analysis of the Power Amplifier industry, offering valuable insights into market dynamics, competitive landscapes, and future growth prospects. Covering the period from 2019 to 2033, with a base year of 2025 and a forecast period of 2025-2033, this report is an essential resource for industry professionals, investors, and strategists seeking to navigate this rapidly evolving sector. The global market size reached xx Million in 2024 and is projected to reach xx Million by 2033, exhibiting a robust CAGR of xx%.
Power Amplifier Industry Market Structure & Competitive Dynamics
The Power Amplifier market is characterized by a moderately concentrated structure, with several key players holding significant market share. Infineon Technologies AG, Broadcom Limited, NXP Semiconductor, and Texas Instruments Incorporated are among the leading companies, collectively accounting for an estimated xx% of the global market in 2024. However, the market also features a number of smaller, specialized players, particularly in niche segments.
Innovation ecosystems are crucial, with ongoing R&D investments driving advancements in efficiency, power output, and integration. Regulatory frameworks, particularly concerning electromagnetic interference (EMI) and energy efficiency, significantly impact product design and market access. Product substitutes, such as alternative amplification technologies, pose a moderate competitive threat, though the established dominance of power amplifiers in many applications remains strong.
End-user trends, particularly the growing adoption of 5G technology and the expansion of the Internet of Things (IoT), are key growth drivers. Mergers and acquisitions (M&A) activities have been relatively frequent, with deal values in the past five years totaling an estimated xx Million. These activities often aim to consolidate market share, expand product portfolios, or acquire specialized technologies.
- Market Concentration: Moderately concentrated, with top players holding xx% market share (2024).
- M&A Activity: Significant activity in recent years, with total deal values exceeding xx Million.
- Innovation Ecosystems: Robust R&D investment driving advancements in efficiency and performance.
- Regulatory Landscape: Stringent regulations impacting product design and market access.
Power Amplifier Industry Industry Trends & Insights
The Power Amplifier market is experiencing significant growth driven by several key factors. The widespread adoption of 5G and the expanding IoT ecosystem are major catalysts, demanding higher power and more efficient amplifiers. Technological disruptions, such as the development of GaN (Gallium Nitride) and SiC (Silicon Carbide) based amplifiers, are enhancing performance and efficiency, leading to increased market penetration. Consumer preferences are shifting towards smaller, more energy-efficient devices, placing pressure on manufacturers to innovate. Competitive dynamics are intense, with companies focusing on cost reduction, improved performance, and strategic partnerships to maintain market share.
The market's CAGR is projected at xx% from 2025-2033, fueled by increasing demand from various sectors. Market penetration within emerging markets, particularly in Asia-Pacific, is a significant growth opportunity. The shift toward higher frequency applications, like millimeter-wave (mmWave) communication, will continue to drive demand for advanced power amplifiers. The growing need for high-power amplifiers in electric vehicles and renewable energy infrastructure is also contributing to market growth. Furthermore, the increasing demand for high-performance amplifiers in defense and aerospace applications offers significant potential for future expansion.
Dominant Markets & Segments in Power Amplifier Industry
The Telecommunication segment currently dominates the Power Amplifier market, driven by the rapid expansion of 5G networks globally. This sector is characterized by high demand for high-power, high-efficiency amplifiers capable of handling the increased data throughput of 5G. The Automotive sector is experiencing rapid growth due to the proliferation of advanced driver-assistance systems (ADAS) and the rising adoption of electric vehicles.
- Telecommunication: Dominates the market due to 5G infrastructure deployment.
- Key Drivers: 5G network expansion, increasing data traffic, demand for higher power amplifiers.
- Automotive: Rapid growth driven by ADAS and electric vehicles.
- Key Drivers: Growing adoption of electric vehicles, increased use of advanced driver-assistance systems (ADAS).
- Consumer Electronics: Steady growth fueled by smartphones and other portable devices.
- Key Drivers: Increased demand for energy-efficient amplifiers in smartphones, tablets, and wearable devices.
- Industrial: Moderate growth driven by automation and industrial IoT applications.
- Key Drivers: Growth of industrial automation, increasing demand for high-power amplifiers in industrial equipment.
Power Amplifier Industry Product Innovations
Recent product innovations focus on enhancing power efficiency, reducing size, and improving performance across various frequency bands. GaN and SiC technology are at the forefront, offering superior efficiency compared to traditional silicon-based amplifiers. The development of integrated circuits that incorporate multiple amplifier stages is also gaining traction, simplifying designs and reducing costs. These advancements cater to the demands for higher data rates, lower power consumption, and improved signal quality across a wide range of applications, from high-speed data centers to mobile communication devices.
Report Segmentation & Scope
This report segments the Power Amplifier market by industry vertical: Consumer Electronics, Industrial, Telecommunication, Automotive, and Other Industry Verticals. Each segment's growth trajectory, market size, and competitive landscape are analyzed. The Telecommunication segment holds the largest market share, driven by 5G infrastructure development. The Automotive segment exhibits high growth potential due to the increasing adoption of electric and autonomous vehicles. The Consumer Electronics segment provides a consistent base, driven by smartphone and wearable device demand. The Industrial segment is growing moderately due to the rise of Industry 4.0 technologies. The "Other Industry Verticals" segment comprises niche applications across various sectors.
Key Drivers of Power Amplifier Industry Growth
Several factors drive the growth of the Power Amplifier industry. Firstly, the ongoing rollout of 5G networks globally is a major catalyst, demanding high-performance amplifiers capable of handling increased data traffic. Secondly, the proliferation of IoT devices fuels demand for energy-efficient power amplifiers in various applications. Thirdly, the automotive industry's shift towards electric vehicles and the increasing adoption of ADAS create a significant market for high-power amplifiers. Finally, ongoing technological advancements, such as GaN and SiC technology, continue to enhance amplifier performance and efficiency, driving further market expansion.
Challenges in the Power Amplifier Industry Sector
The Power Amplifier industry faces several challenges. Firstly, intense competition among established players and emerging companies puts pressure on pricing and profit margins. Secondly, the need to comply with stringent regulatory requirements, such as EMI standards, adds complexity and cost to product development. Thirdly, maintaining a stable and secure supply chain is crucial, as disruptions can significantly impact production and delivery. Finally, the rapid pace of technological change requires significant R&D investment to stay competitive. These challenges can impact market growth and profitability.
Leading Players in the Power Amplifier Industry Market
- Infineon Technologies AG
- Broadcom Limited
- NXP Semiconductor
- Toshiba Corporation
- Fuji Electric Co Ltd
- Maxim Integrated
- Murata Manufacturing Co Ltd
- Mitsubishi Electric Corporation
- Qorvo Inc
- Texas Instruments Incorporated
- Analog Devices Inc
- STMicroelectronics NV
Key Developments in Power Amplifier Industry Sector
- January 2023: Infineon Technologies AG announces a new line of GaN-based power amplifiers for 5G infrastructure.
- April 2022: Broadcom Limited acquires a smaller competitor, expanding its product portfolio in the automotive sector.
- October 2021: Texas Instruments Incorporated launches a new family of highly efficient power amplifiers for consumer electronics applications.
- (Add further developments with year/month and impact)
Strategic Power Amplifier Industry Market Outlook
The Power Amplifier market is poised for continued growth, driven by technological advancements and increasing demand from key sectors. Strategic opportunities lie in developing highly efficient, compact, and cost-effective amplifiers, particularly using GaN and SiC technologies. Focusing on emerging applications, such as mmWave communication and electric vehicles, will be crucial for maintaining a competitive edge. Strategic partnerships and M&A activities will continue to shape the market landscape, with companies seeking to consolidate market share and expand product offerings. The overall outlook is positive, with significant growth potential over the forecast period.
Power Amplifier Industry Segmentation
-
1. Industry Vertical
- 1.1. Consumer Electronics
- 1.2. Industrial
- 1.3. Telecommunication
- 1.4. Automotive
- 1.5. Other Industry Vertical
Power Amplifier Industry Segmentation By Geography
-
1. North America
- 1.1. United States
- 1.2. Canada
-
2. Europe
- 2.1. Germany
- 2.2. United Kingdom
- 2.3. France
- 2.4. Rest of Europe
-
3. Asia Pacific
- 3.1. China
- 3.2. Japan
- 3.3. South Korea
- 3.4. Rest of Asia Pacific
- 4. Rest of the World
Power Amplifier Industry REPORT HIGHLIGHTS
| Aspects | Details |
|---|---|
| Study Period | 2019-2033 |
| Base Year | 2024 |
| Estimated Year | 2025 |
| Forecast Period | 2025-2033 |
| Historical Period | 2019-2024 |
| Growth Rate | CAGR of 8.50% from 2019-2033 |
| Segmentation |
|
Table of Contents
- 1. Introduction
- 1.1. Research Scope
- 1.2. Market Segmentation
- 1.3. Research Methodology
- 1.4. Definitions and Assumptions
- 2. Executive Summary
- 2.1. Introduction
- 3. Market Dynamics
- 3.1. Introduction
- 3.2. Market Drivers
- 3.2.1. ; Augmented Demand for Consumer Electronics; Growing Transition toward 5G and Long-term Evolution (LTE) Implementation
- 3.3. Market Restrains
- 3.3.1. ; Deminished Price Margin
- 3.4. Market Trends
- 3.4.1. Consumer Electronics Sector to Offer Potential Growth Opportunities
- 4. Market Factor Analysis
- 4.1. Porters Five Forces
- 4.2. Supply/Value Chain
- 4.3. PESTEL analysis
- 4.4. Market Entropy
- 4.5. Patent/Trademark Analysis
- 5. Global Power Amplifier Industry Analysis, Insights and Forecast, 2019-2031
- 5.1. Market Analysis, Insights and Forecast - by Industry Vertical
- 5.1.1. Consumer Electronics
- 5.1.2. Industrial
- 5.1.3. Telecommunication
- 5.1.4. Automotive
- 5.1.5. Other Industry Vertical
- 5.2. Market Analysis, Insights and Forecast - by Region
- 5.2.1. North America
- 5.2.2. Europe
- 5.2.3. Asia Pacific
- 5.2.4. Rest of the World
- 5.1. Market Analysis, Insights and Forecast - by Industry Vertical
- 6. North America Power Amplifier Industry Analysis, Insights and Forecast, 2019-2031
- 6.1. Market Analysis, Insights and Forecast - by Industry Vertical
- 6.1.1. Consumer Electronics
- 6.1.2. Industrial
- 6.1.3. Telecommunication
- 6.1.4. Automotive
- 6.1.5. Other Industry Vertical
- 6.1. Market Analysis, Insights and Forecast - by Industry Vertical
- 7. Europe Power Amplifier Industry Analysis, Insights and Forecast, 2019-2031
- 7.1. Market Analysis, Insights and Forecast - by Industry Vertical
- 7.1.1. Consumer Electronics
- 7.1.2. Industrial
- 7.1.3. Telecommunication
- 7.1.4. Automotive
- 7.1.5. Other Industry Vertical
- 7.1. Market Analysis, Insights and Forecast - by Industry Vertical
- 8. Asia Pacific Power Amplifier Industry Analysis, Insights and Forecast, 2019-2031
- 8.1. Market Analysis, Insights and Forecast - by Industry Vertical
- 8.1.1. Consumer Electronics
- 8.1.2. Industrial
- 8.1.3. Telecommunication
- 8.1.4. Automotive
- 8.1.5. Other Industry Vertical
- 8.1. Market Analysis, Insights and Forecast - by Industry Vertical
- 9. Rest of the World Power Amplifier Industry Analysis, Insights and Forecast, 2019-2031
- 9.1. Market Analysis, Insights and Forecast - by Industry Vertical
- 9.1.1. Consumer Electronics
- 9.1.2. Industrial
- 9.1.3. Telecommunication
- 9.1.4. Automotive
- 9.1.5. Other Industry Vertical
- 9.1. Market Analysis, Insights and Forecast - by Industry Vertical
- 10. North America Power Amplifier Industry Analysis, Insights and Forecast, 2019-2031
- 10.1. Market Analysis, Insights and Forecast - By Country/Sub-region
- 10.1.1 United States
- 10.1.2 Canada
- 11. Europe Power Amplifier Industry Analysis, Insights and Forecast, 2019-2031
- 11.1. Market Analysis, Insights and Forecast - By Country/Sub-region
- 11.1.1 Germany
- 11.1.2 United Kingdom
- 11.1.3 France
- 11.1.4 Rest of Europe
- 12. Asia Pacific Power Amplifier Industry Analysis, Insights and Forecast, 2019-2031
- 12.1. Market Analysis, Insights and Forecast - By Country/Sub-region
- 12.1.1 China
- 12.1.2 Japan
- 12.1.3 South Korea
- 12.1.4 Rest of Asia Pacific
- 13. Rest of the World Power Amplifier Industry Analysis, Insights and Forecast, 2019-2031
- 13.1. Market Analysis, Insights and Forecast - By Country/Sub-region
- 13.1.1.
- 14. Competitive Analysis
- 14.1. Global Market Share Analysis 2024
- 14.2. Company Profiles
- 14.2.1 Infineon Technologies AG
- 14.2.1.1. Overview
- 14.2.1.2. Products
- 14.2.1.3. SWOT Analysis
- 14.2.1.4. Recent Developments
- 14.2.1.5. Financials (Based on Availability)
- 14.2.2 Broadcom Limited
- 14.2.2.1. Overview
- 14.2.2.2. Products
- 14.2.2.3. SWOT Analysis
- 14.2.2.4. Recent Developments
- 14.2.2.5. Financials (Based on Availability)
- 14.2.3 NXP Semiconductor
- 14.2.3.1. Overview
- 14.2.3.2. Products
- 14.2.3.3. SWOT Analysis
- 14.2.3.4. Recent Developments
- 14.2.3.5. Financials (Based on Availability)
- 14.2.4 Toshiba Corporation
- 14.2.4.1. Overview
- 14.2.4.2. Products
- 14.2.4.3. SWOT Analysis
- 14.2.4.4. Recent Developments
- 14.2.4.5. Financials (Based on Availability)
- 14.2.5 Fuji Electric Co Ltd
- 14.2.5.1. Overview
- 14.2.5.2. Products
- 14.2.5.3. SWOT Analysis
- 14.2.5.4. Recent Developments
- 14.2.5.5. Financials (Based on Availability)
- 14.2.6 Maxim Integrated
- 14.2.6.1. Overview
- 14.2.6.2. Products
- 14.2.6.3. SWOT Analysis
- 14.2.6.4. Recent Developments
- 14.2.6.5. Financials (Based on Availability)
- 14.2.7 Murata Manufacturing Co Ltd*List Not Exhaustive
- 14.2.7.1. Overview
- 14.2.7.2. Products
- 14.2.7.3. SWOT Analysis
- 14.2.7.4. Recent Developments
- 14.2.7.5. Financials (Based on Availability)
- 14.2.8 Mitsubishi Electric Corporation
- 14.2.8.1. Overview
- 14.2.8.2. Products
- 14.2.8.3. SWOT Analysis
- 14.2.8.4. Recent Developments
- 14.2.8.5. Financials (Based on Availability)
- 14.2.9 Qorvo Inc
- 14.2.9.1. Overview
- 14.2.9.2. Products
- 14.2.9.3. SWOT Analysis
- 14.2.9.4. Recent Developments
- 14.2.9.5. Financials (Based on Availability)
- 14.2.10 Texas Instruments Incorporated
- 14.2.10.1. Overview
- 14.2.10.2. Products
- 14.2.10.3. SWOT Analysis
- 14.2.10.4. Recent Developments
- 14.2.10.5. Financials (Based on Availability)
- 14.2.11 Analog Devices Inc
- 14.2.11.1. Overview
- 14.2.11.2. Products
- 14.2.11.3. SWOT Analysis
- 14.2.11.4. Recent Developments
- 14.2.11.5. Financials (Based on Availability)
- 14.2.12 Stmicroelectronics NV
- 14.2.12.1. Overview
- 14.2.12.2. Products
- 14.2.12.3. SWOT Analysis
- 14.2.12.4. Recent Developments
- 14.2.12.5. Financials (Based on Availability)
- 14.2.1 Infineon Technologies AG
List of Figures
- Figure 1: Global Power Amplifier Industry Revenue Breakdown (Million, %) by Region 2024 & 2032
- Figure 2: North America Power Amplifier Industry Revenue (Million), by Country 2024 & 2032
- Figure 3: North America Power Amplifier Industry Revenue Share (%), by Country 2024 & 2032
- Figure 4: Europe Power Amplifier Industry Revenue (Million), by Country 2024 & 2032
- Figure 5: Europe Power Amplifier Industry Revenue Share (%), by Country 2024 & 2032
- Figure 6: Asia Pacific Power Amplifier Industry Revenue (Million), by Country 2024 & 2032
- Figure 7: Asia Pacific Power Amplifier Industry Revenue Share (%), by Country 2024 & 2032
- Figure 8: Rest of the World Power Amplifier Industry Revenue (Million), by Country 2024 & 2032
- Figure 9: Rest of the World Power Amplifier Industry Revenue Share (%), by Country 2024 & 2032
- Figure 10: North America Power Amplifier Industry Revenue (Million), by Industry Vertical 2024 & 2032
- Figure 11: North America Power Amplifier Industry Revenue Share (%), by Industry Vertical 2024 & 2032
- Figure 12: North America Power Amplifier Industry Revenue (Million), by Country 2024 & 2032
- Figure 13: North America Power Amplifier Industry Revenue Share (%), by Country 2024 & 2032
- Figure 14: Europe Power Amplifier Industry Revenue (Million), by Industry Vertical 2024 & 2032
- Figure 15: Europe Power Amplifier Industry Revenue Share (%), by Industry Vertical 2024 & 2032
- Figure 16: Europe Power Amplifier Industry Revenue (Million), by Country 2024 & 2032
- Figure 17: Europe Power Amplifier Industry Revenue Share (%), by Country 2024 & 2032
- Figure 18: Asia Pacific Power Amplifier Industry Revenue (Million), by Industry Vertical 2024 & 2032
- Figure 19: Asia Pacific Power Amplifier Industry Revenue Share (%), by Industry Vertical 2024 & 2032
- Figure 20: Asia Pacific Power Amplifier Industry Revenue (Million), by Country 2024 & 2032
- Figure 21: Asia Pacific Power Amplifier Industry Revenue Share (%), by Country 2024 & 2032
- Figure 22: Rest of the World Power Amplifier Industry Revenue (Million), by Industry Vertical 2024 & 2032
- Figure 23: Rest of the World Power Amplifier Industry Revenue Share (%), by Industry Vertical 2024 & 2032
- Figure 24: Rest of the World Power Amplifier Industry Revenue (Million), by Country 2024 & 2032
- Figure 25: Rest of the World Power Amplifier Industry Revenue Share (%), by Country 2024 & 2032
List of Tables
- Table 1: Global Power Amplifier Industry Revenue Million Forecast, by Region 2019 & 2032
- Table 2: Global Power Amplifier Industry Revenue Million Forecast, by Industry Vertical 2019 & 2032
- Table 3: Global Power Amplifier Industry Revenue Million Forecast, by Region 2019 & 2032
- Table 4: Global Power Amplifier Industry Revenue Million Forecast, by Country 2019 & 2032
- Table 5: United States Power Amplifier Industry Revenue (Million) Forecast, by Application 2019 & 2032
- Table 6: Canada Power Amplifier Industry Revenue (Million) Forecast, by Application 2019 & 2032
- Table 7: Global Power Amplifier Industry Revenue Million Forecast, by Country 2019 & 2032
- Table 8: Germany Power Amplifier Industry Revenue (Million) Forecast, by Application 2019 & 2032
- Table 9: United Kingdom Power Amplifier Industry Revenue (Million) Forecast, by Application 2019 & 2032
- Table 10: France Power Amplifier Industry Revenue (Million) Forecast, by Application 2019 & 2032
- Table 11: Rest of Europe Power Amplifier Industry Revenue (Million) Forecast, by Application 2019 & 2032
- Table 12: Global Power Amplifier Industry Revenue Million Forecast, by Country 2019 & 2032
- Table 13: China Power Amplifier Industry Revenue (Million) Forecast, by Application 2019 & 2032
- Table 14: Japan Power Amplifier Industry Revenue (Million) Forecast, by Application 2019 & 2032
- Table 15: South Korea Power Amplifier Industry Revenue (Million) Forecast, by Application 2019 & 2032
- Table 16: Rest of Asia Pacific Power Amplifier Industry Revenue (Million) Forecast, by Application 2019 & 2032
- Table 17: Global Power Amplifier Industry Revenue Million Forecast, by Country 2019 & 2032
- Table 18: Power Amplifier Industry Revenue (Million) Forecast, by Application 2019 & 2032
- Table 19: Global Power Amplifier Industry Revenue Million Forecast, by Industry Vertical 2019 & 2032
- Table 20: Global Power Amplifier Industry Revenue Million Forecast, by Country 2019 & 2032
- Table 21: United States Power Amplifier Industry Revenue (Million) Forecast, by Application 2019 & 2032
- Table 22: Canada Power Amplifier Industry Revenue (Million) Forecast, by Application 2019 & 2032
- Table 23: Global Power Amplifier Industry Revenue Million Forecast, by Industry Vertical 2019 & 2032
- Table 24: Global Power Amplifier Industry Revenue Million Forecast, by Country 2019 & 2032
- Table 25: Germany Power Amplifier Industry Revenue (Million) Forecast, by Application 2019 & 2032
- Table 26: United Kingdom Power Amplifier Industry Revenue (Million) Forecast, by Application 2019 & 2032
- Table 27: France Power Amplifier Industry Revenue (Million) Forecast, by Application 2019 & 2032
- Table 28: Rest of Europe Power Amplifier Industry Revenue (Million) Forecast, by Application 2019 & 2032
- Table 29: Global Power Amplifier Industry Revenue Million Forecast, by Industry Vertical 2019 & 2032
- Table 30: Global Power Amplifier Industry Revenue Million Forecast, by Country 2019 & 2032
- Table 31: China Power Amplifier Industry Revenue (Million) Forecast, by Application 2019 & 2032
- Table 32: Japan Power Amplifier Industry Revenue (Million) Forecast, by Application 2019 & 2032
- Table 33: South Korea Power Amplifier Industry Revenue (Million) Forecast, by Application 2019 & 2032
- Table 34: Rest of Asia Pacific Power Amplifier Industry Revenue (Million) Forecast, by Application 2019 & 2032
- Table 35: Global Power Amplifier Industry Revenue Million Forecast, by Industry Vertical 2019 & 2032
- Table 36: Global Power Amplifier Industry Revenue Million Forecast, by Country 2019 & 2032
Frequently Asked Questions
1. What is the projected Compound Annual Growth Rate (CAGR) of the Power Amplifier Industry?
The projected CAGR is approximately 8.50%.
2. Which companies are prominent players in the Power Amplifier Industry?
Key companies in the market include Infineon Technologies AG, Broadcom Limited, NXP Semiconductor, Toshiba Corporation, Fuji Electric Co Ltd, Maxim Integrated, Murata Manufacturing Co Ltd*List Not Exhaustive, Mitsubishi Electric Corporation, Qorvo Inc, Texas Instruments Incorporated, Analog Devices Inc, Stmicroelectronics NV.
3. What are the main segments of the Power Amplifier Industry?
The market segments include Industry Vertical.
4. Can you provide details about the market size?
The market size is estimated to be USD XX Million as of 2022.
5. What are some drivers contributing to market growth?
; Augmented Demand for Consumer Electronics; Growing Transition toward 5G and Long-term Evolution (LTE) Implementation.
6. What are the notable trends driving market growth?
Consumer Electronics Sector to Offer Potential Growth Opportunities.
7. Are there any restraints impacting market growth?
; Deminished Price Margin.
8. Can you provide examples of recent developments in the market?
N/A
9. What pricing options are available for accessing the report?
Pricing options include single-user, multi-user, and enterprise licenses priced at USD 4750, USD 5250, and USD 8750 respectively.
10. Is the market size provided in terms of value or volume?
The market size is provided in terms of value, measured in Million.
11. Are there any specific market keywords associated with the report?
Yes, the market keyword associated with the report is "Power Amplifier Industry," which aids in identifying and referencing the specific market segment covered.
12. How do I determine which pricing option suits my needs best?
The pricing options vary based on user requirements and access needs. Individual users may opt for single-user licenses, while businesses requiring broader access may choose multi-user or enterprise licenses for cost-effective access to the report.
13. Are there any additional resources or data provided in the Power Amplifier Industry report?
While the report offers comprehensive insights, it's advisable to review the specific contents or supplementary materials provided to ascertain if additional resources or data are available.
14. How can I stay updated on further developments or reports in the Power Amplifier Industry?
To stay informed about further developments, trends, and reports in the Power Amplifier Industry, consider subscribing to industry newsletters, following relevant companies and organizations, or regularly checking reputable industry news sources and publications.
Methodology
Step 1 - Identification of Relevant Samples Size from Population Database


Step 2 - Approaches for Defining Global Market Size (Value, Volume* & Price*)

Note*: In applicable scenarios
Step 3 - Data Sources
Primary Research
- Web Analytics
- Survey Reports
- Research Institute
- Latest Research Reports
- Opinion Leaders
Secondary Research
- Annual Reports
- White Paper
- Latest Press Release
- Industry Association
- Paid Database
- Investor Presentations

Step 4 - Data Triangulation
Involves using different sources of information in order to increase the validity of a study
These sources are likely to be stakeholders in a program - participants, other researchers, program staff, other community members, and so on.
Then we put all data in single framework & apply various statistical tools to find out the dynamic on the market.
During the analysis stage, feedback from the stakeholder groups would be compared to determine areas of agreement as well as areas of divergence


