
Key Insights
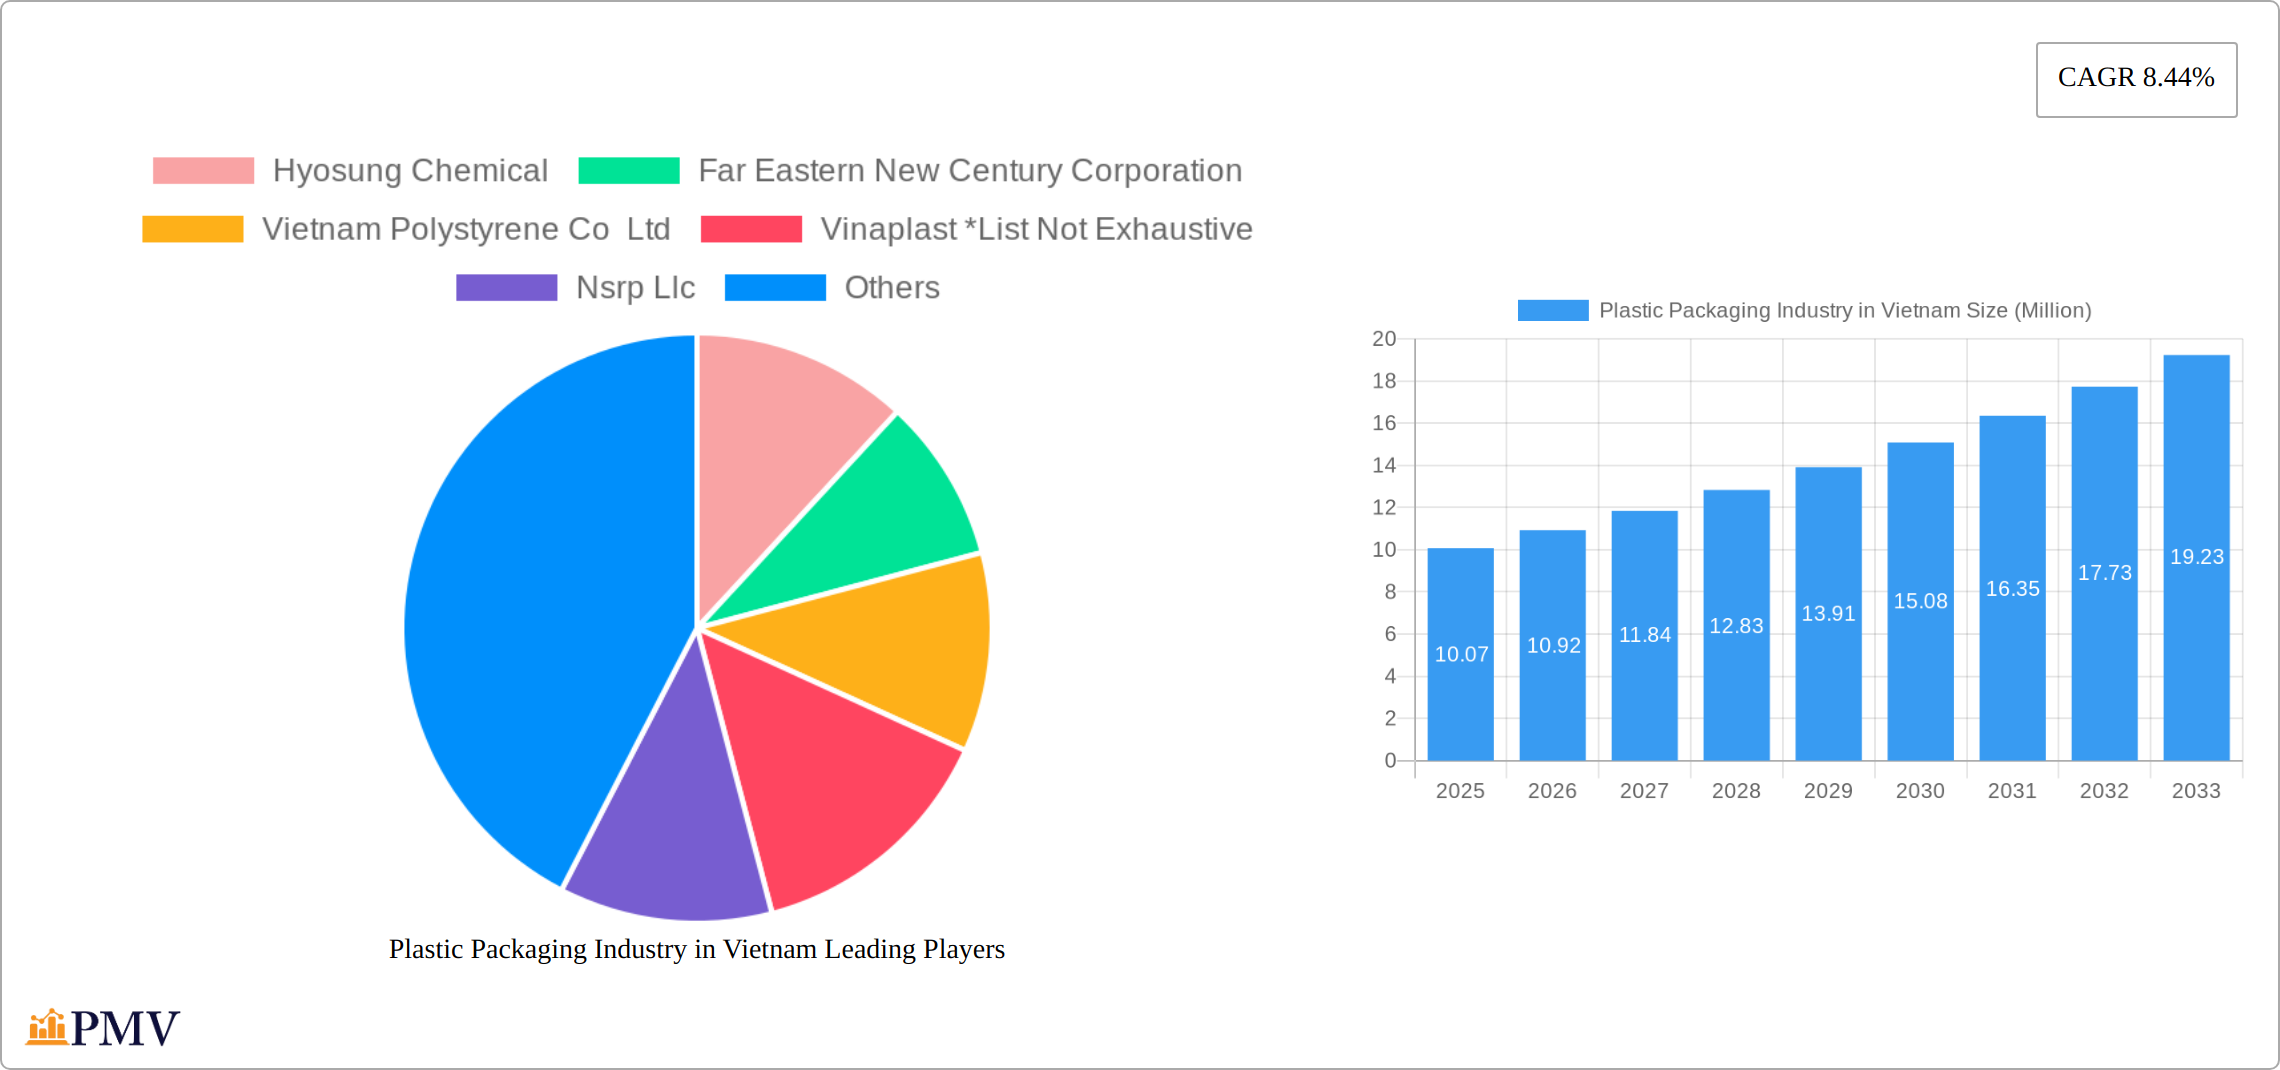
The Plastic Packaging Industry in Vietnam is poised for significant growth, with a market size projected to reach $10.07 million by 2025. This expansion is driven by increasing demand across various sectors, including packaging, electrical and electronics, building and construction, automotive and transportation, housewares, furniture and bedding, and other applications. The industry is segmented by type into traditional plastics, polyvinyl chloride, engineering plastics, and bioplastics, with technology segments including blow molding, extrusion, injection molding, and other technologies. Key players such as Hyosung Chemical, Far Eastern New Century Corporation, and Vietnam Polystyrene Co Ltd are actively contributing to the market's growth. The industry's growth is further fueled by the robust economic development in Vietnam and the rising consumer demand for packaged goods.
The market is expected to grow at a compound annual growth rate (CAGR) of 8.44% from 2025 to 2033, reflecting the industry's resilience and adaptability to market trends. Key trends include the shift towards sustainable packaging solutions, with a notable increase in the use of bioplastics. However, the industry faces challenges such as environmental concerns and regulatory pressures that may restrain growth. Despite these challenges, the market's segmentation and the strategic initiatives of leading companies are expected to drive innovation and meet the evolving needs of consumers. The focus on technological advancements in packaging solutions and the expansion of application areas are crucial factors that will shape the future of the Plastic Packaging Industry in Vietnam.
Plastic Packaging Industry in Vietnam Market Structure & Competitive Dynamics
Vietnam's plastic packaging industry presents a dynamic landscape shaped by a blend of domestic and multinational corporations, resulting in a moderately concentrated market. Key players like Hyosung Chemical, Far Eastern New Century Corporation, and Vietnam Polystyrene Co Ltd command substantial market shares, fostering a competitive environment driven by innovation. A robust R&D ecosystem fuels advancements in product quality and sustainability, a crucial factor given the evolving regulatory environment. The country is increasingly focused on environmental sustainability, pushing the adoption of bioplastics and recyclable materials.
While substitutes such as glass and metal packaging present competitive challenges, plastic's cost-effectiveness and versatility ensure its continued dominance. Strong growth is fueled by rising demand across various sectors, notably food and beverage, and pharmaceuticals, reflecting Vietnam's expanding consumer market. The industry is characterized by significant mergers and acquisitions activity; deals totaling approximately USD 500 million over the past five years highlight the pursuit of increased production capacity and broader market reach. Companies are actively engaged in optimizing their market positions through strategic alliances and technological advancements, creating a consistently dynamic competitive landscape.
- Market Concentration: Moderate, with key players holding significant shares.
- Innovation Ecosystem: Robust R&D emphasizing sustainable and innovative packaging solutions.
- Regulatory Landscape: Stringent environmental regulations are driving a shift towards sustainable practices.
- Competitive Substitutes: Glass and metal packaging pose a competitive threat, but plastic maintains its advantage in cost and versatility.
- End-User Demand: Rapid growth in food & beverage, pharmaceuticals, and other consumer goods sectors.
- Mergers & Acquisitions: Significant activity in recent years, totaling approximately USD 500 million in deal value, focused on expansion and market consolidation.
Plastic Packaging Industry in Vietnam Industry Trends & Insights
The plastic packaging industry in Vietnam is witnessing robust growth, primarily driven by the country's expanding manufacturing sector and rising consumer demand. The market is projected to grow at a Compound Annual Growth Rate (CAGR) of 6.5% from 2025 to 2033, fueled by increased investments in infrastructure and industrial development. Technological disruptions, such as the adoption of smart packaging solutions and automation in manufacturing processes, are reshaping the industry landscape. Consumer preferences are shifting towards sustainable packaging solutions, prompting companies to innovate with biodegradable and recyclable materials.
Competitive dynamics are intensifying, with key players vying for market share through product differentiation and strategic partnerships. The penetration of bioplastics is on the rise, with a market penetration rate expected to reach 10% by 2033. The industry's growth is further supported by favorable government policies promoting industrial growth and environmental sustainability. However, challenges such as fluctuating raw material prices and stringent environmental regulations pose hurdles to market expansion. Overall, the plastic packaging industry in Vietnam is poised for sustained growth, driven by a confluence of technological, economic, and regulatory factors.

Dominant Markets & Segments in Plastic Packaging Industry in Vietnam
The dominant segment in the plastic packaging industry in Vietnam is the packaging application, driven by the burgeoning food and beverage sector. Traditional plastics hold the largest market share due to their cost-effectiveness and versatility, with a projected market size of USD 2.5 Billion by 2033. The engineering plastics segment, particularly polyvinyl chloride, is gaining traction in industrial applications, with a market size expected to reach USD 1.2 Billion by the same year.
- Economic Policies: Government incentives for industrial growth.
- Infrastructure: Investment in manufacturing facilities.
In terms of technology, injection molding is the leading segment, favored for its precision and efficiency, with a market size of USD 1.8 Billion by 2033. Blow molding and extrusion also play significant roles, especially in the production of bottles and films. The bioplastics segment is emerging as a key growth area, driven by environmental concerns and regulatory support, with a projected market size of USD 500 Million by 2033.
The electrical and electronics sector is another dominant application, spurred by Vietnam's role as a manufacturing hub. Building and construction applications are also significant, with plastic packaging used extensively for materials like pipes and fittings. The automotive and transportation sector leverages plastic packaging for lightweight components, while housewares, furniture, and bedding applications are growing due to the expanding middle class. Other applications, such as in agriculture and healthcare, contribute to the industry's diversity and resilience.
Plastic Packaging Industry in Vietnam Product Innovations
Innovations in the plastic packaging industry in Vietnam are focused on sustainability and efficiency. Recent developments include the introduction of biodegradable packaging solutions and smart packaging technologies that enhance product traceability and consumer engagement. These innovations align with market trends towards eco-friendly products and digitalization, offering competitive advantages by meeting regulatory standards and consumer expectations.
Report Segmentation & Scope
The Vietnamese plastic packaging market is segmented by material type, manufacturing technology, and application. Traditional Plastics currently dominate, projected to reach USD 2.5 billion by 2033, driven by their cost-effectiveness. Within engineering plastics, Polyvinyl Chloride (PVC) is anticipated to reach USD 1.2 billion, largely due to its widespread use in industrial applications. The increasing focus on sustainability is driving the growth of Bioplastics, with a projected market size of USD 500 million by 2033.
Key manufacturing technologies include Blow Molding, Extrusion, and Injection Molding, with Injection Molding projected to lead the market at USD 1.8 billion by 2033. Packaging remains the largest application area, followed by significant contributions from Electrical and Electronics, Building and Construction, Automotive and Transportation, Housewares, Furniture and Bedding, and other diverse applications, reflecting the broad reach and diversification of the industry.
Key Drivers of Plastic Packaging Industry in Vietnam Growth
The growth of the plastic packaging industry in Vietnam is driven by several key factors. Technologically, advancements in automation and smart packaging solutions enhance efficiency and product traceability. Economically, the rise in manufacturing and consumer demand fuels market expansion. Regulatory factors, such as government incentives for industrial growth and environmental sustainability, support the adoption of eco-friendly packaging solutions.
Challenges in the Plastic Packaging Industry in Vietnam Sector
The Vietnamese plastic packaging sector faces considerable challenges. Stringent environmental regulations and associated compliance costs present significant hurdles. Supply chain disruptions and fluctuations in raw material prices directly impact profitability. The ongoing competitive pressure from alternative packaging materials, such as glass and metal, necessitates continuous innovation and rigorous cost management to maintain market share and profitability.
Leading Players in the Plastic Packaging Industry in Vietnam Market
- Hyosung Chemical
- Far Eastern New Century Corporation
- Vietnam Polystyrene Co Ltd
- Vinaplast *List Not Exhaustive
- Nsrp Llc
- Toray Industries Inc
- Nan Ya Plastics Corporation
- Agc Inc
- Vietnam Oil And Gas Group
- Scg Chemicals Public Company Limited
- Lyondellbasell Industries Holdings Bv
- Billion Industrial Holdings Limited
Key Developments in Plastic Packaging Industry in Vietnam Sector
- September 2022: Billion Industrial Holdings Limited announced a substantial expansion of its manufacturing facilities for polyester bottle chips in Vietnam, adding 300,000 tons of polyethylene terephthalate resin production capacity. This expansion reinforces the company's market position and addresses the growing demand.
- August 2022: SCG Chemicals Co. Ltd invested USD 22.7 million in AJ Plastproject to establish biaxially oriented polyethylene terephthalate (BOPET) production in Vietnam. This investment aims to enhance the company's product portfolio with value-added products tailored to meet evolving consumer preferences.
- [Add more recent key developments here, if available. Include dates, companies, and a brief description of the development.]
Strategic Plastic Packaging Industry in Vietnam Market Outlook
The Vietnamese plastic packaging industry is poised for continued robust growth, fueled by technological advancements and increasing consumer demand. The greatest future potential lies in sustainable packaging solutions and the integration of smart technologies, creating significant opportunities for companies to expand their market share and gain a competitive edge. A sustained focus on eco-friendly products and the adoption of digitalization will continue to reshape the industry, offering promising avenues for innovation and competitive differentiation.
Plastic Packaging Industry in Vietnam Segmentation
-
1. Type
-
1.1. Traditional Plastics
- 1.1.1. Polyethylene
- 1.1.2. Polypropylene
- 1.1.3. Polystyrene
- 1.1.4. Polyvinyl Chloride
-
1.2. Engineering Plastics
- 1.2.1. Polyurethanes
- 1.2.2. Fluoropolymers
- 1.2.3. Polyamides
- 1.2.4. Polycarbonates
- 1.2.5. Styrene Copolymers (ABS and SAN)
- 1.2.6. Thermoplastic Polyesters
- 1.2.7. Other Engineering Plastics
- 1.3. Bioplastics
-
1.1. Traditional Plastics
-
2. Technology
- 2.1. Blow Molding
- 2.2. Extrusion
- 2.3. Injection Molding
- 2.4. Other Technologies
-
3. Application
- 3.1. Packaging
- 3.2. Electrical and Electronics
- 3.3. Building and Construction
- 3.4. Automotive and Transportation
- 3.5. Housewares
- 3.6. Furniture and Bedding
- 3.7. Other Applications
Plastic Packaging Industry in Vietnam Segmentation By Geography
-
1. North America
- 1.1. United States
- 1.2. Canada
- 1.3. Mexico
-
2. South America
- 2.1. Brazil
- 2.2. Argentina
- 2.3. Rest of South America
-
3. Europe
- 3.1. United Kingdom
- 3.2. Germany
- 3.3. France
- 3.4. Italy
- 3.5. Spain
- 3.6. Russia
- 3.7. Benelux
- 3.8. Nordics
- 3.9. Rest of Europe
-
4. Middle East & Africa
- 4.1. Turkey
- 4.2. Israel
- 4.3. GCC
- 4.4. North Africa
- 4.5. South Africa
- 4.6. Rest of Middle East & Africa
-
5. Asia Pacific
- 5.1. China
- 5.2. India
- 5.3. Japan
- 5.4. South Korea
- 5.5. ASEAN
- 5.6. Oceania
- 5.7. Rest of Asia Pacific
Plastic Packaging Industry in Vietnam REPORT HIGHLIGHTS
| Aspects | Details |
|---|---|
| Study Period | 2019-2033 |
| Base Year | 2024 |
| Estimated Year | 2025 |
| Forecast Period | 2025-2033 |
| Historical Period | 2019-2024 |
| Growth Rate | CAGR of 8.44% from 2019-2033 |
| Segmentation |
|
Table of Contents
- 1. Introduction
- 1.1. Research Scope
- 1.2. Market Segmentation
- 1.3. Research Methodology
- 1.4. Definitions and Assumptions
- 2. Executive Summary
- 2.1. Introduction
- 3. Market Dynamics
- 3.1. Introduction
- 3.2. Market Drivers
- 3.2.1. Growing Demand from the Construction Sector; Other Drivers
- 3.3. Market Restrains
- 3.3.1. Over-reliance on Imports of Raw Materials and Finished Plastics; Environmental Concerns of Plastics and the Availability of New Substitutes
- 3.4. Market Trends
- 3.4.1. Extrusion Technology to Dominate the Market
- 4. Market Factor Analysis
- 4.1. Porters Five Forces
- 4.2. Supply/Value Chain
- 4.3. PESTEL analysis
- 4.4. Market Entropy
- 4.5. Patent/Trademark Analysis
- 5. Global Plastic Packaging Industry in Vietnam Analysis, Insights and Forecast, 2019-2031
- 5.1. Market Analysis, Insights and Forecast - by Type
- 5.1.1. Traditional Plastics
- 5.1.1.1. Polyethylene
- 5.1.1.2. Polypropylene
- 5.1.1.3. Polystyrene
- 5.1.1.4. Polyvinyl Chloride
- 5.1.2. Engineering Plastics
- 5.1.2.1. Polyurethanes
- 5.1.2.2. Fluoropolymers
- 5.1.2.3. Polyamides
- 5.1.2.4. Polycarbonates
- 5.1.2.5. Styrene Copolymers (ABS and SAN)
- 5.1.2.6. Thermoplastic Polyesters
- 5.1.2.7. Other Engineering Plastics
- 5.1.3. Bioplastics
- 5.1.1. Traditional Plastics
- 5.2. Market Analysis, Insights and Forecast - by Technology
- 5.2.1. Blow Molding
- 5.2.2. Extrusion
- 5.2.3. Injection Molding
- 5.2.4. Other Technologies
- 5.3. Market Analysis, Insights and Forecast - by Application
- 5.3.1. Packaging
- 5.3.2. Electrical and Electronics
- 5.3.3. Building and Construction
- 5.3.4. Automotive and Transportation
- 5.3.5. Housewares
- 5.3.6. Furniture and Bedding
- 5.3.7. Other Applications
- 5.4. Market Analysis, Insights and Forecast - by Region
- 5.4.1. North America
- 5.4.2. South America
- 5.4.3. Europe
- 5.4.4. Middle East & Africa
- 5.4.5. Asia Pacific
- 5.1. Market Analysis, Insights and Forecast - by Type
- 6. North America Plastic Packaging Industry in Vietnam Analysis, Insights and Forecast, 2019-2031
- 6.1. Market Analysis, Insights and Forecast - by Type
- 6.1.1. Traditional Plastics
- 6.1.1.1. Polyethylene
- 6.1.1.2. Polypropylene
- 6.1.1.3. Polystyrene
- 6.1.1.4. Polyvinyl Chloride
- 6.1.2. Engineering Plastics
- 6.1.2.1. Polyurethanes
- 6.1.2.2. Fluoropolymers
- 6.1.2.3. Polyamides
- 6.1.2.4. Polycarbonates
- 6.1.2.5. Styrene Copolymers (ABS and SAN)
- 6.1.2.6. Thermoplastic Polyesters
- 6.1.2.7. Other Engineering Plastics
- 6.1.3. Bioplastics
- 6.1.1. Traditional Plastics
- 6.2. Market Analysis, Insights and Forecast - by Technology
- 6.2.1. Blow Molding
- 6.2.2. Extrusion
- 6.2.3. Injection Molding
- 6.2.4. Other Technologies
- 6.3. Market Analysis, Insights and Forecast - by Application
- 6.3.1. Packaging
- 6.3.2. Electrical and Electronics
- 6.3.3. Building and Construction
- 6.3.4. Automotive and Transportation
- 6.3.5. Housewares
- 6.3.6. Furniture and Bedding
- 6.3.7. Other Applications
- 6.1. Market Analysis, Insights and Forecast - by Type
- 7. South America Plastic Packaging Industry in Vietnam Analysis, Insights and Forecast, 2019-2031
- 7.1. Market Analysis, Insights and Forecast - by Type
- 7.1.1. Traditional Plastics
- 7.1.1.1. Polyethylene
- 7.1.1.2. Polypropylene
- 7.1.1.3. Polystyrene
- 7.1.1.4. Polyvinyl Chloride
- 7.1.2. Engineering Plastics
- 7.1.2.1. Polyurethanes
- 7.1.2.2. Fluoropolymers
- 7.1.2.3. Polyamides
- 7.1.2.4. Polycarbonates
- 7.1.2.5. Styrene Copolymers (ABS and SAN)
- 7.1.2.6. Thermoplastic Polyesters
- 7.1.2.7. Other Engineering Plastics
- 7.1.3. Bioplastics
- 7.1.1. Traditional Plastics
- 7.2. Market Analysis, Insights and Forecast - by Technology
- 7.2.1. Blow Molding
- 7.2.2. Extrusion
- 7.2.3. Injection Molding
- 7.2.4. Other Technologies
- 7.3. Market Analysis, Insights and Forecast - by Application
- 7.3.1. Packaging
- 7.3.2. Electrical and Electronics
- 7.3.3. Building and Construction
- 7.3.4. Automotive and Transportation
- 7.3.5. Housewares
- 7.3.6. Furniture and Bedding
- 7.3.7. Other Applications
- 7.1. Market Analysis, Insights and Forecast - by Type
- 8. Europe Plastic Packaging Industry in Vietnam Analysis, Insights and Forecast, 2019-2031
- 8.1. Market Analysis, Insights and Forecast - by Type
- 8.1.1. Traditional Plastics
- 8.1.1.1. Polyethylene
- 8.1.1.2. Polypropylene
- 8.1.1.3. Polystyrene
- 8.1.1.4. Polyvinyl Chloride
- 8.1.2. Engineering Plastics
- 8.1.2.1. Polyurethanes
- 8.1.2.2. Fluoropolymers
- 8.1.2.3. Polyamides
- 8.1.2.4. Polycarbonates
- 8.1.2.5. Styrene Copolymers (ABS and SAN)
- 8.1.2.6. Thermoplastic Polyesters
- 8.1.2.7. Other Engineering Plastics
- 8.1.3. Bioplastics
- 8.1.1. Traditional Plastics
- 8.2. Market Analysis, Insights and Forecast - by Technology
- 8.2.1. Blow Molding
- 8.2.2. Extrusion
- 8.2.3. Injection Molding
- 8.2.4. Other Technologies
- 8.3. Market Analysis, Insights and Forecast - by Application
- 8.3.1. Packaging
- 8.3.2. Electrical and Electronics
- 8.3.3. Building and Construction
- 8.3.4. Automotive and Transportation
- 8.3.5. Housewares
- 8.3.6. Furniture and Bedding
- 8.3.7. Other Applications
- 8.1. Market Analysis, Insights and Forecast - by Type
- 9. Middle East & Africa Plastic Packaging Industry in Vietnam Analysis, Insights and Forecast, 2019-2031
- 9.1. Market Analysis, Insights and Forecast - by Type
- 9.1.1. Traditional Plastics
- 9.1.1.1. Polyethylene
- 9.1.1.2. Polypropylene
- 9.1.1.3. Polystyrene
- 9.1.1.4. Polyvinyl Chloride
- 9.1.2. Engineering Plastics
- 9.1.2.1. Polyurethanes
- 9.1.2.2. Fluoropolymers
- 9.1.2.3. Polyamides
- 9.1.2.4. Polycarbonates
- 9.1.2.5. Styrene Copolymers (ABS and SAN)
- 9.1.2.6. Thermoplastic Polyesters
- 9.1.2.7. Other Engineering Plastics
- 9.1.3. Bioplastics
- 9.1.1. Traditional Plastics
- 9.2. Market Analysis, Insights and Forecast - by Technology
- 9.2.1. Blow Molding
- 9.2.2. Extrusion
- 9.2.3. Injection Molding
- 9.2.4. Other Technologies
- 9.3. Market Analysis, Insights and Forecast - by Application
- 9.3.1. Packaging
- 9.3.2. Electrical and Electronics
- 9.3.3. Building and Construction
- 9.3.4. Automotive and Transportation
- 9.3.5. Housewares
- 9.3.6. Furniture and Bedding
- 9.3.7. Other Applications
- 9.1. Market Analysis, Insights and Forecast - by Type
- 10. Asia Pacific Plastic Packaging Industry in Vietnam Analysis, Insights and Forecast, 2019-2031
- 10.1. Market Analysis, Insights and Forecast - by Type
- 10.1.1. Traditional Plastics
- 10.1.1.1. Polyethylene
- 10.1.1.2. Polypropylene
- 10.1.1.3. Polystyrene
- 10.1.1.4. Polyvinyl Chloride
- 10.1.2. Engineering Plastics
- 10.1.2.1. Polyurethanes
- 10.1.2.2. Fluoropolymers
- 10.1.2.3. Polyamides
- 10.1.2.4. Polycarbonates
- 10.1.2.5. Styrene Copolymers (ABS and SAN)
- 10.1.2.6. Thermoplastic Polyesters
- 10.1.2.7. Other Engineering Plastics
- 10.1.3. Bioplastics
- 10.1.1. Traditional Plastics
- 10.2. Market Analysis, Insights and Forecast - by Technology
- 10.2.1. Blow Molding
- 10.2.2. Extrusion
- 10.2.3. Injection Molding
- 10.2.4. Other Technologies
- 10.3. Market Analysis, Insights and Forecast - by Application
- 10.3.1. Packaging
- 10.3.2. Electrical and Electronics
- 10.3.3. Building and Construction
- 10.3.4. Automotive and Transportation
- 10.3.5. Housewares
- 10.3.6. Furniture and Bedding
- 10.3.7. Other Applications
- 10.1. Market Analysis, Insights and Forecast - by Type
- 11. Competitive Analysis
- 11.1. Global Market Share Analysis 2024
- 11.2. Company Profiles
- 11.2.1 Hyosung Chemical
- 11.2.1.1. Overview
- 11.2.1.2. Products
- 11.2.1.3. SWOT Analysis
- 11.2.1.4. Recent Developments
- 11.2.1.5. Financials (Based on Availability)
- 11.2.2 Far Eastern New Century Corporation
- 11.2.2.1. Overview
- 11.2.2.2. Products
- 11.2.2.3. SWOT Analysis
- 11.2.2.4. Recent Developments
- 11.2.2.5. Financials (Based on Availability)
- 11.2.3 Vietnam Polystyrene Co Ltd
- 11.2.3.1. Overview
- 11.2.3.2. Products
- 11.2.3.3. SWOT Analysis
- 11.2.3.4. Recent Developments
- 11.2.3.5. Financials (Based on Availability)
- 11.2.4 Vinaplast *List Not Exhaustive
- 11.2.4.1. Overview
- 11.2.4.2. Products
- 11.2.4.3. SWOT Analysis
- 11.2.4.4. Recent Developments
- 11.2.4.5. Financials (Based on Availability)
- 11.2.5 Nsrp Llc
- 11.2.5.1. Overview
- 11.2.5.2. Products
- 11.2.5.3. SWOT Analysis
- 11.2.5.4. Recent Developments
- 11.2.5.5. Financials (Based on Availability)
- 11.2.6 Toray Industries Inc
- 11.2.6.1. Overview
- 11.2.6.2. Products
- 11.2.6.3. SWOT Analysis
- 11.2.6.4. Recent Developments
- 11.2.6.5. Financials (Based on Availability)
- 11.2.7 Nan Ya Plastics Corporation
- 11.2.7.1. Overview
- 11.2.7.2. Products
- 11.2.7.3. SWOT Analysis
- 11.2.7.4. Recent Developments
- 11.2.7.5. Financials (Based on Availability)
- 11.2.8 Agc Inc
- 11.2.8.1. Overview
- 11.2.8.2. Products
- 11.2.8.3. SWOT Analysis
- 11.2.8.4. Recent Developments
- 11.2.8.5. Financials (Based on Availability)
- 11.2.9 Vietnam Oil And Gas Group
- 11.2.9.1. Overview
- 11.2.9.2. Products
- 11.2.9.3. SWOT Analysis
- 11.2.9.4. Recent Developments
- 11.2.9.5. Financials (Based on Availability)
- 11.2.10 Scg Chemicals Public Company Limited
- 11.2.10.1. Overview
- 11.2.10.2. Products
- 11.2.10.3. SWOT Analysis
- 11.2.10.4. Recent Developments
- 11.2.10.5. Financials (Based on Availability)
- 11.2.11 Lyondellbasell Industries Holdings Bv
- 11.2.11.1. Overview
- 11.2.11.2. Products
- 11.2.11.3. SWOT Analysis
- 11.2.11.4. Recent Developments
- 11.2.11.5. Financials (Based on Availability)
- 11.2.12 Billion Industrial Holdings Limited
- 11.2.12.1. Overview
- 11.2.12.2. Products
- 11.2.12.3. SWOT Analysis
- 11.2.12.4. Recent Developments
- 11.2.12.5. Financials (Based on Availability)
- 11.2.1 Hyosung Chemical
List of Figures
- Figure 1: Global Plastic Packaging Industry in Vietnam Revenue Breakdown (Million, %) by Region 2024 & 2032
- Figure 2: Global Plastic Packaging Industry in Vietnam Volume Breakdown (Million, %) by Region 2024 & 2032
- Figure 3: Vietnam Plastic Packaging Industry in Vietnam Revenue (Million), by Country 2024 & 2032
- Figure 4: Vietnam Plastic Packaging Industry in Vietnam Volume (Million), by Country 2024 & 2032
- Figure 5: Vietnam Plastic Packaging Industry in Vietnam Revenue Share (%), by Country 2024 & 2032
- Figure 6: Vietnam Plastic Packaging Industry in Vietnam Volume Share (%), by Country 2024 & 2032
- Figure 7: North America Plastic Packaging Industry in Vietnam Revenue (Million), by Type 2024 & 2032
- Figure 8: North America Plastic Packaging Industry in Vietnam Volume (Million), by Type 2024 & 2032
- Figure 9: North America Plastic Packaging Industry in Vietnam Revenue Share (%), by Type 2024 & 2032
- Figure 10: North America Plastic Packaging Industry in Vietnam Volume Share (%), by Type 2024 & 2032
- Figure 11: North America Plastic Packaging Industry in Vietnam Revenue (Million), by Technology 2024 & 2032
- Figure 12: North America Plastic Packaging Industry in Vietnam Volume (Million), by Technology 2024 & 2032
- Figure 13: North America Plastic Packaging Industry in Vietnam Revenue Share (%), by Technology 2024 & 2032
- Figure 14: North America Plastic Packaging Industry in Vietnam Volume Share (%), by Technology 2024 & 2032
- Figure 15: North America Plastic Packaging Industry in Vietnam Revenue (Million), by Application 2024 & 2032
- Figure 16: North America Plastic Packaging Industry in Vietnam Volume (Million), by Application 2024 & 2032
- Figure 17: North America Plastic Packaging Industry in Vietnam Revenue Share (%), by Application 2024 & 2032
- Figure 18: North America Plastic Packaging Industry in Vietnam Volume Share (%), by Application 2024 & 2032
- Figure 19: North America Plastic Packaging Industry in Vietnam Revenue (Million), by Country 2024 & 2032
- Figure 20: North America Plastic Packaging Industry in Vietnam Volume (Million), by Country 2024 & 2032
- Figure 21: North America Plastic Packaging Industry in Vietnam Revenue Share (%), by Country 2024 & 2032
- Figure 22: North America Plastic Packaging Industry in Vietnam Volume Share (%), by Country 2024 & 2032
- Figure 23: South America Plastic Packaging Industry in Vietnam Revenue (Million), by Type 2024 & 2032
- Figure 24: South America Plastic Packaging Industry in Vietnam Volume (Million), by Type 2024 & 2032
- Figure 25: South America Plastic Packaging Industry in Vietnam Revenue Share (%), by Type 2024 & 2032
- Figure 26: South America Plastic Packaging Industry in Vietnam Volume Share (%), by Type 2024 & 2032
- Figure 27: South America Plastic Packaging Industry in Vietnam Revenue (Million), by Technology 2024 & 2032
- Figure 28: South America Plastic Packaging Industry in Vietnam Volume (Million), by Technology 2024 & 2032
- Figure 29: South America Plastic Packaging Industry in Vietnam Revenue Share (%), by Technology 2024 & 2032
- Figure 30: South America Plastic Packaging Industry in Vietnam Volume Share (%), by Technology 2024 & 2032
- Figure 31: South America Plastic Packaging Industry in Vietnam Revenue (Million), by Application 2024 & 2032
- Figure 32: South America Plastic Packaging Industry in Vietnam Volume (Million), by Application 2024 & 2032
- Figure 33: South America Plastic Packaging Industry in Vietnam Revenue Share (%), by Application 2024 & 2032
- Figure 34: South America Plastic Packaging Industry in Vietnam Volume Share (%), by Application 2024 & 2032
- Figure 35: South America Plastic Packaging Industry in Vietnam Revenue (Million), by Country 2024 & 2032
- Figure 36: South America Plastic Packaging Industry in Vietnam Volume (Million), by Country 2024 & 2032
- Figure 37: South America Plastic Packaging Industry in Vietnam Revenue Share (%), by Country 2024 & 2032
- Figure 38: South America Plastic Packaging Industry in Vietnam Volume Share (%), by Country 2024 & 2032
- Figure 39: Europe Plastic Packaging Industry in Vietnam Revenue (Million), by Type 2024 & 2032
- Figure 40: Europe Plastic Packaging Industry in Vietnam Volume (Million), by Type 2024 & 2032
- Figure 41: Europe Plastic Packaging Industry in Vietnam Revenue Share (%), by Type 2024 & 2032
- Figure 42: Europe Plastic Packaging Industry in Vietnam Volume Share (%), by Type 2024 & 2032
- Figure 43: Europe Plastic Packaging Industry in Vietnam Revenue (Million), by Technology 2024 & 2032
- Figure 44: Europe Plastic Packaging Industry in Vietnam Volume (Million), by Technology 2024 & 2032
- Figure 45: Europe Plastic Packaging Industry in Vietnam Revenue Share (%), by Technology 2024 & 2032
- Figure 46: Europe Plastic Packaging Industry in Vietnam Volume Share (%), by Technology 2024 & 2032
- Figure 47: Europe Plastic Packaging Industry in Vietnam Revenue (Million), by Application 2024 & 2032
- Figure 48: Europe Plastic Packaging Industry in Vietnam Volume (Million), by Application 2024 & 2032
- Figure 49: Europe Plastic Packaging Industry in Vietnam Revenue Share (%), by Application 2024 & 2032
- Figure 50: Europe Plastic Packaging Industry in Vietnam Volume Share (%), by Application 2024 & 2032
- Figure 51: Europe Plastic Packaging Industry in Vietnam Revenue (Million), by Country 2024 & 2032
- Figure 52: Europe Plastic Packaging Industry in Vietnam Volume (Million), by Country 2024 & 2032
- Figure 53: Europe Plastic Packaging Industry in Vietnam Revenue Share (%), by Country 2024 & 2032
- Figure 54: Europe Plastic Packaging Industry in Vietnam Volume Share (%), by Country 2024 & 2032
- Figure 55: Middle East & Africa Plastic Packaging Industry in Vietnam Revenue (Million), by Type 2024 & 2032
- Figure 56: Middle East & Africa Plastic Packaging Industry in Vietnam Volume (Million), by Type 2024 & 2032
- Figure 57: Middle East & Africa Plastic Packaging Industry in Vietnam Revenue Share (%), by Type 2024 & 2032
- Figure 58: Middle East & Africa Plastic Packaging Industry in Vietnam Volume Share (%), by Type 2024 & 2032
- Figure 59: Middle East & Africa Plastic Packaging Industry in Vietnam Revenue (Million), by Technology 2024 & 2032
- Figure 60: Middle East & Africa Plastic Packaging Industry in Vietnam Volume (Million), by Technology 2024 & 2032
- Figure 61: Middle East & Africa Plastic Packaging Industry in Vietnam Revenue Share (%), by Technology 2024 & 2032
- Figure 62: Middle East & Africa Plastic Packaging Industry in Vietnam Volume Share (%), by Technology 2024 & 2032
- Figure 63: Middle East & Africa Plastic Packaging Industry in Vietnam Revenue (Million), by Application 2024 & 2032
- Figure 64: Middle East & Africa Plastic Packaging Industry in Vietnam Volume (Million), by Application 2024 & 2032
- Figure 65: Middle East & Africa Plastic Packaging Industry in Vietnam Revenue Share (%), by Application 2024 & 2032
- Figure 66: Middle East & Africa Plastic Packaging Industry in Vietnam Volume Share (%), by Application 2024 & 2032
- Figure 67: Middle East & Africa Plastic Packaging Industry in Vietnam Revenue (Million), by Country 2024 & 2032
- Figure 68: Middle East & Africa Plastic Packaging Industry in Vietnam Volume (Million), by Country 2024 & 2032
- Figure 69: Middle East & Africa Plastic Packaging Industry in Vietnam Revenue Share (%), by Country 2024 & 2032
- Figure 70: Middle East & Africa Plastic Packaging Industry in Vietnam Volume Share (%), by Country 2024 & 2032
- Figure 71: Asia Pacific Plastic Packaging Industry in Vietnam Revenue (Million), by Type 2024 & 2032
- Figure 72: Asia Pacific Plastic Packaging Industry in Vietnam Volume (Million), by Type 2024 & 2032
- Figure 73: Asia Pacific Plastic Packaging Industry in Vietnam Revenue Share (%), by Type 2024 & 2032
- Figure 74: Asia Pacific Plastic Packaging Industry in Vietnam Volume Share (%), by Type 2024 & 2032
- Figure 75: Asia Pacific Plastic Packaging Industry in Vietnam Revenue (Million), by Technology 2024 & 2032
- Figure 76: Asia Pacific Plastic Packaging Industry in Vietnam Volume (Million), by Technology 2024 & 2032
- Figure 77: Asia Pacific Plastic Packaging Industry in Vietnam Revenue Share (%), by Technology 2024 & 2032
- Figure 78: Asia Pacific Plastic Packaging Industry in Vietnam Volume Share (%), by Technology 2024 & 2032
- Figure 79: Asia Pacific Plastic Packaging Industry in Vietnam Revenue (Million), by Application 2024 & 2032
- Figure 80: Asia Pacific Plastic Packaging Industry in Vietnam Volume (Million), by Application 2024 & 2032
- Figure 81: Asia Pacific Plastic Packaging Industry in Vietnam Revenue Share (%), by Application 2024 & 2032
- Figure 82: Asia Pacific Plastic Packaging Industry in Vietnam Volume Share (%), by Application 2024 & 2032
- Figure 83: Asia Pacific Plastic Packaging Industry in Vietnam Revenue (Million), by Country 2024 & 2032
- Figure 84: Asia Pacific Plastic Packaging Industry in Vietnam Volume (Million), by Country 2024 & 2032
- Figure 85: Asia Pacific Plastic Packaging Industry in Vietnam Revenue Share (%), by Country 2024 & 2032
- Figure 86: Asia Pacific Plastic Packaging Industry in Vietnam Volume Share (%), by Country 2024 & 2032
List of Tables
- Table 1: Global Plastic Packaging Industry in Vietnam Revenue Million Forecast, by Region 2019 & 2032
- Table 2: Global Plastic Packaging Industry in Vietnam Volume Million Forecast, by Region 2019 & 2032
- Table 3: Global Plastic Packaging Industry in Vietnam Revenue Million Forecast, by Type 2019 & 2032
- Table 4: Global Plastic Packaging Industry in Vietnam Volume Million Forecast, by Type 2019 & 2032
- Table 5: Global Plastic Packaging Industry in Vietnam Revenue Million Forecast, by Technology 2019 & 2032
- Table 6: Global Plastic Packaging Industry in Vietnam Volume Million Forecast, by Technology 2019 & 2032
- Table 7: Global Plastic Packaging Industry in Vietnam Revenue Million Forecast, by Application 2019 & 2032
- Table 8: Global Plastic Packaging Industry in Vietnam Volume Million Forecast, by Application 2019 & 2032
- Table 9: Global Plastic Packaging Industry in Vietnam Revenue Million Forecast, by Region 2019 & 2032
- Table 10: Global Plastic Packaging Industry in Vietnam Volume Million Forecast, by Region 2019 & 2032
- Table 11: Global Plastic Packaging Industry in Vietnam Revenue Million Forecast, by Country 2019 & 2032
- Table 12: Global Plastic Packaging Industry in Vietnam Volume Million Forecast, by Country 2019 & 2032
- Table 13: Global Plastic Packaging Industry in Vietnam Revenue Million Forecast, by Type 2019 & 2032
- Table 14: Global Plastic Packaging Industry in Vietnam Volume Million Forecast, by Type 2019 & 2032
- Table 15: Global Plastic Packaging Industry in Vietnam Revenue Million Forecast, by Technology 2019 & 2032
- Table 16: Global Plastic Packaging Industry in Vietnam Volume Million Forecast, by Technology 2019 & 2032
- Table 17: Global Plastic Packaging Industry in Vietnam Revenue Million Forecast, by Application 2019 & 2032
- Table 18: Global Plastic Packaging Industry in Vietnam Volume Million Forecast, by Application 2019 & 2032
- Table 19: Global Plastic Packaging Industry in Vietnam Revenue Million Forecast, by Country 2019 & 2032
- Table 20: Global Plastic Packaging Industry in Vietnam Volume Million Forecast, by Country 2019 & 2032
- Table 21: United States Plastic Packaging Industry in Vietnam Revenue (Million) Forecast, by Application 2019 & 2032
- Table 22: United States Plastic Packaging Industry in Vietnam Volume (Million) Forecast, by Application 2019 & 2032
- Table 23: Canada Plastic Packaging Industry in Vietnam Revenue (Million) Forecast, by Application 2019 & 2032
- Table 24: Canada Plastic Packaging Industry in Vietnam Volume (Million) Forecast, by Application 2019 & 2032
- Table 25: Mexico Plastic Packaging Industry in Vietnam Revenue (Million) Forecast, by Application 2019 & 2032
- Table 26: Mexico Plastic Packaging Industry in Vietnam Volume (Million) Forecast, by Application 2019 & 2032
- Table 27: Global Plastic Packaging Industry in Vietnam Revenue Million Forecast, by Type 2019 & 2032
- Table 28: Global Plastic Packaging Industry in Vietnam Volume Million Forecast, by Type 2019 & 2032
- Table 29: Global Plastic Packaging Industry in Vietnam Revenue Million Forecast, by Technology 2019 & 2032
- Table 30: Global Plastic Packaging Industry in Vietnam Volume Million Forecast, by Technology 2019 & 2032
- Table 31: Global Plastic Packaging Industry in Vietnam Revenue Million Forecast, by Application 2019 & 2032
- Table 32: Global Plastic Packaging Industry in Vietnam Volume Million Forecast, by Application 2019 & 2032
- Table 33: Global Plastic Packaging Industry in Vietnam Revenue Million Forecast, by Country 2019 & 2032
- Table 34: Global Plastic Packaging Industry in Vietnam Volume Million Forecast, by Country 2019 & 2032
- Table 35: Brazil Plastic Packaging Industry in Vietnam Revenue (Million) Forecast, by Application 2019 & 2032
- Table 36: Brazil Plastic Packaging Industry in Vietnam Volume (Million) Forecast, by Application 2019 & 2032
- Table 37: Argentina Plastic Packaging Industry in Vietnam Revenue (Million) Forecast, by Application 2019 & 2032
- Table 38: Argentina Plastic Packaging Industry in Vietnam Volume (Million) Forecast, by Application 2019 & 2032
- Table 39: Rest of South America Plastic Packaging Industry in Vietnam Revenue (Million) Forecast, by Application 2019 & 2032
- Table 40: Rest of South America Plastic Packaging Industry in Vietnam Volume (Million) Forecast, by Application 2019 & 2032
- Table 41: Global Plastic Packaging Industry in Vietnam Revenue Million Forecast, by Type 2019 & 2032
- Table 42: Global Plastic Packaging Industry in Vietnam Volume Million Forecast, by Type 2019 & 2032
- Table 43: Global Plastic Packaging Industry in Vietnam Revenue Million Forecast, by Technology 2019 & 2032
- Table 44: Global Plastic Packaging Industry in Vietnam Volume Million Forecast, by Technology 2019 & 2032
- Table 45: Global Plastic Packaging Industry in Vietnam Revenue Million Forecast, by Application 2019 & 2032
- Table 46: Global Plastic Packaging Industry in Vietnam Volume Million Forecast, by Application 2019 & 2032
- Table 47: Global Plastic Packaging Industry in Vietnam Revenue Million Forecast, by Country 2019 & 2032
- Table 48: Global Plastic Packaging Industry in Vietnam Volume Million Forecast, by Country 2019 & 2032
- Table 49: United Kingdom Plastic Packaging Industry in Vietnam Revenue (Million) Forecast, by Application 2019 & 2032
- Table 50: United Kingdom Plastic Packaging Industry in Vietnam Volume (Million) Forecast, by Application 2019 & 2032
- Table 51: Germany Plastic Packaging Industry in Vietnam Revenue (Million) Forecast, by Application 2019 & 2032
- Table 52: Germany Plastic Packaging Industry in Vietnam Volume (Million) Forecast, by Application 2019 & 2032
- Table 53: France Plastic Packaging Industry in Vietnam Revenue (Million) Forecast, by Application 2019 & 2032
- Table 54: France Plastic Packaging Industry in Vietnam Volume (Million) Forecast, by Application 2019 & 2032
- Table 55: Italy Plastic Packaging Industry in Vietnam Revenue (Million) Forecast, by Application 2019 & 2032
- Table 56: Italy Plastic Packaging Industry in Vietnam Volume (Million) Forecast, by Application 2019 & 2032
- Table 57: Spain Plastic Packaging Industry in Vietnam Revenue (Million) Forecast, by Application 2019 & 2032
- Table 58: Spain Plastic Packaging Industry in Vietnam Volume (Million) Forecast, by Application 2019 & 2032
- Table 59: Russia Plastic Packaging Industry in Vietnam Revenue (Million) Forecast, by Application 2019 & 2032
- Table 60: Russia Plastic Packaging Industry in Vietnam Volume (Million) Forecast, by Application 2019 & 2032
- Table 61: Benelux Plastic Packaging Industry in Vietnam Revenue (Million) Forecast, by Application 2019 & 2032
- Table 62: Benelux Plastic Packaging Industry in Vietnam Volume (Million) Forecast, by Application 2019 & 2032
- Table 63: Nordics Plastic Packaging Industry in Vietnam Revenue (Million) Forecast, by Application 2019 & 2032
- Table 64: Nordics Plastic Packaging Industry in Vietnam Volume (Million) Forecast, by Application 2019 & 2032
- Table 65: Rest of Europe Plastic Packaging Industry in Vietnam Revenue (Million) Forecast, by Application 2019 & 2032
- Table 66: Rest of Europe Plastic Packaging Industry in Vietnam Volume (Million) Forecast, by Application 2019 & 2032
- Table 67: Global Plastic Packaging Industry in Vietnam Revenue Million Forecast, by Type 2019 & 2032
- Table 68: Global Plastic Packaging Industry in Vietnam Volume Million Forecast, by Type 2019 & 2032
- Table 69: Global Plastic Packaging Industry in Vietnam Revenue Million Forecast, by Technology 2019 & 2032
- Table 70: Global Plastic Packaging Industry in Vietnam Volume Million Forecast, by Technology 2019 & 2032
- Table 71: Global Plastic Packaging Industry in Vietnam Revenue Million Forecast, by Application 2019 & 2032
- Table 72: Global Plastic Packaging Industry in Vietnam Volume Million Forecast, by Application 2019 & 2032
- Table 73: Global Plastic Packaging Industry in Vietnam Revenue Million Forecast, by Country 2019 & 2032
- Table 74: Global Plastic Packaging Industry in Vietnam Volume Million Forecast, by Country 2019 & 2032
- Table 75: Turkey Plastic Packaging Industry in Vietnam Revenue (Million) Forecast, by Application 2019 & 2032
- Table 76: Turkey Plastic Packaging Industry in Vietnam Volume (Million) Forecast, by Application 2019 & 2032
- Table 77: Israel Plastic Packaging Industry in Vietnam Revenue (Million) Forecast, by Application 2019 & 2032
- Table 78: Israel Plastic Packaging Industry in Vietnam Volume (Million) Forecast, by Application 2019 & 2032
- Table 79: GCC Plastic Packaging Industry in Vietnam Revenue (Million) Forecast, by Application 2019 & 2032
- Table 80: GCC Plastic Packaging Industry in Vietnam Volume (Million) Forecast, by Application 2019 & 2032
- Table 81: North Africa Plastic Packaging Industry in Vietnam Revenue (Million) Forecast, by Application 2019 & 2032
- Table 82: North Africa Plastic Packaging Industry in Vietnam Volume (Million) Forecast, by Application 2019 & 2032
- Table 83: South Africa Plastic Packaging Industry in Vietnam Revenue (Million) Forecast, by Application 2019 & 2032
- Table 84: South Africa Plastic Packaging Industry in Vietnam Volume (Million) Forecast, by Application 2019 & 2032
- Table 85: Rest of Middle East & Africa Plastic Packaging Industry in Vietnam Revenue (Million) Forecast, by Application 2019 & 2032
- Table 86: Rest of Middle East & Africa Plastic Packaging Industry in Vietnam Volume (Million) Forecast, by Application 2019 & 2032
- Table 87: Global Plastic Packaging Industry in Vietnam Revenue Million Forecast, by Type 2019 & 2032
- Table 88: Global Plastic Packaging Industry in Vietnam Volume Million Forecast, by Type 2019 & 2032
- Table 89: Global Plastic Packaging Industry in Vietnam Revenue Million Forecast, by Technology 2019 & 2032
- Table 90: Global Plastic Packaging Industry in Vietnam Volume Million Forecast, by Technology 2019 & 2032
- Table 91: Global Plastic Packaging Industry in Vietnam Revenue Million Forecast, by Application 2019 & 2032
- Table 92: Global Plastic Packaging Industry in Vietnam Volume Million Forecast, by Application 2019 & 2032
- Table 93: Global Plastic Packaging Industry in Vietnam Revenue Million Forecast, by Country 2019 & 2032
- Table 94: Global Plastic Packaging Industry in Vietnam Volume Million Forecast, by Country 2019 & 2032
- Table 95: China Plastic Packaging Industry in Vietnam Revenue (Million) Forecast, by Application 2019 & 2032
- Table 96: China Plastic Packaging Industry in Vietnam Volume (Million) Forecast, by Application 2019 & 2032
- Table 97: India Plastic Packaging Industry in Vietnam Revenue (Million) Forecast, by Application 2019 & 2032
- Table 98: India Plastic Packaging Industry in Vietnam Volume (Million) Forecast, by Application 2019 & 2032
- Table 99: Japan Plastic Packaging Industry in Vietnam Revenue (Million) Forecast, by Application 2019 & 2032
- Table 100: Japan Plastic Packaging Industry in Vietnam Volume (Million) Forecast, by Application 2019 & 2032
- Table 101: South Korea Plastic Packaging Industry in Vietnam Revenue (Million) Forecast, by Application 2019 & 2032
- Table 102: South Korea Plastic Packaging Industry in Vietnam Volume (Million) Forecast, by Application 2019 & 2032
- Table 103: ASEAN Plastic Packaging Industry in Vietnam Revenue (Million) Forecast, by Application 2019 & 2032
- Table 104: ASEAN Plastic Packaging Industry in Vietnam Volume (Million) Forecast, by Application 2019 & 2032
- Table 105: Oceania Plastic Packaging Industry in Vietnam Revenue (Million) Forecast, by Application 2019 & 2032
- Table 106: Oceania Plastic Packaging Industry in Vietnam Volume (Million) Forecast, by Application 2019 & 2032
- Table 107: Rest of Asia Pacific Plastic Packaging Industry in Vietnam Revenue (Million) Forecast, by Application 2019 & 2032
- Table 108: Rest of Asia Pacific Plastic Packaging Industry in Vietnam Volume (Million) Forecast, by Application 2019 & 2032
Frequently Asked Questions
1. What is the projected Compound Annual Growth Rate (CAGR) of the Plastic Packaging Industry in Vietnam?
The projected CAGR is approximately 8.44%.
2. Which companies are prominent players in the Plastic Packaging Industry in Vietnam?
Key companies in the market include Hyosung Chemical, Far Eastern New Century Corporation, Vietnam Polystyrene Co Ltd, Vinaplast *List Not Exhaustive, Nsrp Llc, Toray Industries Inc, Nan Ya Plastics Corporation, Agc Inc, Vietnam Oil And Gas Group, Scg Chemicals Public Company Limited, Lyondellbasell Industries Holdings Bv, Billion Industrial Holdings Limited.
3. What are the main segments of the Plastic Packaging Industry in Vietnam?
The market segments include Type, Technology, Application.
4. Can you provide details about the market size?
The market size is estimated to be USD 10.07 Million as of 2022.
5. What are some drivers contributing to market growth?
Growing Demand from the Construction Sector; Other Drivers.
6. What are the notable trends driving market growth?
Extrusion Technology to Dominate the Market.
7. Are there any restraints impacting market growth?
Over-reliance on Imports of Raw Materials and Finished Plastics; Environmental Concerns of Plastics and the Availability of New Substitutes.
8. Can you provide examples of recent developments in the market?
In September 2022, Billion Industrial Holdings Limited announced the expansion of the manufacturing facilities for polyester bottle chips in Vietnam. This manufacturing facility will have a production capacity of 300,000 tons of polyethylene terephthalate resin.
9. What pricing options are available for accessing the report?
Pricing options include single-user, multi-user, and enterprise licenses priced at USD 3800, USD 4500, and USD 5800 respectively.
10. Is the market size provided in terms of value or volume?
The market size is provided in terms of value, measured in Million and volume, measured in Million.
11. Are there any specific market keywords associated with the report?
Yes, the market keyword associated with the report is "Plastic Packaging Industry in Vietnam," which aids in identifying and referencing the specific market segment covered.
12. How do I determine which pricing option suits my needs best?
The pricing options vary based on user requirements and access needs. Individual users may opt for single-user licenses, while businesses requiring broader access may choose multi-user or enterprise licenses for cost-effective access to the report.
13. Are there any additional resources or data provided in the Plastic Packaging Industry in Vietnam report?
While the report offers comprehensive insights, it's advisable to review the specific contents or supplementary materials provided to ascertain if additional resources or data are available.
14. How can I stay updated on further developments or reports in the Plastic Packaging Industry in Vietnam?
To stay informed about further developments, trends, and reports in the Plastic Packaging Industry in Vietnam, consider subscribing to industry newsletters, following relevant companies and organizations, or regularly checking reputable industry news sources and publications.
Methodology
Step 1 - Identification of Relevant Samples Size from Population Database


Step 2 - Approaches for Defining Global Market Size (Value, Volume* & Price*)

Note*: In applicable scenarios
Step 3 - Data Sources
Primary Research
- Web Analytics
- Survey Reports
- Research Institute
- Latest Research Reports
- Opinion Leaders
Secondary Research
- Annual Reports
- White Paper
- Latest Press Release
- Industry Association
- Paid Database
- Investor Presentations

Step 4 - Data Triangulation
Involves using different sources of information in order to increase the validity of a study
These sources are likely to be stakeholders in a program - participants, other researchers, program staff, other community members, and so on.
Then we put all data in single framework & apply various statistical tools to find out the dynamic on the market.
During the analysis stage, feedback from the stakeholder groups would be compared to determine areas of agreement as well as areas of divergence


