
Key Insights
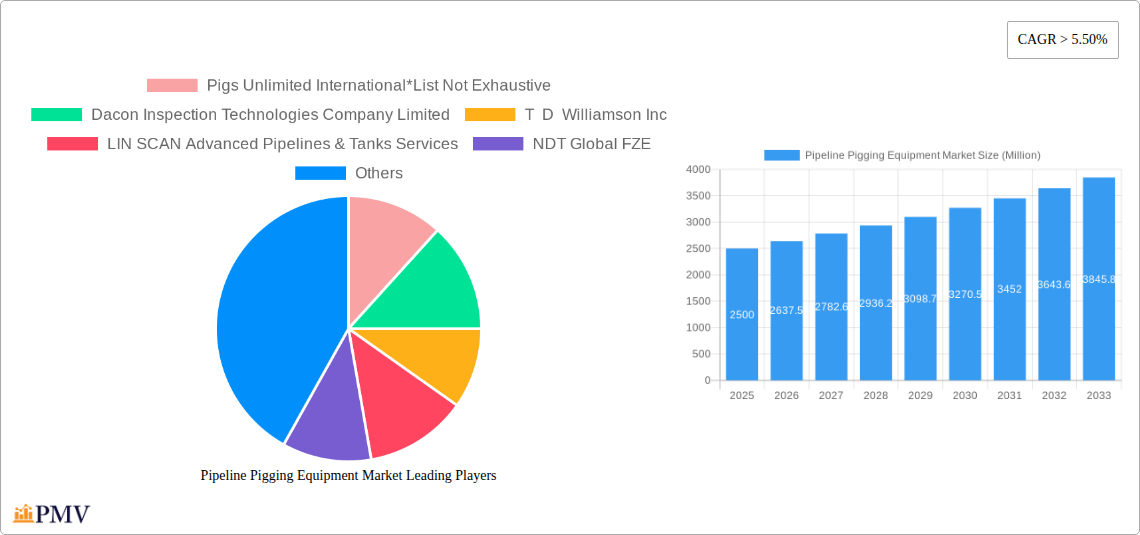
The global pipeline pigging equipment market is experiencing robust growth, driven by increasing investments in pipeline infrastructure development and maintenance across various regions. The market's Compound Annual Growth Rate (CAGR) exceeding 5.50% from 2019 to 2024 signifies a consistent demand for efficient and reliable pipeline cleaning and inspection solutions. This growth is fueled by several factors, including the rising need to optimize pipeline operations, enhance safety standards, and prevent costly downtime caused by blockages or corrosion. The expanding oil and gas industries, coupled with a growing emphasis on environmental protection and regulatory compliance, are further propelling market expansion. Key applications such as oil and gas pipelines are leading the demand, with significant contributions from pipeline pig products and replacement components like pig passage indicators, trackers, launching/receiving systems, and cleaning equipment.
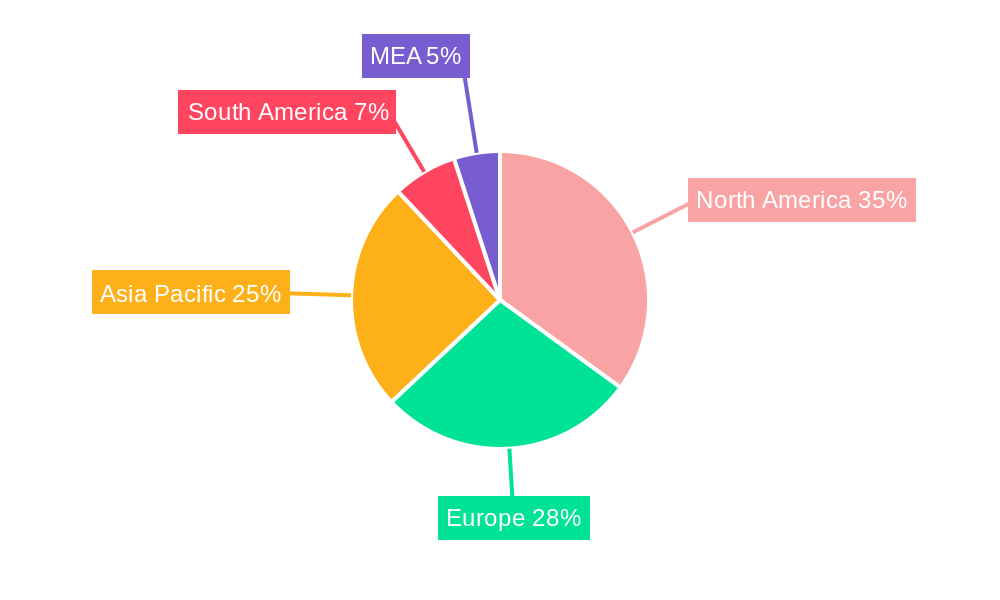
Market segmentation reveals a diverse landscape, with North America and Europe currently holding significant market shares due to established pipeline networks and stringent regulatory frameworks. However, the Asia-Pacific region is anticipated to exhibit substantial growth in the coming years, driven by rapid industrialization and infrastructure development projects. Competition within the market is intense, with established players like Baker Hughes a GE Co, T D Williamson Inc, and Xylem Inc competing with specialized companies focusing on pigging equipment. The market's future outlook remains positive, with continued growth expected throughout the forecast period (2025-2033) due to increasing pipeline capacity expansions, aging infrastructure upgrades and the ongoing demand for sophisticated pigging technologies to ensure pipeline integrity and operational efficiency. The strategic adoption of advanced technologies, such as intelligent pigs and data analytics, will further contribute to market expansion and differentiation among market players. Focus will also remain on addressing environmental concerns via eco-friendly pigging solutions.
Pipeline Pigging Equipment Market: A Comprehensive Market Analysis Report (2019-2033)
This in-depth report provides a comprehensive analysis of the global Pipeline Pigging Equipment market, offering valuable insights into market dynamics, competitive landscapes, and future growth prospects. Covering the period from 2019 to 2033, with a base year of 2025 and a forecast period from 2025 to 2033, this report is an essential resource for industry stakeholders, investors, and anyone seeking to understand this critical sector. The market is segmented by application (Oil Pipeline, Gas Pipeline) and product type (Pipeline Pig Products, Replacement Components: Pig Passage Indicators, Pig Trackers and Indicators, Pig Launching and Receiving, Pig Washer Equipment, Closures).
Pipeline Pigging Equipment Market Market Structure & Competitive Dynamics
The global pipeline pigging equipment market exhibits a moderately concentrated structure, with a few key players holding significant market share. The market share of the top five players is estimated at xx%, reflecting a competitive landscape characterized by both established multinational corporations and specialized niche players. Innovation plays a pivotal role, with ongoing R&D efforts focused on enhancing pigging technology, improving efficiency, and reducing operational costs. Regulatory frameworks, particularly those related to environmental protection and pipeline safety, significantly influence market dynamics. The presence of substitute technologies, while limited, necessitates continuous product innovation. End-user trends, notably the increasing adoption of smart pigging technologies and the demand for advanced data analytics, are shaping market growth. M&A activities within the sector have been moderate, with deal values averaging around xx Million USD annually over the past five years. Recent mergers have primarily focused on expanding geographic reach and technological capabilities.
Pipeline Pigging Equipment Market Industry Trends & Insights
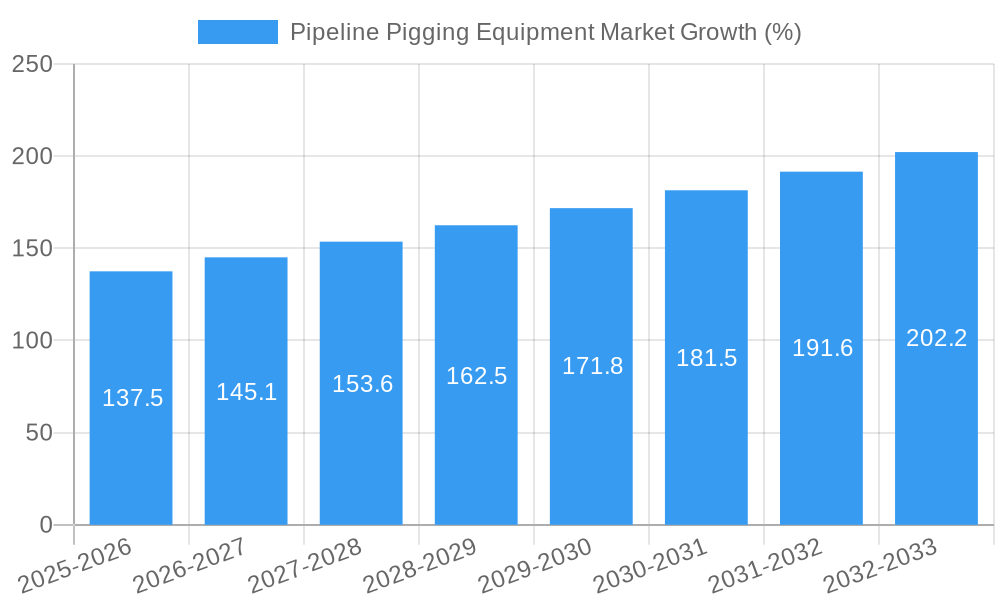
The pipeline pigging equipment market is projected to experience a CAGR of xx% during the forecast period (2025-2033), driven by several key factors. The expanding global oil and gas infrastructure, particularly in developing economies, is a major growth driver. Technological advancements, such as the integration of smart sensors and data analytics into pigging systems, are enhancing efficiency and enabling predictive maintenance. Furthermore, increasing concerns about pipeline safety and environmental regulations are propelling the demand for advanced pigging technologies. However, fluctuating oil and gas prices and the cyclical nature of the energy industry pose significant challenges. The market penetration of advanced pigging technologies remains relatively low, with significant potential for future growth. Competitive dynamics are intensifying, with companies investing in R&D to develop innovative products and services. The overall market size in 2025 is estimated at xx Million USD, projected to reach xx Million USD by 2033.
Dominant Markets & Segments in Pipeline Pigging Equipment Market
The Oil Pipeline application segment dominates the pipeline pigging equipment market, accounting for approximately xx% of the total market revenue in 2025. This dominance is attributed to the larger scale and higher frequency of pigging operations in oil pipelines compared to gas pipelines.
- Key Drivers for Oil Pipeline Dominance:
- Extensive existing oil pipeline infrastructure globally.
- Higher frequency of pipeline cleaning and inspection requirements.
- Stringent regulations related to oil spill prevention.
The Pipeline Pig Products segment holds the largest share within the product category, followed by Replacement Components (Pig Passage Indicators, Pig Trackers and Indicators, etc.). The North American region currently holds the largest market share, fueled by substantial investments in pipeline infrastructure and stringent environmental regulations. However, rapid growth is expected in the Asia-Pacific region, driven by significant investments in energy infrastructure development.
Pipeline Pigging Equipment Market Product Innovations
Recent product developments focus on integrating advanced sensors and data analytics into pipeline pigging equipment. This allows for real-time monitoring of pipeline conditions, improving efficiency, reducing downtime, and enhancing safety. Smart pigging technologies, employing advanced data acquisition and analysis capabilities, are gaining traction, offering significant competitive advantages by enabling predictive maintenance and optimized pipeline management. These innovations are well-aligned with the industry's increasing focus on operational efficiency and data-driven decision-making.
Report Segmentation & Scope
The report segments the market by application (Oil Pipeline and Gas Pipeline) and product type (Pipeline Pig Products, Replacement Components – Pig Passage Indicators, Pig Trackers and Indicators, Pig Launching and Receiving, Pig Washer Equipment, Closures). Each segment is analyzed individually, providing detailed market size projections, growth rates, and competitive dynamics. For instance, the Pig Passage Indicators segment is expected to exhibit robust growth due to the increasing demand for enhanced pipeline monitoring capabilities. Similarly, the Pig Launching and Receiving equipment segment is poised for growth due to increasing automation needs in the industry. The detailed analysis across these segments provides a comprehensive overview of the market landscape.
Key Drivers of Pipeline Pigging Equipment Market Growth
Several key factors are driving the growth of the pipeline pigging equipment market. Firstly, the ongoing expansion of oil and gas pipeline infrastructure globally, particularly in emerging economies, creates substantial demand. Secondly, increasing regulatory scrutiny and stricter environmental regulations are pushing for enhanced pipeline inspection and maintenance practices, boosting the adoption of advanced pigging technologies. Thirdly, technological advancements, including the development of smart pigging systems and data analytics tools, improve efficiency and reduce operational costs, making pipeline pigging a more attractive option.
Challenges in the Pipeline Pigging Equipment Market Sector
The pipeline pigging equipment market faces several challenges. Fluctuating oil and gas prices create uncertainty in investment decisions. Supply chain disruptions and material cost increases can impact production and pricing. Intense competition among established players and new entrants necessitates continuous innovation and cost optimization. Furthermore, stringent regulatory requirements and compliance costs can increase the overall operational burden for companies. These factors can collectively impact market growth trajectory.
Leading Players in the Pipeline Pigging Equipment Market Market
- Pigs Unlimited International
- Dacon Inspection Technologies Company Limited
- T D Williamson Inc
- LIN SCAN Advanced Pipelines & Tanks Services
- NDT Global FZE
- Xylem Inc
- 3P Services GmbH & Co KG
- Russell NDE Systems
- Baker Hughes a GE Co
Key Developments in Pipeline Pigging Equipment Market Sector
- 2024 Q4: Pigs Unlimited International launched a new generation of smart pigs with enhanced data acquisition capabilities.
- 2023 Q3: T D Williamson Inc. acquired a smaller competitor, expanding its market reach in the Asia-Pacific region.
- 2022 Q1: Significant investments in R&D by several key players focused on improving the efficiency and reliability of pigging systems.
- 2021 Q2: New environmental regulations in the EU impacted the design and material specifications of pigging equipment.
Strategic Pipeline Pigging Equipment Market Market Outlook
The pipeline pigging equipment market is poised for continued growth, driven by the expansion of oil and gas infrastructure, technological advancements, and increasingly stringent environmental regulations. Strategic opportunities exist for companies focusing on innovation in smart pigging technologies, data analytics, and automation. The market's future growth will be significantly influenced by the global energy landscape, with investments in renewable energy potentially impacting the long-term outlook. However, the overall market potential remains substantial, presenting attractive opportunities for businesses within this sector.
Pipeline Pigging Equipment Market Segmentation
-
1. Application
- 1.1. Oil Pipeline
- 1.2. Gas Pipeline
-
2. Products
-
2.1. Pipeline Pig Products
- 2.1.1. Batching Pigs
- 2.1.2. Cleaning Pigs
- 2.1.3. Gauging Pigs
- 2.1.4. Liquids Displacement Pigs
- 2.1.5. Special Application Pigs
- 2.1.6. Replacement Components
- 2.2. Pig Passage Indicators
- 2.3. Pig Trackers and Indicators
- 2.4. Pig Launching and Receiving
- 2.5. Pig Washer Equipment
- 2.6. Closures
-
2.1. Pipeline Pig Products
Pipeline Pigging Equipment Market Segmentation By Geography
- 1. North America
- 2. Europe
- 3. Asia Pacific
- 4. South America
- 5. Middle East and Africa
Pipeline Pigging Equipment Market REPORT HIGHLIGHTS
| Aspects | Details |
|---|---|
| Study Period | 2019-2033 |
| Base Year | 2024 |
| Estimated Year | 2025 |
| Forecast Period | 2025-2033 |
| Historical Period | 2019-2024 |
| Growth Rate | CAGR of > 5.50% from 2019-2033 |
| Segmentation |
|
Table of Contents
- 1. Introduction
- 1.1. Research Scope
- 1.2. Market Segmentation
- 1.3. Research Methodology
- 1.4. Definitions and Assumptions
- 2. Executive Summary
- 2.1. Introduction
- 3. Market Dynamics
- 3.1. Introduction
- 3.2. Market Drivers
- 3.2.1. 4.; The Rise in Oil and Gas Drilling Activities4.; Increased Shale Gas Exploration
- 3.3. Market Restrains
- 3.3.1. 4.; Increasing Share of Renewable Energy
- 3.4. Market Trends
- 3.4.1. Gas Pipeline Pigging System to Dominate the Market
- 4. Market Factor Analysis
- 4.1. Porters Five Forces
- 4.2. Supply/Value Chain
- 4.3. PESTEL analysis
- 4.4. Market Entropy
- 4.5. Patent/Trademark Analysis
- 5. Global Pipeline Pigging Equipment Market Analysis, Insights and Forecast, 2019-2031
- 5.1. Market Analysis, Insights and Forecast - by Application
- 5.1.1. Oil Pipeline
- 5.1.2. Gas Pipeline
- 5.2. Market Analysis, Insights and Forecast - by Products
- 5.2.1. Pipeline Pig Products
- 5.2.1.1. Batching Pigs
- 5.2.1.2. Cleaning Pigs
- 5.2.1.3. Gauging Pigs
- 5.2.1.4. Liquids Displacement Pigs
- 5.2.1.5. Special Application Pigs
- 5.2.1.6. Replacement Components
- 5.2.2. Pig Passage Indicators
- 5.2.3. Pig Trackers and Indicators
- 5.2.4. Pig Launching and Receiving
- 5.2.5. Pig Washer Equipment
- 5.2.6. Closures
- 5.2.1. Pipeline Pig Products
- 5.3. Market Analysis, Insights and Forecast - by Region
- 5.3.1. North America
- 5.3.2. Europe
- 5.3.3. Asia Pacific
- 5.3.4. South America
- 5.3.5. Middle East and Africa
- 5.1. Market Analysis, Insights and Forecast - by Application
- 6. North America Pipeline Pigging Equipment Market Analysis, Insights and Forecast, 2019-2031
- 6.1. Market Analysis, Insights and Forecast - by Application
- 6.1.1. Oil Pipeline
- 6.1.2. Gas Pipeline
- 6.2. Market Analysis, Insights and Forecast - by Products
- 6.2.1. Pipeline Pig Products
- 6.2.1.1. Batching Pigs
- 6.2.1.2. Cleaning Pigs
- 6.2.1.3. Gauging Pigs
- 6.2.1.4. Liquids Displacement Pigs
- 6.2.1.5. Special Application Pigs
- 6.2.1.6. Replacement Components
- 6.2.2. Pig Passage Indicators
- 6.2.3. Pig Trackers and Indicators
- 6.2.4. Pig Launching and Receiving
- 6.2.5. Pig Washer Equipment
- 6.2.6. Closures
- 6.2.1. Pipeline Pig Products
- 6.1. Market Analysis, Insights and Forecast - by Application
- 7. Europe Pipeline Pigging Equipment Market Analysis, Insights and Forecast, 2019-2031
- 7.1. Market Analysis, Insights and Forecast - by Application
- 7.1.1. Oil Pipeline
- 7.1.2. Gas Pipeline
- 7.2. Market Analysis, Insights and Forecast - by Products
- 7.2.1. Pipeline Pig Products
- 7.2.1.1. Batching Pigs
- 7.2.1.2. Cleaning Pigs
- 7.2.1.3. Gauging Pigs
- 7.2.1.4. Liquids Displacement Pigs
- 7.2.1.5. Special Application Pigs
- 7.2.1.6. Replacement Components
- 7.2.2. Pig Passage Indicators
- 7.2.3. Pig Trackers and Indicators
- 7.2.4. Pig Launching and Receiving
- 7.2.5. Pig Washer Equipment
- 7.2.6. Closures
- 7.2.1. Pipeline Pig Products
- 7.1. Market Analysis, Insights and Forecast - by Application
- 8. Asia Pacific Pipeline Pigging Equipment Market Analysis, Insights and Forecast, 2019-2031
- 8.1. Market Analysis, Insights and Forecast - by Application
- 8.1.1. Oil Pipeline
- 8.1.2. Gas Pipeline
- 8.2. Market Analysis, Insights and Forecast - by Products
- 8.2.1. Pipeline Pig Products
- 8.2.1.1. Batching Pigs
- 8.2.1.2. Cleaning Pigs
- 8.2.1.3. Gauging Pigs
- 8.2.1.4. Liquids Displacement Pigs
- 8.2.1.5. Special Application Pigs
- 8.2.1.6. Replacement Components
- 8.2.2. Pig Passage Indicators
- 8.2.3. Pig Trackers and Indicators
- 8.2.4. Pig Launching and Receiving
- 8.2.5. Pig Washer Equipment
- 8.2.6. Closures
- 8.2.1. Pipeline Pig Products
- 8.1. Market Analysis, Insights and Forecast - by Application
- 9. South America Pipeline Pigging Equipment Market Analysis, Insights and Forecast, 2019-2031
- 9.1. Market Analysis, Insights and Forecast - by Application
- 9.1.1. Oil Pipeline
- 9.1.2. Gas Pipeline
- 9.2. Market Analysis, Insights and Forecast - by Products
- 9.2.1. Pipeline Pig Products
- 9.2.1.1. Batching Pigs
- 9.2.1.2. Cleaning Pigs
- 9.2.1.3. Gauging Pigs
- 9.2.1.4. Liquids Displacement Pigs
- 9.2.1.5. Special Application Pigs
- 9.2.1.6. Replacement Components
- 9.2.2. Pig Passage Indicators
- 9.2.3. Pig Trackers and Indicators
- 9.2.4. Pig Launching and Receiving
- 9.2.5. Pig Washer Equipment
- 9.2.6. Closures
- 9.2.1. Pipeline Pig Products
- 9.1. Market Analysis, Insights and Forecast - by Application
- 10. Middle East and Africa Pipeline Pigging Equipment Market Analysis, Insights and Forecast, 2019-2031
- 10.1. Market Analysis, Insights and Forecast - by Application
- 10.1.1. Oil Pipeline
- 10.1.2. Gas Pipeline
- 10.2. Market Analysis, Insights and Forecast - by Products
- 10.2.1. Pipeline Pig Products
- 10.2.1.1. Batching Pigs
- 10.2.1.2. Cleaning Pigs
- 10.2.1.3. Gauging Pigs
- 10.2.1.4. Liquids Displacement Pigs
- 10.2.1.5. Special Application Pigs
- 10.2.1.6. Replacement Components
- 10.2.2. Pig Passage Indicators
- 10.2.3. Pig Trackers and Indicators
- 10.2.4. Pig Launching and Receiving
- 10.2.5. Pig Washer Equipment
- 10.2.6. Closures
- 10.2.1. Pipeline Pig Products
- 10.1. Market Analysis, Insights and Forecast - by Application
- 11. North America Pipeline Pigging Equipment Market Analysis, Insights and Forecast, 2019-2031
- 11.1. Market Analysis, Insights and Forecast - By Country/Sub-region
- 11.1.1 United States
- 11.1.2 Canada
- 11.1.3 Mexico
- 12. Europe Pipeline Pigging Equipment Market Analysis, Insights and Forecast, 2019-2031
- 12.1. Market Analysis, Insights and Forecast - By Country/Sub-region
- 12.1.1 Germany
- 12.1.2 United Kingdom
- 12.1.3 France
- 12.1.4 Spain
- 12.1.5 Italy
- 12.1.6 Spain
- 12.1.7 Belgium
- 12.1.8 Netherland
- 12.1.9 Nordics
- 12.1.10 Rest of Europe
- 13. Asia Pacific Pipeline Pigging Equipment Market Analysis, Insights and Forecast, 2019-2031
- 13.1. Market Analysis, Insights and Forecast - By Country/Sub-region
- 13.1.1 China
- 13.1.2 Japan
- 13.1.3 India
- 13.1.4 South Korea
- 13.1.5 Southeast Asia
- 13.1.6 Australia
- 13.1.7 Indonesia
- 13.1.8 Phillipes
- 13.1.9 Singapore
- 13.1.10 Thailandc
- 13.1.11 Rest of Asia Pacific
- 14. South America Pipeline Pigging Equipment Market Analysis, Insights and Forecast, 2019-2031
- 14.1. Market Analysis, Insights and Forecast - By Country/Sub-region
- 14.1.1 Brazil
- 14.1.2 Argentina
- 14.1.3 Peru
- 14.1.4 Chile
- 14.1.5 Colombia
- 14.1.6 Ecuador
- 14.1.7 Venezuela
- 14.1.8 Rest of South America
- 15. North America Pipeline Pigging Equipment Market Analysis, Insights and Forecast, 2019-2031
- 15.1. Market Analysis, Insights and Forecast - By Country/Sub-region
- 15.1.1 United States
- 15.1.2 Canada
- 15.1.3 Mexico
- 16. MEA Pipeline Pigging Equipment Market Analysis, Insights and Forecast, 2019-2031
- 16.1. Market Analysis, Insights and Forecast - By Country/Sub-region
- 16.1.1 United Arab Emirates
- 16.1.2 Saudi Arabia
- 16.1.3 South Africa
- 16.1.4 Rest of Middle East and Africa
- 17. Competitive Analysis
- 17.1. Global Market Share Analysis 2024
- 17.2. Company Profiles
- 17.2.1 Pigs Unlimited International*List Not Exhaustive
- 17.2.1.1. Overview
- 17.2.1.2. Products
- 17.2.1.3. SWOT Analysis
- 17.2.1.4. Recent Developments
- 17.2.1.5. Financials (Based on Availability)
- 17.2.2 Dacon Inspection Technologies Company Limited
- 17.2.2.1. Overview
- 17.2.2.2. Products
- 17.2.2.3. SWOT Analysis
- 17.2.2.4. Recent Developments
- 17.2.2.5. Financials (Based on Availability)
- 17.2.3 T D Williamson Inc
- 17.2.3.1. Overview
- 17.2.3.2. Products
- 17.2.3.3. SWOT Analysis
- 17.2.3.4. Recent Developments
- 17.2.3.5. Financials (Based on Availability)
- 17.2.4 LIN SCAN Advanced Pipelines & Tanks Services
- 17.2.4.1. Overview
- 17.2.4.2. Products
- 17.2.4.3. SWOT Analysis
- 17.2.4.4. Recent Developments
- 17.2.4.5. Financials (Based on Availability)
- 17.2.5 NDT Global FZE
- 17.2.5.1. Overview
- 17.2.5.2. Products
- 17.2.5.3. SWOT Analysis
- 17.2.5.4. Recent Developments
- 17.2.5.5. Financials (Based on Availability)
- 17.2.6 Xylem Inc
- 17.2.6.1. Overview
- 17.2.6.2. Products
- 17.2.6.3. SWOT Analysis
- 17.2.6.4. Recent Developments
- 17.2.6.5. Financials (Based on Availability)
- 17.2.7 3P Services GmbH & Co KG
- 17.2.7.1. Overview
- 17.2.7.2. Products
- 17.2.7.3. SWOT Analysis
- 17.2.7.4. Recent Developments
- 17.2.7.5. Financials (Based on Availability)
- 17.2.8 Russell NDE Systems
- 17.2.8.1. Overview
- 17.2.8.2. Products
- 17.2.8.3. SWOT Analysis
- 17.2.8.4. Recent Developments
- 17.2.8.5. Financials (Based on Availability)
- 17.2.9 Baker Hughes a GE Co
- 17.2.9.1. Overview
- 17.2.9.2. Products
- 17.2.9.3. SWOT Analysis
- 17.2.9.4. Recent Developments
- 17.2.9.5. Financials (Based on Availability)
- 17.2.1 Pigs Unlimited International*List Not Exhaustive
List of Figures
- Figure 1: Global Pipeline Pigging Equipment Market Revenue Breakdown (Million, %) by Region 2024 & 2032
- Figure 2: Global Pipeline Pigging Equipment Market Volume Breakdown (Kiloton, %) by Region 2024 & 2032
- Figure 3: North America Pipeline Pigging Equipment Market Revenue (Million), by Country 2024 & 2032
- Figure 4: North America Pipeline Pigging Equipment Market Volume (Kiloton), by Country 2024 & 2032
- Figure 5: North America Pipeline Pigging Equipment Market Revenue Share (%), by Country 2024 & 2032
- Figure 6: North America Pipeline Pigging Equipment Market Volume Share (%), by Country 2024 & 2032
- Figure 7: Europe Pipeline Pigging Equipment Market Revenue (Million), by Country 2024 & 2032
- Figure 8: Europe Pipeline Pigging Equipment Market Volume (Kiloton), by Country 2024 & 2032
- Figure 9: Europe Pipeline Pigging Equipment Market Revenue Share (%), by Country 2024 & 2032
- Figure 10: Europe Pipeline Pigging Equipment Market Volume Share (%), by Country 2024 & 2032
- Figure 11: Asia Pacific Pipeline Pigging Equipment Market Revenue (Million), by Country 2024 & 2032
- Figure 12: Asia Pacific Pipeline Pigging Equipment Market Volume (Kiloton), by Country 2024 & 2032
- Figure 13: Asia Pacific Pipeline Pigging Equipment Market Revenue Share (%), by Country 2024 & 2032
- Figure 14: Asia Pacific Pipeline Pigging Equipment Market Volume Share (%), by Country 2024 & 2032
- Figure 15: South America Pipeline Pigging Equipment Market Revenue (Million), by Country 2024 & 2032
- Figure 16: South America Pipeline Pigging Equipment Market Volume (Kiloton), by Country 2024 & 2032
- Figure 17: South America Pipeline Pigging Equipment Market Revenue Share (%), by Country 2024 & 2032
- Figure 18: South America Pipeline Pigging Equipment Market Volume Share (%), by Country 2024 & 2032
- Figure 19: North America Pipeline Pigging Equipment Market Revenue (Million), by Country 2024 & 2032
- Figure 20: North America Pipeline Pigging Equipment Market Volume (Kiloton), by Country 2024 & 2032
- Figure 21: North America Pipeline Pigging Equipment Market Revenue Share (%), by Country 2024 & 2032
- Figure 22: North America Pipeline Pigging Equipment Market Volume Share (%), by Country 2024 & 2032
- Figure 23: MEA Pipeline Pigging Equipment Market Revenue (Million), by Country 2024 & 2032
- Figure 24: MEA Pipeline Pigging Equipment Market Volume (Kiloton), by Country 2024 & 2032
- Figure 25: MEA Pipeline Pigging Equipment Market Revenue Share (%), by Country 2024 & 2032
- Figure 26: MEA Pipeline Pigging Equipment Market Volume Share (%), by Country 2024 & 2032
- Figure 27: North America Pipeline Pigging Equipment Market Revenue (Million), by Application 2024 & 2032
- Figure 28: North America Pipeline Pigging Equipment Market Volume (Kiloton), by Application 2024 & 2032
- Figure 29: North America Pipeline Pigging Equipment Market Revenue Share (%), by Application 2024 & 2032
- Figure 30: North America Pipeline Pigging Equipment Market Volume Share (%), by Application 2024 & 2032
- Figure 31: North America Pipeline Pigging Equipment Market Revenue (Million), by Products 2024 & 2032
- Figure 32: North America Pipeline Pigging Equipment Market Volume (Kiloton), by Products 2024 & 2032
- Figure 33: North America Pipeline Pigging Equipment Market Revenue Share (%), by Products 2024 & 2032
- Figure 34: North America Pipeline Pigging Equipment Market Volume Share (%), by Products 2024 & 2032
- Figure 35: North America Pipeline Pigging Equipment Market Revenue (Million), by Country 2024 & 2032
- Figure 36: North America Pipeline Pigging Equipment Market Volume (Kiloton), by Country 2024 & 2032
- Figure 37: North America Pipeline Pigging Equipment Market Revenue Share (%), by Country 2024 & 2032
- Figure 38: North America Pipeline Pigging Equipment Market Volume Share (%), by Country 2024 & 2032
- Figure 39: Europe Pipeline Pigging Equipment Market Revenue (Million), by Application 2024 & 2032
- Figure 40: Europe Pipeline Pigging Equipment Market Volume (Kiloton), by Application 2024 & 2032
- Figure 41: Europe Pipeline Pigging Equipment Market Revenue Share (%), by Application 2024 & 2032
- Figure 42: Europe Pipeline Pigging Equipment Market Volume Share (%), by Application 2024 & 2032
- Figure 43: Europe Pipeline Pigging Equipment Market Revenue (Million), by Products 2024 & 2032
- Figure 44: Europe Pipeline Pigging Equipment Market Volume (Kiloton), by Products 2024 & 2032
- Figure 45: Europe Pipeline Pigging Equipment Market Revenue Share (%), by Products 2024 & 2032
- Figure 46: Europe Pipeline Pigging Equipment Market Volume Share (%), by Products 2024 & 2032
- Figure 47: Europe Pipeline Pigging Equipment Market Revenue (Million), by Country 2024 & 2032
- Figure 48: Europe Pipeline Pigging Equipment Market Volume (Kiloton), by Country 2024 & 2032
- Figure 49: Europe Pipeline Pigging Equipment Market Revenue Share (%), by Country 2024 & 2032
- Figure 50: Europe Pipeline Pigging Equipment Market Volume Share (%), by Country 2024 & 2032
- Figure 51: Asia Pacific Pipeline Pigging Equipment Market Revenue (Million), by Application 2024 & 2032
- Figure 52: Asia Pacific Pipeline Pigging Equipment Market Volume (Kiloton), by Application 2024 & 2032
- Figure 53: Asia Pacific Pipeline Pigging Equipment Market Revenue Share (%), by Application 2024 & 2032
- Figure 54: Asia Pacific Pipeline Pigging Equipment Market Volume Share (%), by Application 2024 & 2032
- Figure 55: Asia Pacific Pipeline Pigging Equipment Market Revenue (Million), by Products 2024 & 2032
- Figure 56: Asia Pacific Pipeline Pigging Equipment Market Volume (Kiloton), by Products 2024 & 2032
- Figure 57: Asia Pacific Pipeline Pigging Equipment Market Revenue Share (%), by Products 2024 & 2032
- Figure 58: Asia Pacific Pipeline Pigging Equipment Market Volume Share (%), by Products 2024 & 2032
- Figure 59: Asia Pacific Pipeline Pigging Equipment Market Revenue (Million), by Country 2024 & 2032
- Figure 60: Asia Pacific Pipeline Pigging Equipment Market Volume (Kiloton), by Country 2024 & 2032
- Figure 61: Asia Pacific Pipeline Pigging Equipment Market Revenue Share (%), by Country 2024 & 2032
- Figure 62: Asia Pacific Pipeline Pigging Equipment Market Volume Share (%), by Country 2024 & 2032
- Figure 63: South America Pipeline Pigging Equipment Market Revenue (Million), by Application 2024 & 2032
- Figure 64: South America Pipeline Pigging Equipment Market Volume (Kiloton), by Application 2024 & 2032
- Figure 65: South America Pipeline Pigging Equipment Market Revenue Share (%), by Application 2024 & 2032
- Figure 66: South America Pipeline Pigging Equipment Market Volume Share (%), by Application 2024 & 2032
- Figure 67: South America Pipeline Pigging Equipment Market Revenue (Million), by Products 2024 & 2032
- Figure 68: South America Pipeline Pigging Equipment Market Volume (Kiloton), by Products 2024 & 2032
- Figure 69: South America Pipeline Pigging Equipment Market Revenue Share (%), by Products 2024 & 2032
- Figure 70: South America Pipeline Pigging Equipment Market Volume Share (%), by Products 2024 & 2032
- Figure 71: South America Pipeline Pigging Equipment Market Revenue (Million), by Country 2024 & 2032
- Figure 72: South America Pipeline Pigging Equipment Market Volume (Kiloton), by Country 2024 & 2032
- Figure 73: South America Pipeline Pigging Equipment Market Revenue Share (%), by Country 2024 & 2032
- Figure 74: South America Pipeline Pigging Equipment Market Volume Share (%), by Country 2024 & 2032
- Figure 75: Middle East and Africa Pipeline Pigging Equipment Market Revenue (Million), by Application 2024 & 2032
- Figure 76: Middle East and Africa Pipeline Pigging Equipment Market Volume (Kiloton), by Application 2024 & 2032
- Figure 77: Middle East and Africa Pipeline Pigging Equipment Market Revenue Share (%), by Application 2024 & 2032
- Figure 78: Middle East and Africa Pipeline Pigging Equipment Market Volume Share (%), by Application 2024 & 2032
- Figure 79: Middle East and Africa Pipeline Pigging Equipment Market Revenue (Million), by Products 2024 & 2032
- Figure 80: Middle East and Africa Pipeline Pigging Equipment Market Volume (Kiloton), by Products 2024 & 2032
- Figure 81: Middle East and Africa Pipeline Pigging Equipment Market Revenue Share (%), by Products 2024 & 2032
- Figure 82: Middle East and Africa Pipeline Pigging Equipment Market Volume Share (%), by Products 2024 & 2032
- Figure 83: Middle East and Africa Pipeline Pigging Equipment Market Revenue (Million), by Country 2024 & 2032
- Figure 84: Middle East and Africa Pipeline Pigging Equipment Market Volume (Kiloton), by Country 2024 & 2032
- Figure 85: Middle East and Africa Pipeline Pigging Equipment Market Revenue Share (%), by Country 2024 & 2032
- Figure 86: Middle East and Africa Pipeline Pigging Equipment Market Volume Share (%), by Country 2024 & 2032
List of Tables
- Table 1: Global Pipeline Pigging Equipment Market Revenue Million Forecast, by Region 2019 & 2032
- Table 2: Global Pipeline Pigging Equipment Market Volume Kiloton Forecast, by Region 2019 & 2032
- Table 3: Global Pipeline Pigging Equipment Market Revenue Million Forecast, by Application 2019 & 2032
- Table 4: Global Pipeline Pigging Equipment Market Volume Kiloton Forecast, by Application 2019 & 2032
- Table 5: Global Pipeline Pigging Equipment Market Revenue Million Forecast, by Products 2019 & 2032
- Table 6: Global Pipeline Pigging Equipment Market Volume Kiloton Forecast, by Products 2019 & 2032
- Table 7: Global Pipeline Pigging Equipment Market Revenue Million Forecast, by Region 2019 & 2032
- Table 8: Global Pipeline Pigging Equipment Market Volume Kiloton Forecast, by Region 2019 & 2032
- Table 9: Global Pipeline Pigging Equipment Market Revenue Million Forecast, by Country 2019 & 2032
- Table 10: Global Pipeline Pigging Equipment Market Volume Kiloton Forecast, by Country 2019 & 2032
- Table 11: United States Pipeline Pigging Equipment Market Revenue (Million) Forecast, by Application 2019 & 2032
- Table 12: United States Pipeline Pigging Equipment Market Volume (Kiloton) Forecast, by Application 2019 & 2032
- Table 13: Canada Pipeline Pigging Equipment Market Revenue (Million) Forecast, by Application 2019 & 2032
- Table 14: Canada Pipeline Pigging Equipment Market Volume (Kiloton) Forecast, by Application 2019 & 2032
- Table 15: Mexico Pipeline Pigging Equipment Market Revenue (Million) Forecast, by Application 2019 & 2032
- Table 16: Mexico Pipeline Pigging Equipment Market Volume (Kiloton) Forecast, by Application 2019 & 2032
- Table 17: Global Pipeline Pigging Equipment Market Revenue Million Forecast, by Country 2019 & 2032
- Table 18: Global Pipeline Pigging Equipment Market Volume Kiloton Forecast, by Country 2019 & 2032
- Table 19: Germany Pipeline Pigging Equipment Market Revenue (Million) Forecast, by Application 2019 & 2032
- Table 20: Germany Pipeline Pigging Equipment Market Volume (Kiloton) Forecast, by Application 2019 & 2032
- Table 21: United Kingdom Pipeline Pigging Equipment Market Revenue (Million) Forecast, by Application 2019 & 2032
- Table 22: United Kingdom Pipeline Pigging Equipment Market Volume (Kiloton) Forecast, by Application 2019 & 2032
- Table 23: France Pipeline Pigging Equipment Market Revenue (Million) Forecast, by Application 2019 & 2032
- Table 24: France Pipeline Pigging Equipment Market Volume (Kiloton) Forecast, by Application 2019 & 2032
- Table 25: Spain Pipeline Pigging Equipment Market Revenue (Million) Forecast, by Application 2019 & 2032
- Table 26: Spain Pipeline Pigging Equipment Market Volume (Kiloton) Forecast, by Application 2019 & 2032
- Table 27: Italy Pipeline Pigging Equipment Market Revenue (Million) Forecast, by Application 2019 & 2032
- Table 28: Italy Pipeline Pigging Equipment Market Volume (Kiloton) Forecast, by Application 2019 & 2032
- Table 29: Spain Pipeline Pigging Equipment Market Revenue (Million) Forecast, by Application 2019 & 2032
- Table 30: Spain Pipeline Pigging Equipment Market Volume (Kiloton) Forecast, by Application 2019 & 2032
- Table 31: Belgium Pipeline Pigging Equipment Market Revenue (Million) Forecast, by Application 2019 & 2032
- Table 32: Belgium Pipeline Pigging Equipment Market Volume (Kiloton) Forecast, by Application 2019 & 2032
- Table 33: Netherland Pipeline Pigging Equipment Market Revenue (Million) Forecast, by Application 2019 & 2032
- Table 34: Netherland Pipeline Pigging Equipment Market Volume (Kiloton) Forecast, by Application 2019 & 2032
- Table 35: Nordics Pipeline Pigging Equipment Market Revenue (Million) Forecast, by Application 2019 & 2032
- Table 36: Nordics Pipeline Pigging Equipment Market Volume (Kiloton) Forecast, by Application 2019 & 2032
- Table 37: Rest of Europe Pipeline Pigging Equipment Market Revenue (Million) Forecast, by Application 2019 & 2032
- Table 38: Rest of Europe Pipeline Pigging Equipment Market Volume (Kiloton) Forecast, by Application 2019 & 2032
- Table 39: Global Pipeline Pigging Equipment Market Revenue Million Forecast, by Country 2019 & 2032
- Table 40: Global Pipeline Pigging Equipment Market Volume Kiloton Forecast, by Country 2019 & 2032
- Table 41: China Pipeline Pigging Equipment Market Revenue (Million) Forecast, by Application 2019 & 2032
- Table 42: China Pipeline Pigging Equipment Market Volume (Kiloton) Forecast, by Application 2019 & 2032
- Table 43: Japan Pipeline Pigging Equipment Market Revenue (Million) Forecast, by Application 2019 & 2032
- Table 44: Japan Pipeline Pigging Equipment Market Volume (Kiloton) Forecast, by Application 2019 & 2032
- Table 45: India Pipeline Pigging Equipment Market Revenue (Million) Forecast, by Application 2019 & 2032
- Table 46: India Pipeline Pigging Equipment Market Volume (Kiloton) Forecast, by Application 2019 & 2032
- Table 47: South Korea Pipeline Pigging Equipment Market Revenue (Million) Forecast, by Application 2019 & 2032
- Table 48: South Korea Pipeline Pigging Equipment Market Volume (Kiloton) Forecast, by Application 2019 & 2032
- Table 49: Southeast Asia Pipeline Pigging Equipment Market Revenue (Million) Forecast, by Application 2019 & 2032
- Table 50: Southeast Asia Pipeline Pigging Equipment Market Volume (Kiloton) Forecast, by Application 2019 & 2032
- Table 51: Australia Pipeline Pigging Equipment Market Revenue (Million) Forecast, by Application 2019 & 2032
- Table 52: Australia Pipeline Pigging Equipment Market Volume (Kiloton) Forecast, by Application 2019 & 2032
- Table 53: Indonesia Pipeline Pigging Equipment Market Revenue (Million) Forecast, by Application 2019 & 2032
- Table 54: Indonesia Pipeline Pigging Equipment Market Volume (Kiloton) Forecast, by Application 2019 & 2032
- Table 55: Phillipes Pipeline Pigging Equipment Market Revenue (Million) Forecast, by Application 2019 & 2032
- Table 56: Phillipes Pipeline Pigging Equipment Market Volume (Kiloton) Forecast, by Application 2019 & 2032
- Table 57: Singapore Pipeline Pigging Equipment Market Revenue (Million) Forecast, by Application 2019 & 2032
- Table 58: Singapore Pipeline Pigging Equipment Market Volume (Kiloton) Forecast, by Application 2019 & 2032
- Table 59: Thailandc Pipeline Pigging Equipment Market Revenue (Million) Forecast, by Application 2019 & 2032
- Table 60: Thailandc Pipeline Pigging Equipment Market Volume (Kiloton) Forecast, by Application 2019 & 2032
- Table 61: Rest of Asia Pacific Pipeline Pigging Equipment Market Revenue (Million) Forecast, by Application 2019 & 2032
- Table 62: Rest of Asia Pacific Pipeline Pigging Equipment Market Volume (Kiloton) Forecast, by Application 2019 & 2032
- Table 63: Global Pipeline Pigging Equipment Market Revenue Million Forecast, by Country 2019 & 2032
- Table 64: Global Pipeline Pigging Equipment Market Volume Kiloton Forecast, by Country 2019 & 2032
- Table 65: Brazil Pipeline Pigging Equipment Market Revenue (Million) Forecast, by Application 2019 & 2032
- Table 66: Brazil Pipeline Pigging Equipment Market Volume (Kiloton) Forecast, by Application 2019 & 2032
- Table 67: Argentina Pipeline Pigging Equipment Market Revenue (Million) Forecast, by Application 2019 & 2032
- Table 68: Argentina Pipeline Pigging Equipment Market Volume (Kiloton) Forecast, by Application 2019 & 2032
- Table 69: Peru Pipeline Pigging Equipment Market Revenue (Million) Forecast, by Application 2019 & 2032
- Table 70: Peru Pipeline Pigging Equipment Market Volume (Kiloton) Forecast, by Application 2019 & 2032
- Table 71: Chile Pipeline Pigging Equipment Market Revenue (Million) Forecast, by Application 2019 & 2032
- Table 72: Chile Pipeline Pigging Equipment Market Volume (Kiloton) Forecast, by Application 2019 & 2032
- Table 73: Colombia Pipeline Pigging Equipment Market Revenue (Million) Forecast, by Application 2019 & 2032
- Table 74: Colombia Pipeline Pigging Equipment Market Volume (Kiloton) Forecast, by Application 2019 & 2032
- Table 75: Ecuador Pipeline Pigging Equipment Market Revenue (Million) Forecast, by Application 2019 & 2032
- Table 76: Ecuador Pipeline Pigging Equipment Market Volume (Kiloton) Forecast, by Application 2019 & 2032
- Table 77: Venezuela Pipeline Pigging Equipment Market Revenue (Million) Forecast, by Application 2019 & 2032
- Table 78: Venezuela Pipeline Pigging Equipment Market Volume (Kiloton) Forecast, by Application 2019 & 2032
- Table 79: Rest of South America Pipeline Pigging Equipment Market Revenue (Million) Forecast, by Application 2019 & 2032
- Table 80: Rest of South America Pipeline Pigging Equipment Market Volume (Kiloton) Forecast, by Application 2019 & 2032
- Table 81: Global Pipeline Pigging Equipment Market Revenue Million Forecast, by Country 2019 & 2032
- Table 82: Global Pipeline Pigging Equipment Market Volume Kiloton Forecast, by Country 2019 & 2032
- Table 83: United States Pipeline Pigging Equipment Market Revenue (Million) Forecast, by Application 2019 & 2032
- Table 84: United States Pipeline Pigging Equipment Market Volume (Kiloton) Forecast, by Application 2019 & 2032
- Table 85: Canada Pipeline Pigging Equipment Market Revenue (Million) Forecast, by Application 2019 & 2032
- Table 86: Canada Pipeline Pigging Equipment Market Volume (Kiloton) Forecast, by Application 2019 & 2032
- Table 87: Mexico Pipeline Pigging Equipment Market Revenue (Million) Forecast, by Application 2019 & 2032
- Table 88: Mexico Pipeline Pigging Equipment Market Volume (Kiloton) Forecast, by Application 2019 & 2032
- Table 89: Global Pipeline Pigging Equipment Market Revenue Million Forecast, by Country 2019 & 2032
- Table 90: Global Pipeline Pigging Equipment Market Volume Kiloton Forecast, by Country 2019 & 2032
- Table 91: United Arab Emirates Pipeline Pigging Equipment Market Revenue (Million) Forecast, by Application 2019 & 2032
- Table 92: United Arab Emirates Pipeline Pigging Equipment Market Volume (Kiloton) Forecast, by Application 2019 & 2032
- Table 93: Saudi Arabia Pipeline Pigging Equipment Market Revenue (Million) Forecast, by Application 2019 & 2032
- Table 94: Saudi Arabia Pipeline Pigging Equipment Market Volume (Kiloton) Forecast, by Application 2019 & 2032
- Table 95: South Africa Pipeline Pigging Equipment Market Revenue (Million) Forecast, by Application 2019 & 2032
- Table 96: South Africa Pipeline Pigging Equipment Market Volume (Kiloton) Forecast, by Application 2019 & 2032
- Table 97: Rest of Middle East and Africa Pipeline Pigging Equipment Market Revenue (Million) Forecast, by Application 2019 & 2032
- Table 98: Rest of Middle East and Africa Pipeline Pigging Equipment Market Volume (Kiloton) Forecast, by Application 2019 & 2032
- Table 99: Global Pipeline Pigging Equipment Market Revenue Million Forecast, by Application 2019 & 2032
- Table 100: Global Pipeline Pigging Equipment Market Volume Kiloton Forecast, by Application 2019 & 2032
- Table 101: Global Pipeline Pigging Equipment Market Revenue Million Forecast, by Products 2019 & 2032
- Table 102: Global Pipeline Pigging Equipment Market Volume Kiloton Forecast, by Products 2019 & 2032
- Table 103: Global Pipeline Pigging Equipment Market Revenue Million Forecast, by Country 2019 & 2032
- Table 104: Global Pipeline Pigging Equipment Market Volume Kiloton Forecast, by Country 2019 & 2032
- Table 105: Global Pipeline Pigging Equipment Market Revenue Million Forecast, by Application 2019 & 2032
- Table 106: Global Pipeline Pigging Equipment Market Volume Kiloton Forecast, by Application 2019 & 2032
- Table 107: Global Pipeline Pigging Equipment Market Revenue Million Forecast, by Products 2019 & 2032
- Table 108: Global Pipeline Pigging Equipment Market Volume Kiloton Forecast, by Products 2019 & 2032
- Table 109: Global Pipeline Pigging Equipment Market Revenue Million Forecast, by Country 2019 & 2032
- Table 110: Global Pipeline Pigging Equipment Market Volume Kiloton Forecast, by Country 2019 & 2032
- Table 111: Global Pipeline Pigging Equipment Market Revenue Million Forecast, by Application 2019 & 2032
- Table 112: Global Pipeline Pigging Equipment Market Volume Kiloton Forecast, by Application 2019 & 2032
- Table 113: Global Pipeline Pigging Equipment Market Revenue Million Forecast, by Products 2019 & 2032
- Table 114: Global Pipeline Pigging Equipment Market Volume Kiloton Forecast, by Products 2019 & 2032
- Table 115: Global Pipeline Pigging Equipment Market Revenue Million Forecast, by Country 2019 & 2032
- Table 116: Global Pipeline Pigging Equipment Market Volume Kiloton Forecast, by Country 2019 & 2032
- Table 117: Global Pipeline Pigging Equipment Market Revenue Million Forecast, by Application 2019 & 2032
- Table 118: Global Pipeline Pigging Equipment Market Volume Kiloton Forecast, by Application 2019 & 2032
- Table 119: Global Pipeline Pigging Equipment Market Revenue Million Forecast, by Products 2019 & 2032
- Table 120: Global Pipeline Pigging Equipment Market Volume Kiloton Forecast, by Products 2019 & 2032
- Table 121: Global Pipeline Pigging Equipment Market Revenue Million Forecast, by Country 2019 & 2032
- Table 122: Global Pipeline Pigging Equipment Market Volume Kiloton Forecast, by Country 2019 & 2032
- Table 123: Global Pipeline Pigging Equipment Market Revenue Million Forecast, by Application 2019 & 2032
- Table 124: Global Pipeline Pigging Equipment Market Volume Kiloton Forecast, by Application 2019 & 2032
- Table 125: Global Pipeline Pigging Equipment Market Revenue Million Forecast, by Products 2019 & 2032
- Table 126: Global Pipeline Pigging Equipment Market Volume Kiloton Forecast, by Products 2019 & 2032
- Table 127: Global Pipeline Pigging Equipment Market Revenue Million Forecast, by Country 2019 & 2032
- Table 128: Global Pipeline Pigging Equipment Market Volume Kiloton Forecast, by Country 2019 & 2032
Frequently Asked Questions
1. What is the projected Compound Annual Growth Rate (CAGR) of the Pipeline Pigging Equipment Market?
The projected CAGR is approximately > 5.50%.
2. Which companies are prominent players in the Pipeline Pigging Equipment Market?
Key companies in the market include Pigs Unlimited International*List Not Exhaustive, Dacon Inspection Technologies Company Limited, T D Williamson Inc, LIN SCAN Advanced Pipelines & Tanks Services, NDT Global FZE, Xylem Inc, 3P Services GmbH & Co KG, Russell NDE Systems, Baker Hughes a GE Co.
3. What are the main segments of the Pipeline Pigging Equipment Market?
The market segments include Application, Products.
4. Can you provide details about the market size?
The market size is estimated to be USD XX Million as of 2022.
5. What are some drivers contributing to market growth?
4.; The Rise in Oil and Gas Drilling Activities4.; Increased Shale Gas Exploration.
6. What are the notable trends driving market growth?
Gas Pipeline Pigging System to Dominate the Market.
7. Are there any restraints impacting market growth?
4.; Increasing Share of Renewable Energy.
8. Can you provide examples of recent developments in the market?
N/A
9. What pricing options are available for accessing the report?
Pricing options include single-user, multi-user, and enterprise licenses priced at USD 4750, USD 5250, and USD 8750 respectively.
10. Is the market size provided in terms of value or volume?
The market size is provided in terms of value, measured in Million and volume, measured in Kiloton.
11. Are there any specific market keywords associated with the report?
Yes, the market keyword associated with the report is "Pipeline Pigging Equipment Market," which aids in identifying and referencing the specific market segment covered.
12. How do I determine which pricing option suits my needs best?
The pricing options vary based on user requirements and access needs. Individual users may opt for single-user licenses, while businesses requiring broader access may choose multi-user or enterprise licenses for cost-effective access to the report.
13. Are there any additional resources or data provided in the Pipeline Pigging Equipment Market report?
While the report offers comprehensive insights, it's advisable to review the specific contents or supplementary materials provided to ascertain if additional resources or data are available.
14. How can I stay updated on further developments or reports in the Pipeline Pigging Equipment Market?
To stay informed about further developments, trends, and reports in the Pipeline Pigging Equipment Market, consider subscribing to industry newsletters, following relevant companies and organizations, or regularly checking reputable industry news sources and publications.
Methodology
Step 1 - Identification of Relevant Samples Size from Population Database


Step 2 - Approaches for Defining Global Market Size (Value, Volume* & Price*)

Note*: In applicable scenarios
Step 3 - Data Sources
Primary Research
- Web Analytics
- Survey Reports
- Research Institute
- Latest Research Reports
- Opinion Leaders
Secondary Research
- Annual Reports
- White Paper
- Latest Press Release
- Industry Association
- Paid Database
- Investor Presentations

Step 4 - Data Triangulation
Involves using different sources of information in order to increase the validity of a study
These sources are likely to be stakeholders in a program - participants, other researchers, program staff, other community members, and so on.
Then we put all data in single framework & apply various statistical tools to find out the dynamic on the market.
During the analysis stage, feedback from the stakeholder groups would be compared to determine areas of agreement as well as areas of divergence


