
Key Insights
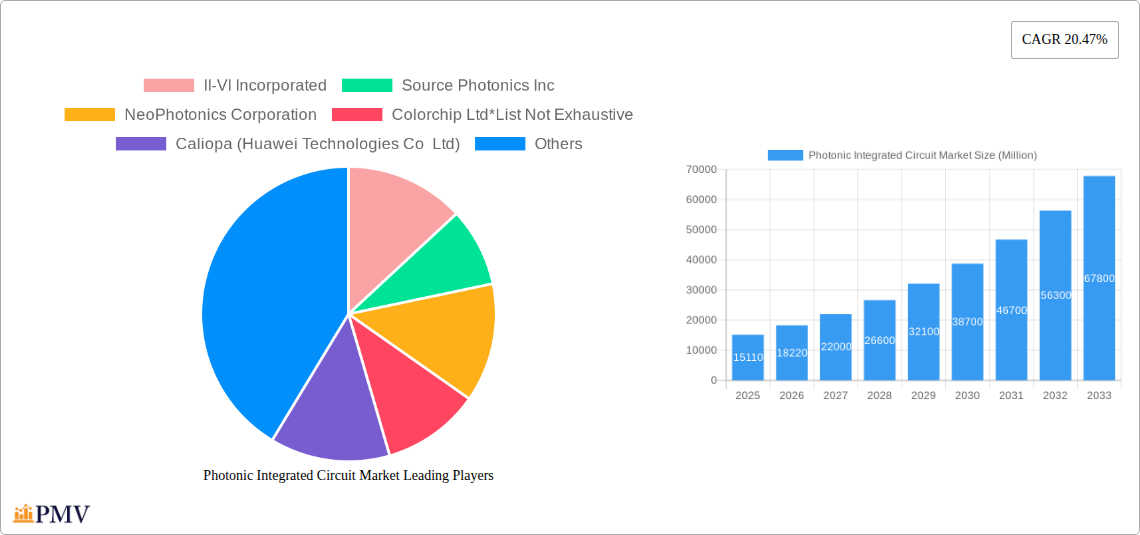
The Photonic Integrated Circuit (PIC) market is experiencing robust growth, projected to reach \$15.11 billion in 2025 and expand at a Compound Annual Growth Rate (CAGR) of 20.47% from 2025 to 2033. This expansion is driven by the increasing demand for high-bandwidth, low-latency communication in data centers and telecommunications. The miniaturization and integration capabilities of PICs offer significant advantages over traditional discrete optical components, leading to cost reductions and improved performance. Furthermore, the burgeoning adoption of PICs in biomedical applications, such as optical coherence tomography (OCT) and flow cytometry, fuels market growth. Technological advancements in III-V materials, lithium niobate, and silica-on-silicon platforms are further enabling the development of more efficient and versatile PICs. The market is segmented by raw material type (III-V materials leading the way due to their superior performance characteristics), integration process (hybrid and monolithic approaches both finding applications), and application (telecommunications currently dominating but with significant growth anticipated in data centers and biomedical sectors). Competition is intense, with major players like II-VI Incorporated, Lumentum Holdings, and Intel Corporation investing heavily in research and development to maintain market leadership. The shift towards cloud computing and the growth of 5G and beyond 5G networks are key factors bolstering demand in the coming years.
Despite the optimistic outlook, challenges remain. The high cost of manufacturing advanced PICs, especially those using III-V materials, and the complexity of integrating various components are potential restraints. However, ongoing innovations in manufacturing processes and the emergence of new materials are expected to mitigate these challenges. The geographical distribution is likely skewed towards North America and Asia Pacific, given the concentration of major technology companies and research institutions in these regions, though European markets are showing consistent growth. The forecast period (2025-2033) anticipates significant expansion driven by ongoing technological improvements, expanding applications, and increasing infrastructure investments globally. The market is poised for continued strong growth, driven by the relentless demand for faster, more efficient data transmission and processing capabilities.
Photonic Integrated Circuit Market: A Comprehensive Report (2019-2033)
This in-depth report provides a comprehensive analysis of the Photonic Integrated Circuit (PIC) market, offering valuable insights into market dynamics, growth drivers, competitive landscapes, and future trends. The study period covers 2019-2033, with 2025 as the base and estimated year. The report leverages extensive primary and secondary research to deliver actionable intelligence for businesses operating in or seeking to enter this rapidly evolving sector. The market is projected to reach xx Million by 2033, exhibiting a CAGR of xx% during the forecast period (2025-2033).
Photonic Integrated Circuit Market Market Structure & Competitive Dynamics
The Photonic Integrated Circuit market is characterized by a moderately concentrated landscape with a few dominant players and several emerging companies. Market share is largely determined by technological innovation, manufacturing capabilities, and established customer relationships. The market exhibits strong innovation ecosystems driven by academic research, government funding, and industry collaborations. Regulatory frameworks, particularly regarding standards and interoperability, influence market development. Product substitutes, such as traditional optical components, face increasing competition from the cost-effectiveness and performance advantages of PICs. End-user trends, particularly in data centers and telecommunications, are pivotal to market growth. M&A activity has been significant, with deal values ranging from xx Million to xx Million in recent years, reflecting strategic consolidation and the acquisition of specialized technologies. Key metrics include:
- Market Concentration: Moderately concentrated, with the top 5 players holding approximately xx% of the market share.
- Innovation Ecosystem: Strong collaboration between research institutions, startups, and established players.
- Regulatory Landscape: Standards development and interoperability remain crucial considerations.
- M&A Activity: Significant activity with a total deal value exceeding xx Million in the last five years.
Photonic Integrated Circuit Market Industry Trends & Insights
The Photonic Integrated Circuit market is experiencing robust growth, fueled by several key factors. The increasing demand for high-bandwidth, low-latency communication networks in data centers and telecommunications is a major driver. The continuous advancements in silicon photonics and other integration technologies are further propelling market expansion. Consumer preferences for faster data speeds and improved connectivity are also contributing to the growth. Competitive dynamics are intense, with companies focusing on product differentiation, cost reduction, and strategic partnerships to gain a market edge. The market is witnessing significant technological disruptions, including the integration of artificial intelligence and machine learning into PIC design and manufacturing. This is leading to improved performance, reduced energy consumption, and enhanced functionality. The market penetration of PICs in various applications, such as biomedical imaging and sensing, is continuously increasing. The adoption of PICs is also expected to increase in optical sensors for LiDAR, which are used in autonomous driving and robotics. The predicted CAGR of xx% reflects this robust growth.

Dominant Markets & Segments in Photonic Integrated Circuit Market
The Telecommunications segment currently dominates the Photonic Integrated Circuit market, driven by the massive deployment of 5G and beyond networks. Data centers represent another rapidly growing segment, fueled by the increasing demand for cloud computing and high-performance computing. Geographically, North America and Asia Pacific are leading regions, boosted by strong technological advancements and high infrastructure investments.
By Type of Raw Material:
- III-V Material: Dominates due to its superior optical properties, although cost is a limitation. Key drivers include advancements in materials science and manufacturing processes.
- Silica-on-silicon: Growing rapidly due to cost-effectiveness and compatibility with CMOS technology. Key drivers include the maturation of manufacturing techniques and increased industry investments in R&D.
- Lithium Niobate: Maintains a niche presence, valuable for specific applications demanding high performance. Key drivers include its excellent electro-optical properties.
- Other Raw Materials: Represent a smaller segment, incorporating emerging materials for specific applications.
By Integration Process:
- Monolithic: Offers higher performance and integration density. Key drivers include progress in lithography and material science.
- Hybrid: Offers cost-effective solutions for simpler designs. Key drivers include established manufacturing processes.
By Application:
- Telecommunications: Dominant segment due to high bandwidth demands of 5G and future communication standards. Key drivers include expanding network infrastructure and increasing data traffic.
- Data Centers: Rapid growth due to increasing demand for high-speed interconnects. Key drivers include cloud computing, AI, and high-performance computing.
- Biomedical: Emerging segment with significant potential for applications in medical imaging and diagnostics. Key drivers include advancements in medical technologies and increasing healthcare investments.
- Other Applications: Includes optical sensors (LiDAR) and metrology, driven by the demand for advanced sensing solutions in various industries.
Photonic Integrated Circuit Market Product Innovations
Recent product developments focus on higher integration densities, improved performance, and lower power consumption. The market trend leans towards the development of cost-effective silicon-based PICs for broader adoption. Innovations in packaging technologies enable seamless integration into various systems. Companies are actively exploring new materials and manufacturing processes to enhance performance and reduce costs. These innovations ensure PICs remain competitive in the rapidly evolving optical communication and sensing landscape.
Report Segmentation & Scope
This report segments the Photonic Integrated Circuit market by type of raw material (III-V Material, Lithium Niobate, Silica-on-silicon, Other Raw Materials), integration process (Hybrid, Monolithic), and application (Telecommunications, Biomedical, Data Centers, Other Applications). Each segment is analyzed with respect to market size, growth rate, and competitive dynamics. Growth projections are provided for each segment over the forecast period (2025-2033).
Key Drivers of Photonic Integrated Circuit Market Growth
Several factors contribute to the robust growth of the Photonic Integrated Circuit market:
- Expanding Telecommunications Infrastructure: The growing demand for high-speed data transmission fuels the need for advanced photonic solutions.
- Data Center Growth: The surge in cloud computing and big data analytics drives the adoption of PICs for high-bandwidth interconnects.
- Advancements in Silicon Photonics: The progress in silicon photonics manufacturing reduces the cost and complexity of PICs, driving wider adoption.
- Increasing Government Investments: Government funding and initiatives promote research and development in photonic technologies.
Challenges in the Photonic Integrated Circuit Market Sector
Despite robust growth, the Photonic Integrated Circuit market faces challenges:
- High Manufacturing Costs: The production of PICs can be expensive, limiting their widespread adoption in some applications.
- Supply Chain Disruptions: Global supply chain issues impact the availability of raw materials and components, hindering production.
- Competition from Traditional Optical Components: PICs compete with established optical components, which could pose a challenge for market penetration.
Leading Players in the Photonic Integrated Circuit Market Market
- II-VI Incorporated
- Source Photonics Inc
- NeoPhotonics Corporation
- Colorchip Ltd
- Caliopa (Huawei Technologies Co Ltd)
- Cisco Systems Inc
- Infinera Corporation
- Lumentum Holdings
- Effect Photonics
- Intel Corporation
- POET Technologies
Key Developments in Photonic Integrated Circuit Market Sector
- May 2023: ANELLO Photonics partnered with NVIDIA Inception to develop advanced optical sensors using its patented photonic gyroscope integrated circuit technology. This collaboration enhances the company's position in the emerging sensor market.
- August 2022: DustPhotonics partnered with MaxLinear to showcase high-performance silicon photonics chipsets with integrated lasers, eliminating the need for external driver chips. This development signifies progress in simplifying PIC system integration.
- March 2022: Source Photonics announced the sampling of its Silicon-Photonics 400G DR4 QSFP56-DD products, exceeding IEEE standards for 400GBASE-DR4 optical interfaces. This product launch demonstrates advancements in high-speed optical communication technology.
Strategic Photonic Integrated Circuit Market Market Outlook
The Photonic Integrated Circuit market is poised for significant growth, driven by continued advancements in technology, increasing demand from key sectors, and substantial investments in research and development. Strategic opportunities exist for companies focusing on cost reduction, enhanced integration, and the development of new applications. The market's future trajectory is positive, with expanding applications in various sectors promising a sustained period of expansion.
Photonic Integrated Circuit Market Segmentation
-
1. Type of Raw Material
- 1.1. III-V Material
- 1.2. Lithium Niobate
- 1.3. Silica-on-silicon
- 1.4. Other Raw Materials
-
2. Integration Process
- 2.1. Hybrid
- 2.2. Monolithic
-
3. Application
- 3.1. Telecommunications
- 3.2. Biomedical
- 3.3. Data Centers
- 3.4. Other Ap
Photonic Integrated Circuit Market Segmentation By Geography
- 1. North America
- 2. Europe
- 3. Asia
- 4. Australia and New Zealand
- 5. Latin America
- 6. Middle East and Africa

Photonic Integrated Circuit Market REPORT HIGHLIGHTS
| Aspects | Details |
|---|---|
| Study Period | 2019-2033 |
| Base Year | 2024 |
| Estimated Year | 2025 |
| Forecast Period | 2025-2033 |
| Historical Period | 2019-2024 |
| Growth Rate | CAGR of 20.47% from 2019-2033 |
| Segmentation |
|
Table of Contents
- 1. Introduction
- 1.1. Research Scope
- 1.2. Market Segmentation
- 1.3. Research Methodology
- 1.4. Definitions and Assumptions
- 2. Executive Summary
- 2.1. Introduction
- 3. Market Dynamics
- 3.1. Introduction
- 3.2. Market Drivers
- 3.2.1. Growing Applications in Telecommunications and Data Centers; Investments and Research to Miniaturize the PICs
- 3.3. Market Restrains
- 3.3.1. Complexity in System Design and Function
- 3.4. Market Trends
- 3.4.1. Growing Applications in Telecommunications and Data Centers to Drive the Market
- 4. Market Factor Analysis
- 4.1. Porters Five Forces
- 4.2. Supply/Value Chain
- 4.3. PESTEL analysis
- 4.4. Market Entropy
- 4.5. Patent/Trademark Analysis
- 5. Global Photonic Integrated Circuit Market Analysis, Insights and Forecast, 2019-2031
- 5.1. Market Analysis, Insights and Forecast - by Type of Raw Material
- 5.1.1. III-V Material
- 5.1.2. Lithium Niobate
- 5.1.3. Silica-on-silicon
- 5.1.4. Other Raw Materials
- 5.2. Market Analysis, Insights and Forecast - by Integration Process
- 5.2.1. Hybrid
- 5.2.2. Monolithic
- 5.3. Market Analysis, Insights and Forecast - by Application
- 5.3.1. Telecommunications
- 5.3.2. Biomedical
- 5.3.3. Data Centers
- 5.3.4. Other Ap
- 5.4. Market Analysis, Insights and Forecast - by Region
- 5.4.1. North America
- 5.4.2. Europe
- 5.4.3. Asia
- 5.4.4. Australia and New Zealand
- 5.4.5. Latin America
- 5.4.6. Middle East and Africa
- 5.1. Market Analysis, Insights and Forecast - by Type of Raw Material
- 6. North America Photonic Integrated Circuit Market Analysis, Insights and Forecast, 2019-2031
- 6.1. Market Analysis, Insights and Forecast - by Type of Raw Material
- 6.1.1. III-V Material
- 6.1.2. Lithium Niobate
- 6.1.3. Silica-on-silicon
- 6.1.4. Other Raw Materials
- 6.2. Market Analysis, Insights and Forecast - by Integration Process
- 6.2.1. Hybrid
- 6.2.2. Monolithic
- 6.3. Market Analysis, Insights and Forecast - by Application
- 6.3.1. Telecommunications
- 6.3.2. Biomedical
- 6.3.3. Data Centers
- 6.3.4. Other Ap
- 6.1. Market Analysis, Insights and Forecast - by Type of Raw Material
- 7. Europe Photonic Integrated Circuit Market Analysis, Insights and Forecast, 2019-2031
- 7.1. Market Analysis, Insights and Forecast - by Type of Raw Material
- 7.1.1. III-V Material
- 7.1.2. Lithium Niobate
- 7.1.3. Silica-on-silicon
- 7.1.4. Other Raw Materials
- 7.2. Market Analysis, Insights and Forecast - by Integration Process
- 7.2.1. Hybrid
- 7.2.2. Monolithic
- 7.3. Market Analysis, Insights and Forecast - by Application
- 7.3.1. Telecommunications
- 7.3.2. Biomedical
- 7.3.3. Data Centers
- 7.3.4. Other Ap
- 7.1. Market Analysis, Insights and Forecast - by Type of Raw Material
- 8. Asia Photonic Integrated Circuit Market Analysis, Insights and Forecast, 2019-2031
- 8.1. Market Analysis, Insights and Forecast - by Type of Raw Material
- 8.1.1. III-V Material
- 8.1.2. Lithium Niobate
- 8.1.3. Silica-on-silicon
- 8.1.4. Other Raw Materials
- 8.2. Market Analysis, Insights and Forecast - by Integration Process
- 8.2.1. Hybrid
- 8.2.2. Monolithic
- 8.3. Market Analysis, Insights and Forecast - by Application
- 8.3.1. Telecommunications
- 8.3.2. Biomedical
- 8.3.3. Data Centers
- 8.3.4. Other Ap
- 8.1. Market Analysis, Insights and Forecast - by Type of Raw Material
- 9. Australia and New Zealand Photonic Integrated Circuit Market Analysis, Insights and Forecast, 2019-2031
- 9.1. Market Analysis, Insights and Forecast - by Type of Raw Material
- 9.1.1. III-V Material
- 9.1.2. Lithium Niobate
- 9.1.3. Silica-on-silicon
- 9.1.4. Other Raw Materials
- 9.2. Market Analysis, Insights and Forecast - by Integration Process
- 9.2.1. Hybrid
- 9.2.2. Monolithic
- 9.3. Market Analysis, Insights and Forecast - by Application
- 9.3.1. Telecommunications
- 9.3.2. Biomedical
- 9.3.3. Data Centers
- 9.3.4. Other Ap
- 9.1. Market Analysis, Insights and Forecast - by Type of Raw Material
- 10. Latin America Photonic Integrated Circuit Market Analysis, Insights and Forecast, 2019-2031
- 10.1. Market Analysis, Insights and Forecast - by Type of Raw Material
- 10.1.1. III-V Material
- 10.1.2. Lithium Niobate
- 10.1.3. Silica-on-silicon
- 10.1.4. Other Raw Materials
- 10.2. Market Analysis, Insights and Forecast - by Integration Process
- 10.2.1. Hybrid
- 10.2.2. Monolithic
- 10.3. Market Analysis, Insights and Forecast - by Application
- 10.3.1. Telecommunications
- 10.3.2. Biomedical
- 10.3.3. Data Centers
- 10.3.4. Other Ap
- 10.1. Market Analysis, Insights and Forecast - by Type of Raw Material
- 11. Middle East and Africa Photonic Integrated Circuit Market Analysis, Insights and Forecast, 2019-2031
- 11.1. Market Analysis, Insights and Forecast - by Type of Raw Material
- 11.1.1. III-V Material
- 11.1.2. Lithium Niobate
- 11.1.3. Silica-on-silicon
- 11.1.4. Other Raw Materials
- 11.2. Market Analysis, Insights and Forecast - by Integration Process
- 11.2.1. Hybrid
- 11.2.2. Monolithic
- 11.3. Market Analysis, Insights and Forecast - by Application
- 11.3.1. Telecommunications
- 11.3.2. Biomedical
- 11.3.3. Data Centers
- 11.3.4. Other Ap
- 11.1. Market Analysis, Insights and Forecast - by Type of Raw Material
- 12. North America Photonic Integrated Circuit Market Analysis, Insights and Forecast, 2019-2031
- 12.1. Market Analysis, Insights and Forecast - By Country/Sub-region
- 12.1.1.
- 13. Europe Photonic Integrated Circuit Market Analysis, Insights and Forecast, 2019-2031
- 13.1. Market Analysis, Insights and Forecast - By Country/Sub-region
- 13.1.1.
- 14. Asia Pacific Photonic Integrated Circuit Market Analysis, Insights and Forecast, 2019-2031
- 14.1. Market Analysis, Insights and Forecast - By Country/Sub-region
- 14.1.1.
- 15. Rest of the World Photonic Integrated Circuit Market Analysis, Insights and Forecast, 2019-2031
- 15.1. Market Analysis, Insights and Forecast - By Country/Sub-region
- 15.1.1.
- 16. Competitive Analysis
- 16.1. Global Market Share Analysis 2024
- 16.2. Company Profiles
- 16.2.1 II-VI Incorporated
- 16.2.1.1. Overview
- 16.2.1.2. Products
- 16.2.1.3. SWOT Analysis
- 16.2.1.4. Recent Developments
- 16.2.1.5. Financials (Based on Availability)
- 16.2.2 Source Photonics Inc
- 16.2.2.1. Overview
- 16.2.2.2. Products
- 16.2.2.3. SWOT Analysis
- 16.2.2.4. Recent Developments
- 16.2.2.5. Financials (Based on Availability)
- 16.2.3 NeoPhotonics Corporation
- 16.2.3.1. Overview
- 16.2.3.2. Products
- 16.2.3.3. SWOT Analysis
- 16.2.3.4. Recent Developments
- 16.2.3.5. Financials (Based on Availability)
- 16.2.4 Colorchip Ltd*List Not Exhaustive
- 16.2.4.1. Overview
- 16.2.4.2. Products
- 16.2.4.3. SWOT Analysis
- 16.2.4.4. Recent Developments
- 16.2.4.5. Financials (Based on Availability)
- 16.2.5 Caliopa (Huawei Technologies Co Ltd)
- 16.2.5.1. Overview
- 16.2.5.2. Products
- 16.2.5.3. SWOT Analysis
- 16.2.5.4. Recent Developments
- 16.2.5.5. Financials (Based on Availability)
- 16.2.6 Cisco Systems Inc
- 16.2.6.1. Overview
- 16.2.6.2. Products
- 16.2.6.3. SWOT Analysis
- 16.2.6.4. Recent Developments
- 16.2.6.5. Financials (Based on Availability)
- 16.2.7 Infinera Corporation
- 16.2.7.1. Overview
- 16.2.7.2. Products
- 16.2.7.3. SWOT Analysis
- 16.2.7.4. Recent Developments
- 16.2.7.5. Financials (Based on Availability)
- 16.2.8 Lumentum Holdings
- 16.2.8.1. Overview
- 16.2.8.2. Products
- 16.2.8.3. SWOT Analysis
- 16.2.8.4. Recent Developments
- 16.2.8.5. Financials (Based on Availability)
- 16.2.9 Effect Photonics
- 16.2.9.1. Overview
- 16.2.9.2. Products
- 16.2.9.3. SWOT Analysis
- 16.2.9.4. Recent Developments
- 16.2.9.5. Financials (Based on Availability)
- 16.2.10 Intel Corporation
- 16.2.10.1. Overview
- 16.2.10.2. Products
- 16.2.10.3. SWOT Analysis
- 16.2.10.4. Recent Developments
- 16.2.10.5. Financials (Based on Availability)
- 16.2.11 POET Technologies
- 16.2.11.1. Overview
- 16.2.11.2. Products
- 16.2.11.3. SWOT Analysis
- 16.2.11.4. Recent Developments
- 16.2.11.5. Financials (Based on Availability)
- 16.2.1 II-VI Incorporated
List of Figures
- Figure 1: Global Photonic Integrated Circuit Market Revenue Breakdown (Million, %) by Region 2024 & 2032
- Figure 2: North America Photonic Integrated Circuit Market Revenue (Million), by Country 2024 & 2032
- Figure 3: North America Photonic Integrated Circuit Market Revenue Share (%), by Country 2024 & 2032
- Figure 4: Europe Photonic Integrated Circuit Market Revenue (Million), by Country 2024 & 2032
- Figure 5: Europe Photonic Integrated Circuit Market Revenue Share (%), by Country 2024 & 2032
- Figure 6: Asia Pacific Photonic Integrated Circuit Market Revenue (Million), by Country 2024 & 2032
- Figure 7: Asia Pacific Photonic Integrated Circuit Market Revenue Share (%), by Country 2024 & 2032
- Figure 8: Rest of the World Photonic Integrated Circuit Market Revenue (Million), by Country 2024 & 2032
- Figure 9: Rest of the World Photonic Integrated Circuit Market Revenue Share (%), by Country 2024 & 2032
- Figure 10: North America Photonic Integrated Circuit Market Revenue (Million), by Type of Raw Material 2024 & 2032
- Figure 11: North America Photonic Integrated Circuit Market Revenue Share (%), by Type of Raw Material 2024 & 2032
- Figure 12: North America Photonic Integrated Circuit Market Revenue (Million), by Integration Process 2024 & 2032
- Figure 13: North America Photonic Integrated Circuit Market Revenue Share (%), by Integration Process 2024 & 2032
- Figure 14: North America Photonic Integrated Circuit Market Revenue (Million), by Application 2024 & 2032
- Figure 15: North America Photonic Integrated Circuit Market Revenue Share (%), by Application 2024 & 2032
- Figure 16: North America Photonic Integrated Circuit Market Revenue (Million), by Country 2024 & 2032
- Figure 17: North America Photonic Integrated Circuit Market Revenue Share (%), by Country 2024 & 2032
- Figure 18: Europe Photonic Integrated Circuit Market Revenue (Million), by Type of Raw Material 2024 & 2032
- Figure 19: Europe Photonic Integrated Circuit Market Revenue Share (%), by Type of Raw Material 2024 & 2032
- Figure 20: Europe Photonic Integrated Circuit Market Revenue (Million), by Integration Process 2024 & 2032
- Figure 21: Europe Photonic Integrated Circuit Market Revenue Share (%), by Integration Process 2024 & 2032
- Figure 22: Europe Photonic Integrated Circuit Market Revenue (Million), by Application 2024 & 2032
- Figure 23: Europe Photonic Integrated Circuit Market Revenue Share (%), by Application 2024 & 2032
- Figure 24: Europe Photonic Integrated Circuit Market Revenue (Million), by Country 2024 & 2032
- Figure 25: Europe Photonic Integrated Circuit Market Revenue Share (%), by Country 2024 & 2032
- Figure 26: Asia Photonic Integrated Circuit Market Revenue (Million), by Type of Raw Material 2024 & 2032
- Figure 27: Asia Photonic Integrated Circuit Market Revenue Share (%), by Type of Raw Material 2024 & 2032
- Figure 28: Asia Photonic Integrated Circuit Market Revenue (Million), by Integration Process 2024 & 2032
- Figure 29: Asia Photonic Integrated Circuit Market Revenue Share (%), by Integration Process 2024 & 2032
- Figure 30: Asia Photonic Integrated Circuit Market Revenue (Million), by Application 2024 & 2032
- Figure 31: Asia Photonic Integrated Circuit Market Revenue Share (%), by Application 2024 & 2032
- Figure 32: Asia Photonic Integrated Circuit Market Revenue (Million), by Country 2024 & 2032
- Figure 33: Asia Photonic Integrated Circuit Market Revenue Share (%), by Country 2024 & 2032
- Figure 34: Australia and New Zealand Photonic Integrated Circuit Market Revenue (Million), by Type of Raw Material 2024 & 2032
- Figure 35: Australia and New Zealand Photonic Integrated Circuit Market Revenue Share (%), by Type of Raw Material 2024 & 2032
- Figure 36: Australia and New Zealand Photonic Integrated Circuit Market Revenue (Million), by Integration Process 2024 & 2032
- Figure 37: Australia and New Zealand Photonic Integrated Circuit Market Revenue Share (%), by Integration Process 2024 & 2032
- Figure 38: Australia and New Zealand Photonic Integrated Circuit Market Revenue (Million), by Application 2024 & 2032
- Figure 39: Australia and New Zealand Photonic Integrated Circuit Market Revenue Share (%), by Application 2024 & 2032
- Figure 40: Australia and New Zealand Photonic Integrated Circuit Market Revenue (Million), by Country 2024 & 2032
- Figure 41: Australia and New Zealand Photonic Integrated Circuit Market Revenue Share (%), by Country 2024 & 2032
- Figure 42: Latin America Photonic Integrated Circuit Market Revenue (Million), by Type of Raw Material 2024 & 2032
- Figure 43: Latin America Photonic Integrated Circuit Market Revenue Share (%), by Type of Raw Material 2024 & 2032
- Figure 44: Latin America Photonic Integrated Circuit Market Revenue (Million), by Integration Process 2024 & 2032
- Figure 45: Latin America Photonic Integrated Circuit Market Revenue Share (%), by Integration Process 2024 & 2032
- Figure 46: Latin America Photonic Integrated Circuit Market Revenue (Million), by Application 2024 & 2032
- Figure 47: Latin America Photonic Integrated Circuit Market Revenue Share (%), by Application 2024 & 2032
- Figure 48: Latin America Photonic Integrated Circuit Market Revenue (Million), by Country 2024 & 2032
- Figure 49: Latin America Photonic Integrated Circuit Market Revenue Share (%), by Country 2024 & 2032
- Figure 50: Middle East and Africa Photonic Integrated Circuit Market Revenue (Million), by Type of Raw Material 2024 & 2032
- Figure 51: Middle East and Africa Photonic Integrated Circuit Market Revenue Share (%), by Type of Raw Material 2024 & 2032
- Figure 52: Middle East and Africa Photonic Integrated Circuit Market Revenue (Million), by Integration Process 2024 & 2032
- Figure 53: Middle East and Africa Photonic Integrated Circuit Market Revenue Share (%), by Integration Process 2024 & 2032
- Figure 54: Middle East and Africa Photonic Integrated Circuit Market Revenue (Million), by Application 2024 & 2032
- Figure 55: Middle East and Africa Photonic Integrated Circuit Market Revenue Share (%), by Application 2024 & 2032
- Figure 56: Middle East and Africa Photonic Integrated Circuit Market Revenue (Million), by Country 2024 & 2032
- Figure 57: Middle East and Africa Photonic Integrated Circuit Market Revenue Share (%), by Country 2024 & 2032
List of Tables
- Table 1: Global Photonic Integrated Circuit Market Revenue Million Forecast, by Region 2019 & 2032
- Table 2: Global Photonic Integrated Circuit Market Revenue Million Forecast, by Type of Raw Material 2019 & 2032
- Table 3: Global Photonic Integrated Circuit Market Revenue Million Forecast, by Integration Process 2019 & 2032
- Table 4: Global Photonic Integrated Circuit Market Revenue Million Forecast, by Application 2019 & 2032
- Table 5: Global Photonic Integrated Circuit Market Revenue Million Forecast, by Region 2019 & 2032
- Table 6: Global Photonic Integrated Circuit Market Revenue Million Forecast, by Country 2019 & 2032
- Table 7: Photonic Integrated Circuit Market Revenue (Million) Forecast, by Application 2019 & 2032
- Table 8: Global Photonic Integrated Circuit Market Revenue Million Forecast, by Country 2019 & 2032
- Table 9: Photonic Integrated Circuit Market Revenue (Million) Forecast, by Application 2019 & 2032
- Table 10: Global Photonic Integrated Circuit Market Revenue Million Forecast, by Country 2019 & 2032
- Table 11: Photonic Integrated Circuit Market Revenue (Million) Forecast, by Application 2019 & 2032
- Table 12: Global Photonic Integrated Circuit Market Revenue Million Forecast, by Country 2019 & 2032
- Table 13: Photonic Integrated Circuit Market Revenue (Million) Forecast, by Application 2019 & 2032
- Table 14: Global Photonic Integrated Circuit Market Revenue Million Forecast, by Type of Raw Material 2019 & 2032
- Table 15: Global Photonic Integrated Circuit Market Revenue Million Forecast, by Integration Process 2019 & 2032
- Table 16: Global Photonic Integrated Circuit Market Revenue Million Forecast, by Application 2019 & 2032
- Table 17: Global Photonic Integrated Circuit Market Revenue Million Forecast, by Country 2019 & 2032
- Table 18: Global Photonic Integrated Circuit Market Revenue Million Forecast, by Type of Raw Material 2019 & 2032
- Table 19: Global Photonic Integrated Circuit Market Revenue Million Forecast, by Integration Process 2019 & 2032
- Table 20: Global Photonic Integrated Circuit Market Revenue Million Forecast, by Application 2019 & 2032
- Table 21: Global Photonic Integrated Circuit Market Revenue Million Forecast, by Country 2019 & 2032
- Table 22: Global Photonic Integrated Circuit Market Revenue Million Forecast, by Type of Raw Material 2019 & 2032
- Table 23: Global Photonic Integrated Circuit Market Revenue Million Forecast, by Integration Process 2019 & 2032
- Table 24: Global Photonic Integrated Circuit Market Revenue Million Forecast, by Application 2019 & 2032
- Table 25: Global Photonic Integrated Circuit Market Revenue Million Forecast, by Country 2019 & 2032
- Table 26: Global Photonic Integrated Circuit Market Revenue Million Forecast, by Type of Raw Material 2019 & 2032
- Table 27: Global Photonic Integrated Circuit Market Revenue Million Forecast, by Integration Process 2019 & 2032
- Table 28: Global Photonic Integrated Circuit Market Revenue Million Forecast, by Application 2019 & 2032
- Table 29: Global Photonic Integrated Circuit Market Revenue Million Forecast, by Country 2019 & 2032
- Table 30: Global Photonic Integrated Circuit Market Revenue Million Forecast, by Type of Raw Material 2019 & 2032
- Table 31: Global Photonic Integrated Circuit Market Revenue Million Forecast, by Integration Process 2019 & 2032
- Table 32: Global Photonic Integrated Circuit Market Revenue Million Forecast, by Application 2019 & 2032
- Table 33: Global Photonic Integrated Circuit Market Revenue Million Forecast, by Country 2019 & 2032
- Table 34: Global Photonic Integrated Circuit Market Revenue Million Forecast, by Type of Raw Material 2019 & 2032
- Table 35: Global Photonic Integrated Circuit Market Revenue Million Forecast, by Integration Process 2019 & 2032
- Table 36: Global Photonic Integrated Circuit Market Revenue Million Forecast, by Application 2019 & 2032
- Table 37: Global Photonic Integrated Circuit Market Revenue Million Forecast, by Country 2019 & 2032
Frequently Asked Questions
1. What is the projected Compound Annual Growth Rate (CAGR) of the Photonic Integrated Circuit Market?
The projected CAGR is approximately 20.47%.
2. Which companies are prominent players in the Photonic Integrated Circuit Market?
Key companies in the market include II-VI Incorporated, Source Photonics Inc, NeoPhotonics Corporation, Colorchip Ltd*List Not Exhaustive, Caliopa (Huawei Technologies Co Ltd), Cisco Systems Inc, Infinera Corporation, Lumentum Holdings, Effect Photonics, Intel Corporation, POET Technologies.
3. What are the main segments of the Photonic Integrated Circuit Market?
The market segments include Type of Raw Material, Integration Process, Application.
4. Can you provide details about the market size?
The market size is estimated to be USD 15.11 Million as of 2022.
5. What are some drivers contributing to market growth?
Growing Applications in Telecommunications and Data Centers; Investments and Research to Miniaturize the PICs.
6. What are the notable trends driving market growth?
Growing Applications in Telecommunications and Data Centers to Drive the Market.
7. Are there any restraints impacting market growth?
Complexity in System Design and Function.
8. Can you provide examples of recent developments in the market?
May 2023: ANELLO Photonics announced a partnership with NVIDIA Inception to nurture start-ups that radically change industries with advances in technology. In order to produce low noise and low drift optical sensors, the company uses ANELLO's patented photonic gyroscope integrated circuit technology.
9. What pricing options are available for accessing the report?
Pricing options include single-user, multi-user, and enterprise licenses priced at USD 4750, USD 5250, and USD 8750 respectively.
10. Is the market size provided in terms of value or volume?
The market size is provided in terms of value, measured in Million.
11. Are there any specific market keywords associated with the report?
Yes, the market keyword associated with the report is "Photonic Integrated Circuit Market," which aids in identifying and referencing the specific market segment covered.
12. How do I determine which pricing option suits my needs best?
The pricing options vary based on user requirements and access needs. Individual users may opt for single-user licenses, while businesses requiring broader access may choose multi-user or enterprise licenses for cost-effective access to the report.
13. Are there any additional resources or data provided in the Photonic Integrated Circuit Market report?
While the report offers comprehensive insights, it's advisable to review the specific contents or supplementary materials provided to ascertain if additional resources or data are available.
14. How can I stay updated on further developments or reports in the Photonic Integrated Circuit Market?
To stay informed about further developments, trends, and reports in the Photonic Integrated Circuit Market, consider subscribing to industry newsletters, following relevant companies and organizations, or regularly checking reputable industry news sources and publications.
Methodology
Step 1 - Identification of Relevant Samples Size from Population Database


Step 2 - Approaches for Defining Global Market Size (Value, Volume* & Price*)

Note*: In applicable scenarios
Step 3 - Data Sources
Primary Research
- Web Analytics
- Survey Reports
- Research Institute
- Latest Research Reports
- Opinion Leaders
Secondary Research
- Annual Reports
- White Paper
- Latest Press Release
- Industry Association
- Paid Database
- Investor Presentations

Step 4 - Data Triangulation
Involves using different sources of information in order to increase the validity of a study
These sources are likely to be stakeholders in a program - participants, other researchers, program staff, other community members, and so on.
Then we put all data in single framework & apply various statistical tools to find out the dynamic on the market.
During the analysis stage, feedback from the stakeholder groups would be compared to determine areas of agreement as well as areas of divergence


