


Key Insights
The global Phishing Protection market is poised for substantial expansion, projected to reach $3.3 billion by 2025. This robust growth is underpinned by a compound annual growth rate (CAGR) of 20% from 2025 to 2033. Key growth drivers include the increasing sophistication and frequency of cyberattacks, necessitating enhanced protection for sensitive data, customer trust, and business continuity. Advancements in AI and machine learning for threat detection, alongside the growing adoption of cloud-based solutions, are further accelerating market growth. The Telecommunication & IT and BFSI sectors are expected to lead adoption due to their extensive handling of sensitive data and the critical nature of their operations.
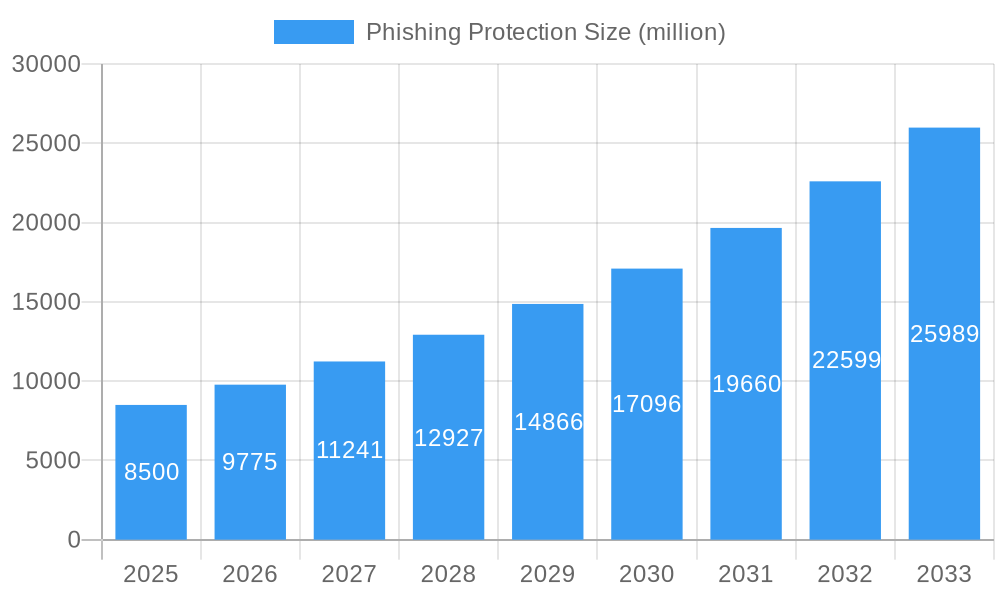
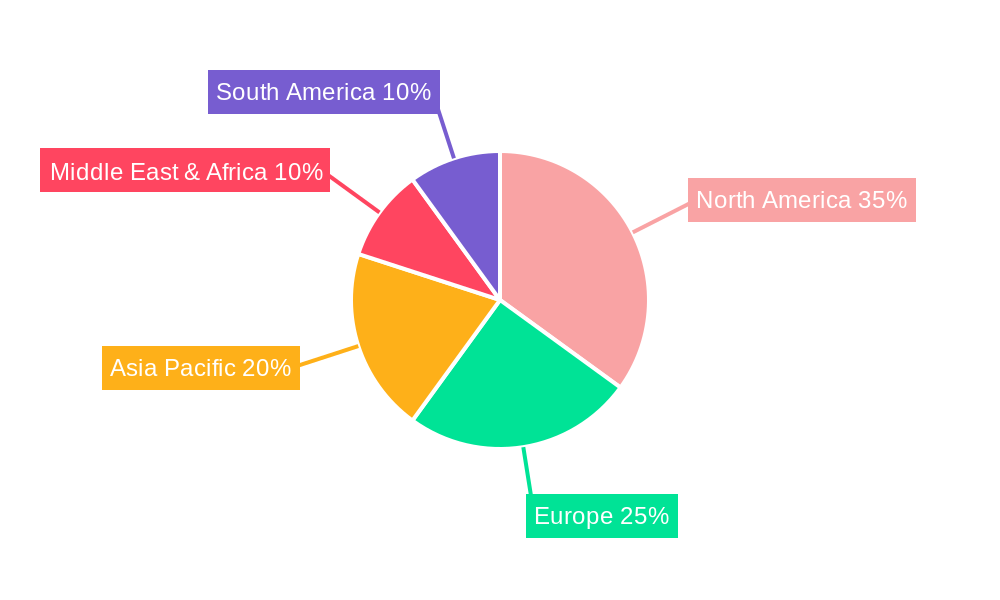
Phishing Protection Market Size (In Billion)

The market is segmented by application, with BFSI and Telecommunication & IT demonstrating the highest demand for advanced phishing protection. Further segmentation by threat type includes email-based and non-email-based phishing, with email-based threats remaining a significant concern requiring continuous defense strategies. While implementation costs and the need for ongoing employee training present potential challenges, increasing cybersecurity awareness and stringent regulatory compliance requirements are expected to mitigate these restraints. Geographically, North America is anticipated to lead market share due to its early adoption of advanced cybersecurity technologies and high business vulnerability. The rapidly growing digital economy and increasing cyber incidents in the Asia Pacific region present significant growth opportunities.
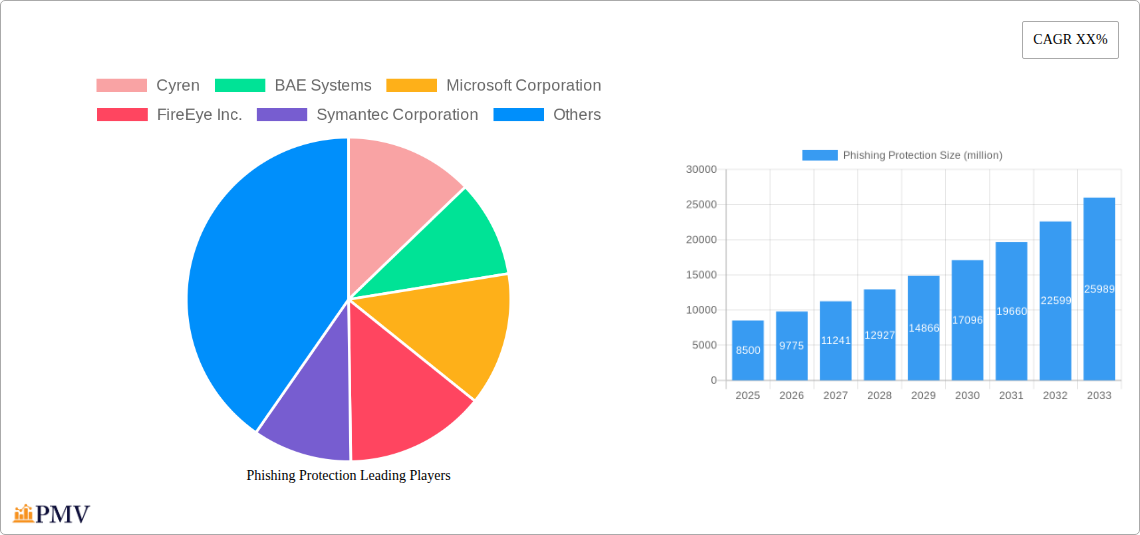
Phishing Protection Company Market Share
This comprehensive report delivers a definitive analysis of the global Phishing Protection market, forecasting its trajectory from 2019 to 2033. It examines historical trends, current dynamics, future projections, market structure, key industry trends, dominant segments, product innovations, and the competitive landscape shaped by leading companies. With a base year of 2025 and a forecast period extending to 2033, this study provides critical insights into growth drivers, challenges, and strategic opportunities within this vital cybersecurity sector.
Phishing Protection Market Structure & Competitive Dynamics
The Phishing Protection market is characterized by a dynamic interplay of established cybersecurity giants and innovative emerging players, resulting in a moderately concentrated yet fiercely competitive landscape. Innovation ecosystems are rapidly evolving, driven by advancements in artificial intelligence, machine learning, and behavioral analytics to counter sophisticated phishing tactics. Regulatory frameworks worldwide are increasingly mandating robust phishing defenses, particularly within the BFSI, Government, and Healthcare sectors, thereby influencing market penetration and adoption. Product substitutes, while present in basic email filtering solutions, are largely outpaced by advanced, multi-layered phishing protection platforms that integrate threat intelligence, user awareness training, and advanced detection mechanisms. End-user trends highlight a growing demand for integrated security solutions and a proactive approach to threat mitigation. Mergers and acquisitions (M&A) activity is a significant aspect, with deal values in the multi-million dollar range as larger players consolidate capabilities or acquire innovative technologies. For instance, recent M&A activities have seen valuations of specialized phishing defense firms reaching upwards of $500 million, reflecting the strategic importance of this sector. The market share distribution indicates a significant portion held by top-tier vendors, with growth opportunities for niche providers offering specialized solutions.
Phishing Protection Industry Trends & Insights
The Phishing Protection industry is experiencing robust growth, fueled by a confluence of escalating cyber threats, increasing digitalization across all sectors, and heightened regulatory scrutiny. The compound annual growth rate (CAGR) is projected to be approximately 15-20% over the forecast period (2025-2033). Market penetration is steadily increasing, with an estimated 70% of large enterprises having adopted advanced phishing protection solutions by 2025, a figure expected to rise to over 90% by 2033. Technological disruptions, particularly the pervasive use of AI and machine learning in developing more sophisticated and evasive phishing attacks, necessitate equally advanced detection and prevention mechanisms. This drives demand for solutions that can analyze vast datasets, identify anomalous patterns, and provide real-time threat intelligence. Consumer preferences are shifting towards user-friendly, integrated platforms that offer comprehensive protection without compromising productivity. Competitive dynamics are intensifying, with vendors differentiating themselves through superior threat detection accuracy, broader platform integration, and advanced analytics capabilities. The ongoing evolution of phishing tactics, including spear-phishing, whaling, and business email compromise (BEC), demands continuous innovation from market players. The global market size is estimated to reach over $20 billion by 2025 and is projected to exceed $50 billion by 2033.
Dominant Markets & Segments in Phishing Protection
The BFSI (Banking, Financial Services, and Insurance) sector stands out as a dominant market within the Phishing Protection landscape. This is primarily driven by the immense financial stakes involved and the stringent regulatory compliance requirements faced by financial institutions. The sheer volume of sensitive data processed and the direct impact of financial fraud make robust phishing defenses a top priority. Economic policies in this sector often mandate advanced security measures, and the continuous evolution of online banking and digital payment systems creates persistent attack vectors.
- Key Drivers in BFSI:
- High value of financial assets at risk, estimated in the billions annually due to phishing.
- Strict regulatory mandates like GDPR, PCI DSS, and local financial data protection laws.
- Rapid adoption of digital transformation and cloud-based financial services.
- Increasing sophistication of financial fraud schemes targeting customers and employees.
Geographically, North America continues to lead the market, owing to early adoption of advanced cybersecurity technologies, a mature regulatory environment, and a high concentration of businesses across all key application segments. The United States, in particular, accounts for a significant portion of the global market share, with extensive investments in cybersecurity infrastructure and a proactive approach to threat mitigation.
Among the types of phishing, Email-based Phishing remains the most prevalent and impactful, accounting for an estimated 85% of all phishing attacks. However, Non-email based Phishing, including SMS phishing (smishing), voice phishing (vishing), and social media phishing, is rapidly gaining traction and presents a growing challenge. The market for non-email based phishing protection is projected to grow at a CAGR of approximately 25% over the forecast period.
Phishing Protection Product Innovations
Recent product innovations in Phishing Protection are heavily focused on leveraging artificial intelligence and machine learning for advanced threat detection and response. Solutions now incorporate natural language processing (NLP) to analyze email content for deceptive language and sentiment, as well as behavioral analytics to identify unusual user activities. Extended detection and response (XDR) platforms are integrating phishing protection as a core component, providing a unified view across email, endpoints, and cloud applications. Key competitive advantages lie in the ability to provide real-time blocking of sophisticated threats, minimize false positives, and offer comprehensive user awareness training modules. Market fit is increasingly defined by seamless integration with existing security stacks and the provision of actionable threat intelligence.
Report Segmentation & Scope
The Phishing Protection market is segmented across various applications and types. The Application segments include BFSI, Government, Healthcare, Telecommunication and IT, Transportation, Education, and Retail. The Types of phishing analyzed include Email-based Phishing and Non-email based Phishing.
- BFSI: Expected market size of over $5 billion by 2025, with a projected CAGR of 18%. Competitive dynamics are driven by major financial institutions and specialized cybersecurity vendors.
- Government: Market size estimated at $3 billion by 2025, with a CAGR of 16%. Driven by national security concerns and critical infrastructure protection.
- Healthcare: Estimated market size of $2.5 billion by 2025, CAGR of 17%. Focus on protecting patient data (PHI) and medical devices.
- Telecommunication and IT: Market size of $4 billion by 2025, CAGR of 19%. Driven by the vast number of users and the criticality of communication networks.
- Transportation: Estimated market size of $1.5 billion by 2025, CAGR of 15%. Growing concern over securing connected vehicles and logistics systems.
- Education: Market size of $1 billion by 2025, CAGR of 14%. Focus on protecting student data and academic institutions.
- Retail: Estimated market size of $2 billion by 2025, CAGR of 16%. Driven by the need to protect customer payment information and loyalty programs.
- Email-based Phishing: Dominant type, expected market size of $17 billion by 2025, CAGR of 15%.
- Non-email based Phishing: Growing segment, expected market size of $3 billion by 2025, CAGR of 25%.
Key Drivers of Phishing Protection Growth
The growth of the Phishing Protection market is propelled by several key drivers. Technological advancements, particularly the rise of AI and machine learning, are crucial for developing more sophisticated defense mechanisms against evolving phishing tactics. Economic factors, such as increased investment in cybersecurity by businesses across all sectors and the growing cost of data breaches, are significant catalysts. Regulatory mandates, including data privacy laws like GDPR and CCPA, compel organizations to implement robust security measures. The increasing reliance on digital platforms and remote work environments also expands the attack surface, necessitating enhanced phishing protection. Furthermore, growing awareness of cyber threats among individuals and organizations fuels the demand for effective security solutions.
Challenges in the Phishing Protection Sector
Despite robust growth, the Phishing Protection sector faces several challenges. The ever-evolving nature of phishing attacks requires continuous adaptation and innovation, which can be costly for vendors. The skill gap in cybersecurity expertise can hinder the effective deployment and management of complex phishing protection systems. Regulatory hurdles, while driving adoption, can also create compliance burdens for businesses. Supply chain issues, particularly for hardware-based security solutions, can impact availability. Moreover, competitive pressures from numerous vendors offering similar solutions can lead to price wars and margin erosion. The sheer volume of emails and communication channels also presents a scaling challenge for detection systems, with billions of messages processed daily, leading to potential misses.
Leading Players in the Phishing Protection Market
- Cyren
- BAE Systems
- Microsoft Corporation
- FireEye Inc.
- Symantec Corporation
- Proofpoint, Inc.
- GreatHorn, Inc.
- Cisco Systems Inc.
- Phishlabs
- Intel Corporation
- Mimecast Ltd.
Key Developments in Phishing Protection Sector
- 2023/2024: Enhanced AI integration in email security gateways for proactive threat detection, leading to a significant reduction in successful phishing incidents.
- 2023/2024: Increased adoption of XDR solutions incorporating phishing protection for unified security visibility.
- 2024: Major vendors launch advanced simulation and training platforms for employee phishing awareness.
- 2024: Growing focus on API-based security to protect cloud applications from phishing threats.
- 2023: Strategic partnerships formed between email security providers and threat intelligence platforms to enhance detection capabilities.
Strategic Phishing Protection Market Outlook
The strategic outlook for the Phishing Protection market remains exceptionally strong, driven by the persistent and evolving nature of cyber threats. Future growth accelerators include the continued integration of AI and machine learning into security solutions, the expansion of cloud-based security services, and the increasing demand for comprehensive security awareness training programs. Opportunities lie in developing specialized solutions for emerging threats like AI-generated phishing content and advanced social engineering tactics. The increasing regulatory landscape and the growing realization of the business impact of phishing attacks will continue to fuel market expansion. Strategic investments in R&D and strategic acquisitions will be critical for players to maintain a competitive edge and capitalize on the expanding market potential. The estimated total addressable market for advanced phishing protection is projected to reach upwards of $75 billion by 2033.
Phishing Protection Segmentation
-
1. Application
- 1.1. BFSI
- 1.2. Government
- 1.3. Healthcare
- 1.4. Telecommunication and IT
- 1.5. Transportation
- 1.6. Education
- 1.7. Retail
-
2. Types
- 2.1. Email based Phishing
- 2.2. Non-email based Phishing
Phishing Protection Segmentation By Geography
-
1. North America
- 1.1. United States
- 1.2. Canada
- 1.3. Mexico
-
2. South America
- 2.1. Brazil
- 2.2. Argentina
- 2.3. Rest of South America
-
3. Europe
- 3.1. United Kingdom
- 3.2. Germany
- 3.3. France
- 3.4. Italy
- 3.5. Spain
- 3.6. Russia
- 3.7. Benelux
- 3.8. Nordics
- 3.9. Rest of Europe
-
4. Middle East & Africa
- 4.1. Turkey
- 4.2. Israel
- 4.3. GCC
- 4.4. North Africa
- 4.5. South Africa
- 4.6. Rest of Middle East & Africa
-
5. Asia Pacific
- 5.1. China
- 5.2. India
- 5.3. Japan
- 5.4. South Korea
- 5.5. ASEAN
- 5.6. Oceania
- 5.7. Rest of Asia Pacific
Phishing Protection Regional Market Share
Geographic Coverage of Phishing Protection
Phishing Protection REPORT HIGHLIGHTS
| Aspects | Details |
|---|---|
| Study Period | 2020-2034 |
| Base Year | 2025 |
| Estimated Year | 2026 |
| Forecast Period | 2026-2034 |
| Historical Period | 2020-2025 |
| Growth Rate | CAGR of 20% from 2020-2034 |
| Segmentation |
|
Table of Contents
- 1. Introduction
- 1.1. Research Scope
- 1.2. Market Segmentation
- 1.3. Research Methodology
- 1.4. Definitions and Assumptions
- 2. Executive Summary
- 2.1. Introduction
- 3. Market Dynamics
- 3.1. Introduction
- 3.2. Market Drivers
- 3.3. Market Restrains
- 3.4. Market Trends
- 4. Market Factor Analysis
- 4.1. Porters Five Forces
- 4.2. Supply/Value Chain
- 4.3. PESTEL analysis
- 4.4. Market Entropy
- 4.5. Patent/Trademark Analysis
- 5. Global Phishing Protection Analysis, Insights and Forecast, 2020-2032
- 5.1. Market Analysis, Insights and Forecast - by Application
- 5.1.1. BFSI
- 5.1.2. Government
- 5.1.3. Healthcare
- 5.1.4. Telecommunication and IT
- 5.1.5. Transportation
- 5.1.6. Education
- 5.1.7. Retail
- 5.2. Market Analysis, Insights and Forecast - by Types
- 5.2.1. Email based Phishing
- 5.2.2. Non-email based Phishing
- 5.3. Market Analysis, Insights and Forecast - by Region
- 5.3.1. North America
- 5.3.2. South America
- 5.3.3. Europe
- 5.3.4. Middle East & Africa
- 5.3.5. Asia Pacific
- 5.1. Market Analysis, Insights and Forecast - by Application
- 6. North America Phishing Protection Analysis, Insights and Forecast, 2020-2032
- 6.1. Market Analysis, Insights and Forecast - by Application
- 6.1.1. BFSI
- 6.1.2. Government
- 6.1.3. Healthcare
- 6.1.4. Telecommunication and IT
- 6.1.5. Transportation
- 6.1.6. Education
- 6.1.7. Retail
- 6.2. Market Analysis, Insights and Forecast - by Types
- 6.2.1. Email based Phishing
- 6.2.2. Non-email based Phishing
- 6.1. Market Analysis, Insights and Forecast - by Application
- 7. South America Phishing Protection Analysis, Insights and Forecast, 2020-2032
- 7.1. Market Analysis, Insights and Forecast - by Application
- 7.1.1. BFSI
- 7.1.2. Government
- 7.1.3. Healthcare
- 7.1.4. Telecommunication and IT
- 7.1.5. Transportation
- 7.1.6. Education
- 7.1.7. Retail
- 7.2. Market Analysis, Insights and Forecast - by Types
- 7.2.1. Email based Phishing
- 7.2.2. Non-email based Phishing
- 7.1. Market Analysis, Insights and Forecast - by Application
- 8. Europe Phishing Protection Analysis, Insights and Forecast, 2020-2032
- 8.1. Market Analysis, Insights and Forecast - by Application
- 8.1.1. BFSI
- 8.1.2. Government
- 8.1.3. Healthcare
- 8.1.4. Telecommunication and IT
- 8.1.5. Transportation
- 8.1.6. Education
- 8.1.7. Retail
- 8.2. Market Analysis, Insights and Forecast - by Types
- 8.2.1. Email based Phishing
- 8.2.2. Non-email based Phishing
- 8.1. Market Analysis, Insights and Forecast - by Application
- 9. Middle East & Africa Phishing Protection Analysis, Insights and Forecast, 2020-2032
- 9.1. Market Analysis, Insights and Forecast - by Application
- 9.1.1. BFSI
- 9.1.2. Government
- 9.1.3. Healthcare
- 9.1.4. Telecommunication and IT
- 9.1.5. Transportation
- 9.1.6. Education
- 9.1.7. Retail
- 9.2. Market Analysis, Insights and Forecast - by Types
- 9.2.1. Email based Phishing
- 9.2.2. Non-email based Phishing
- 9.1. Market Analysis, Insights and Forecast - by Application
- 10. Asia Pacific Phishing Protection Analysis, Insights and Forecast, 2020-2032
- 10.1. Market Analysis, Insights and Forecast - by Application
- 10.1.1. BFSI
- 10.1.2. Government
- 10.1.3. Healthcare
- 10.1.4. Telecommunication and IT
- 10.1.5. Transportation
- 10.1.6. Education
- 10.1.7. Retail
- 10.2. Market Analysis, Insights and Forecast - by Types
- 10.2.1. Email based Phishing
- 10.2.2. Non-email based Phishing
- 10.1. Market Analysis, Insights and Forecast - by Application
- 11. Competitive Analysis
- 11.1. Global Market Share Analysis 2025
- 11.2. Company Profiles
- 11.2.1 Cyren
- 11.2.1.1. Overview
- 11.2.1.2. Products
- 11.2.1.3. SWOT Analysis
- 11.2.1.4. Recent Developments
- 11.2.1.5. Financials (Based on Availability)
- 11.2.2 BAE Systems
- 11.2.2.1. Overview
- 11.2.2.2. Products
- 11.2.2.3. SWOT Analysis
- 11.2.2.4. Recent Developments
- 11.2.2.5. Financials (Based on Availability)
- 11.2.3 Microsoft Corporation
- 11.2.3.1. Overview
- 11.2.3.2. Products
- 11.2.3.3. SWOT Analysis
- 11.2.3.4. Recent Developments
- 11.2.3.5. Financials (Based on Availability)
- 11.2.4 FireEye Inc.
- 11.2.4.1. Overview
- 11.2.4.2. Products
- 11.2.4.3. SWOT Analysis
- 11.2.4.4. Recent Developments
- 11.2.4.5. Financials (Based on Availability)
- 11.2.5 Symantec Corporation
- 11.2.5.1. Overview
- 11.2.5.2. Products
- 11.2.5.3. SWOT Analysis
- 11.2.5.4. Recent Developments
- 11.2.5.5. Financials (Based on Availability)
- 11.2.6 Proofpoint
- 11.2.6.1. Overview
- 11.2.6.2. Products
- 11.2.6.3. SWOT Analysis
- 11.2.6.4. Recent Developments
- 11.2.6.5. Financials (Based on Availability)
- 11.2.7 Inc.
- 11.2.7.1. Overview
- 11.2.7.2. Products
- 11.2.7.3. SWOT Analysis
- 11.2.7.4. Recent Developments
- 11.2.7.5. Financials (Based on Availability)
- 11.2.8 GreatHorn
- 11.2.8.1. Overview
- 11.2.8.2. Products
- 11.2.8.3. SWOT Analysis
- 11.2.8.4. Recent Developments
- 11.2.8.5. Financials (Based on Availability)
- 11.2.9 Inc.
- 11.2.9.1. Overview
- 11.2.9.2. Products
- 11.2.9.3. SWOT Analysis
- 11.2.9.4. Recent Developments
- 11.2.9.5. Financials (Based on Availability)
- 11.2.10 Cisco Systems Inc.
- 11.2.10.1. Overview
- 11.2.10.2. Products
- 11.2.10.3. SWOT Analysis
- 11.2.10.4. Recent Developments
- 11.2.10.5. Financials (Based on Availability)
- 11.2.11 Phishlabs
- 11.2.11.1. Overview
- 11.2.11.2. Products
- 11.2.11.3. SWOT Analysis
- 11.2.11.4. Recent Developments
- 11.2.11.5. Financials (Based on Availability)
- 11.2.12 Intel Corporation
- 11.2.12.1. Overview
- 11.2.12.2. Products
- 11.2.12.3. SWOT Analysis
- 11.2.12.4. Recent Developments
- 11.2.12.5. Financials (Based on Availability)
- 11.2.13 Mimecast Ltd.
- 11.2.13.1. Overview
- 11.2.13.2. Products
- 11.2.13.3. SWOT Analysis
- 11.2.13.4. Recent Developments
- 11.2.13.5. Financials (Based on Availability)
- 11.2.1 Cyren
List of Figures
- Figure 1: Global Phishing Protection Revenue Breakdown (billion, %) by Region 2025 & 2033
- Figure 2: North America Phishing Protection Revenue (billion), by Application 2025 & 2033
- Figure 3: North America Phishing Protection Revenue Share (%), by Application 2025 & 2033
- Figure 4: North America Phishing Protection Revenue (billion), by Types 2025 & 2033
- Figure 5: North America Phishing Protection Revenue Share (%), by Types 2025 & 2033
- Figure 6: North America Phishing Protection Revenue (billion), by Country 2025 & 2033
- Figure 7: North America Phishing Protection Revenue Share (%), by Country 2025 & 2033
- Figure 8: South America Phishing Protection Revenue (billion), by Application 2025 & 2033
- Figure 9: South America Phishing Protection Revenue Share (%), by Application 2025 & 2033
- Figure 10: South America Phishing Protection Revenue (billion), by Types 2025 & 2033
- Figure 11: South America Phishing Protection Revenue Share (%), by Types 2025 & 2033
- Figure 12: South America Phishing Protection Revenue (billion), by Country 2025 & 2033
- Figure 13: South America Phishing Protection Revenue Share (%), by Country 2025 & 2033
- Figure 14: Europe Phishing Protection Revenue (billion), by Application 2025 & 2033
- Figure 15: Europe Phishing Protection Revenue Share (%), by Application 2025 & 2033
- Figure 16: Europe Phishing Protection Revenue (billion), by Types 2025 & 2033
- Figure 17: Europe Phishing Protection Revenue Share (%), by Types 2025 & 2033
- Figure 18: Europe Phishing Protection Revenue (billion), by Country 2025 & 2033
- Figure 19: Europe Phishing Protection Revenue Share (%), by Country 2025 & 2033
- Figure 20: Middle East & Africa Phishing Protection Revenue (billion), by Application 2025 & 2033
- Figure 21: Middle East & Africa Phishing Protection Revenue Share (%), by Application 2025 & 2033
- Figure 22: Middle East & Africa Phishing Protection Revenue (billion), by Types 2025 & 2033
- Figure 23: Middle East & Africa Phishing Protection Revenue Share (%), by Types 2025 & 2033
- Figure 24: Middle East & Africa Phishing Protection Revenue (billion), by Country 2025 & 2033
- Figure 25: Middle East & Africa Phishing Protection Revenue Share (%), by Country 2025 & 2033
- Figure 26: Asia Pacific Phishing Protection Revenue (billion), by Application 2025 & 2033
- Figure 27: Asia Pacific Phishing Protection Revenue Share (%), by Application 2025 & 2033
- Figure 28: Asia Pacific Phishing Protection Revenue (billion), by Types 2025 & 2033
- Figure 29: Asia Pacific Phishing Protection Revenue Share (%), by Types 2025 & 2033
- Figure 30: Asia Pacific Phishing Protection Revenue (billion), by Country 2025 & 2033
- Figure 31: Asia Pacific Phishing Protection Revenue Share (%), by Country 2025 & 2033
List of Tables
- Table 1: Global Phishing Protection Revenue billion Forecast, by Application 2020 & 2033
- Table 2: Global Phishing Protection Revenue billion Forecast, by Types 2020 & 2033
- Table 3: Global Phishing Protection Revenue billion Forecast, by Region 2020 & 2033
- Table 4: Global Phishing Protection Revenue billion Forecast, by Application 2020 & 2033
- Table 5: Global Phishing Protection Revenue billion Forecast, by Types 2020 & 2033
- Table 6: Global Phishing Protection Revenue billion Forecast, by Country 2020 & 2033
- Table 7: United States Phishing Protection Revenue (billion) Forecast, by Application 2020 & 2033
- Table 8: Canada Phishing Protection Revenue (billion) Forecast, by Application 2020 & 2033
- Table 9: Mexico Phishing Protection Revenue (billion) Forecast, by Application 2020 & 2033
- Table 10: Global Phishing Protection Revenue billion Forecast, by Application 2020 & 2033
- Table 11: Global Phishing Protection Revenue billion Forecast, by Types 2020 & 2033
- Table 12: Global Phishing Protection Revenue billion Forecast, by Country 2020 & 2033
- Table 13: Brazil Phishing Protection Revenue (billion) Forecast, by Application 2020 & 2033
- Table 14: Argentina Phishing Protection Revenue (billion) Forecast, by Application 2020 & 2033
- Table 15: Rest of South America Phishing Protection Revenue (billion) Forecast, by Application 2020 & 2033
- Table 16: Global Phishing Protection Revenue billion Forecast, by Application 2020 & 2033
- Table 17: Global Phishing Protection Revenue billion Forecast, by Types 2020 & 2033
- Table 18: Global Phishing Protection Revenue billion Forecast, by Country 2020 & 2033
- Table 19: United Kingdom Phishing Protection Revenue (billion) Forecast, by Application 2020 & 2033
- Table 20: Germany Phishing Protection Revenue (billion) Forecast, by Application 2020 & 2033
- Table 21: France Phishing Protection Revenue (billion) Forecast, by Application 2020 & 2033
- Table 22: Italy Phishing Protection Revenue (billion) Forecast, by Application 2020 & 2033
- Table 23: Spain Phishing Protection Revenue (billion) Forecast, by Application 2020 & 2033
- Table 24: Russia Phishing Protection Revenue (billion) Forecast, by Application 2020 & 2033
- Table 25: Benelux Phishing Protection Revenue (billion) Forecast, by Application 2020 & 2033
- Table 26: Nordics Phishing Protection Revenue (billion) Forecast, by Application 2020 & 2033
- Table 27: Rest of Europe Phishing Protection Revenue (billion) Forecast, by Application 2020 & 2033
- Table 28: Global Phishing Protection Revenue billion Forecast, by Application 2020 & 2033
- Table 29: Global Phishing Protection Revenue billion Forecast, by Types 2020 & 2033
- Table 30: Global Phishing Protection Revenue billion Forecast, by Country 2020 & 2033
- Table 31: Turkey Phishing Protection Revenue (billion) Forecast, by Application 2020 & 2033
- Table 32: Israel Phishing Protection Revenue (billion) Forecast, by Application 2020 & 2033
- Table 33: GCC Phishing Protection Revenue (billion) Forecast, by Application 2020 & 2033
- Table 34: North Africa Phishing Protection Revenue (billion) Forecast, by Application 2020 & 2033
- Table 35: South Africa Phishing Protection Revenue (billion) Forecast, by Application 2020 & 2033
- Table 36: Rest of Middle East & Africa Phishing Protection Revenue (billion) Forecast, by Application 2020 & 2033
- Table 37: Global Phishing Protection Revenue billion Forecast, by Application 2020 & 2033
- Table 38: Global Phishing Protection Revenue billion Forecast, by Types 2020 & 2033
- Table 39: Global Phishing Protection Revenue billion Forecast, by Country 2020 & 2033
- Table 40: China Phishing Protection Revenue (billion) Forecast, by Application 2020 & 2033
- Table 41: India Phishing Protection Revenue (billion) Forecast, by Application 2020 & 2033
- Table 42: Japan Phishing Protection Revenue (billion) Forecast, by Application 2020 & 2033
- Table 43: South Korea Phishing Protection Revenue (billion) Forecast, by Application 2020 & 2033
- Table 44: ASEAN Phishing Protection Revenue (billion) Forecast, by Application 2020 & 2033
- Table 45: Oceania Phishing Protection Revenue (billion) Forecast, by Application 2020 & 2033
- Table 46: Rest of Asia Pacific Phishing Protection Revenue (billion) Forecast, by Application 2020 & 2033
Frequently Asked Questions
1. What is the projected Compound Annual Growth Rate (CAGR) of the Phishing Protection?
The projected CAGR is approximately 20%.
2. Which companies are prominent players in the Phishing Protection?
Key companies in the market include Cyren, BAE Systems, Microsoft Corporation, FireEye Inc., Symantec Corporation, Proofpoint, Inc., GreatHorn, Inc., Cisco Systems Inc., Phishlabs, Intel Corporation, Mimecast Ltd..
3. What are the main segments of the Phishing Protection?
The market segments include Application, Types.
4. Can you provide details about the market size?
The market size is estimated to be USD 3.3 billion as of 2022.
5. What are some drivers contributing to market growth?
N/A
6. What are the notable trends driving market growth?
N/A
7. Are there any restraints impacting market growth?
N/A
8. Can you provide examples of recent developments in the market?
N/A
9. What pricing options are available for accessing the report?
Pricing options include single-user, multi-user, and enterprise licenses priced at USD 5600.00, USD 8400.00, and USD 11200.00 respectively.
10. Is the market size provided in terms of value or volume?
The market size is provided in terms of value, measured in billion.
11. Are there any specific market keywords associated with the report?
Yes, the market keyword associated with the report is "Phishing Protection," which aids in identifying and referencing the specific market segment covered.
12. How do I determine which pricing option suits my needs best?
The pricing options vary based on user requirements and access needs. Individual users may opt for single-user licenses, while businesses requiring broader access may choose multi-user or enterprise licenses for cost-effective access to the report.
13. Are there any additional resources or data provided in the Phishing Protection report?
While the report offers comprehensive insights, it's advisable to review the specific contents or supplementary materials provided to ascertain if additional resources or data are available.
14. How can I stay updated on further developments or reports in the Phishing Protection?
To stay informed about further developments, trends, and reports in the Phishing Protection, consider subscribing to industry newsletters, following relevant companies and organizations, or regularly checking reputable industry news sources and publications.
Methodology
Step 1 - Identification of Relevant Samples Size from Population Database


Step 2 - Approaches for Defining Global Market Size (Value, Volume* & Price*)

Note*: In applicable scenarios
Step 3 - Data Sources
Primary Research
- Web Analytics
- Survey Reports
- Research Institute
- Latest Research Reports
- Opinion Leaders
Secondary Research
- Annual Reports
- White Paper
- Latest Press Release
- Industry Association
- Paid Database
- Investor Presentations

Step 4 - Data Triangulation
Involves using different sources of information in order to increase the validity of a study
These sources are likely to be stakeholders in a program - participants, other researchers, program staff, other community members, and so on.
Then we put all data in single framework & apply various statistical tools to find out the dynamic on the market.
During the analysis stage, feedback from the stakeholder groups would be compared to determine areas of agreement as well as areas of divergence