
Key Insights
The global pharmaceutical cartridges market is anticipated to grow robustly, reaching a market size of $XX million by 2025, with a compound annual growth rate (CAGR) of 7.50% during the forecast period from 2025 to 2033. This growth is primarily driven by the increasing demand for efficient drug delivery systems and the rising prevalence of chronic diseases, which necessitate regular medication. Pharmaceutical and biotechnology companies are the major end users, with segments by material such as glass and plastic, and by capacity ranging from less than 3ml to more than 10ml. The market is further segmented by therapeutic areas including ophthalmology, respiratory, neurology, oncology, and others, showcasing the diverse applications of pharmaceutical cartridges.
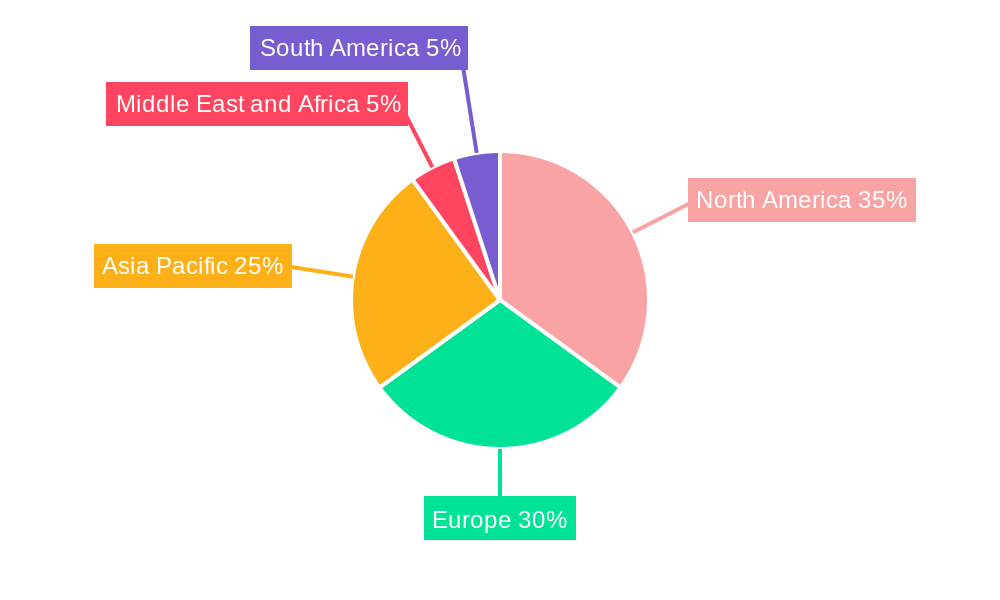
Regionally, North America holds a significant share of the market, attributed to advanced healthcare infrastructure and the presence of key market players like West Pharmaceutical Services Inc and Gerresheimer AG. Europe and the Asia Pacific also contribute significantly, with Asia Pacific expected to witness the fastest growth due to increasing healthcare investments and expanding pharmaceutical sectors in countries like China and India. Key companies such as Merck KGaA, Schott AG, and Nipro Corporation are actively involved in innovations and strategic expansions to maintain their competitive edge. The market's growth is slightly restrained by the high costs associated with advanced cartridge technologies and stringent regulatory requirements, yet the overall outlook remains positive, driven by continual advancements and the expanding global healthcare landscape.

Pharmaceutical Cartridges Market Market Structure & Competitive Dynamics
The Pharmaceutical Cartridges Market is characterized by a dynamic interplay of several factors including market concentration, innovation ecosystems, regulatory frameworks, product substitutes, end-user trends, and mergers and acquisitions (M&A) activities. The market concentration is moderate, with a few large players like West Pharmaceutical Services Inc and Gerresheimer AG holding significant market shares, approximately 15% and 12% respectively. The innovation ecosystem is robust, driven by continuous R&D investments aimed at developing new materials and improving cartridge designs. Regulatory frameworks, particularly in regions like North America and Europe, impose stringent standards on material safety and product efficacy, influencing market dynamics.
- Innovation Ecosystems: Companies are investing heavily in R&D to develop advanced materials like silicone-coated glass and high-quality plastics, which enhance product durability and safety.
- Regulatory Frameworks: Compliance with regulations like the EU Medical Device Regulation (MDR) and the US FDA guidelines is crucial, impacting product development timelines and market entry.
- Product Substitutes: Alternatives such as prefilled syringes and vials pose competitive threats, though cartridges maintain a strong position due to their convenience and efficiency.
- End-User Trends: There is a growing preference among pharmaceutical and biotechnology companies for cartridges due to their ease of use and reduced risk of contamination.
- M&A Activities: Notable M&A deals include Gerresheimer's acquisition of Triveni Polymers for $20 Million in 2023, aimed at expanding its plastic packaging capabilities.
The competitive landscape is further shaped by strategic partnerships and collaborations, which are essential for leveraging technology and expanding market reach.
Pharmaceutical Cartridges Market Industry Trends & Insights
The Pharmaceutical Cartridges Market is witnessing significant growth, driven by several key factors. The increasing prevalence of chronic diseases globally has heightened the demand for efficient drug delivery systems, propelling the market forward. Technological disruptions, particularly in the development of smart cartridges with integrated sensors, are reshaping the industry. These innovations enhance patient safety and compliance, contributing to a projected Compound Annual Growth Rate (CAGR) of 6.5% from 2025 to 2033. Consumer preferences are shifting towards more user-friendly and environmentally sustainable products, influencing companies to adopt eco-friendly materials like recyclable plastics and biodegradable polymers.
The competitive dynamics within the market are intense, with companies like Merck KGaA and Schott AG focusing on expanding their product portfolios to include a wider range of capacities and materials. Market penetration in emerging economies such as India and China is increasing, driven by rising healthcare expenditures and government initiatives to improve healthcare infrastructure. The adoption of advanced manufacturing technologies, such as automation and 3D printing, is enhancing production efficiency and reducing costs, thereby enabling companies to offer competitive pricing.
Regulatory environments continue to evolve, with a focus on ensuring product safety and efficacy. For instance, the FDA's recent guidelines on drug-device combination products have necessitated adjustments in product design and marketing strategies. The integration of digital health solutions, such as connected devices for real-time monitoring, is another trend that is expected to drive market growth. Overall, the Pharmaceutical Cartridges Market is poised for continued expansion, supported by technological advancements, changing consumer needs, and strategic industry initiatives.

Dominant Markets & Segments in Pharmaceutical Cartridges Market
The Pharmaceutical Cartridges Market exhibits varying levels of dominance across different segments and regions. North America, particularly the United States, holds a leading position due to its advanced healthcare infrastructure and high prevalence of chronic diseases. Europe follows closely, driven by stringent regulatory standards and a strong focus on innovation.
By End User:
Pharmaceutical Companies: The largest segment, driven by the need for efficient drug delivery systems and the prevalence of chronic diseases.
Biotechnology Companies: Growing rapidly due to the development of biologics and personalized medicine.
Other End Users: Includes research institutes and contract manufacturing organizations, which are expanding due to outsourcing trends.
By Material:
Glass: Dominant due to its superior chemical resistance and compatibility with a wide range of drugs.
Plastic: Gaining traction due to its lightweight nature and cost-effectiveness, particularly in developing regions.
Other Plastic Material (Rubber): Used for sealing and gasket applications, contributing to the market's growth.
By Capacity:
Less than 3ml: Commonly used for vaccines and small-dose medications.
3ml-5ml: Widely utilized for insulin and other injectable drugs.
5ml-10ml: Suitable for larger doses and more complex formulations.
More than 10ml: Less common but essential for specific therapeutic applications.
By Therapeutic Area:
Ophthalmology: Significant demand due to the prevalence of eye diseases.
Respiratory: Growing due to the rise in respiratory disorders.
Neurology: Increasing need for neurological treatments.
Oncology: High demand for cancer therapies.
Immunology: Expanding due to the development of biologics.
Cardiology: Driven by the prevalence of cardiovascular diseases.
Diabetes: Dominated by the need for insulin delivery.
Dental: Growing due to advancements in dental care.
Other Therapeutic Area: Includes various niche markets.
The dominance of these segments can be attributed to several factors:
- Economic Policies: Favorable policies in developed regions like the US and Europe support R&D investments and market growth.
- Infrastructure: Advanced healthcare systems and manufacturing capabilities in North America and Europe contribute to market leadership.
- Regulatory Environment: Stringent regulations ensure product quality, driving innovation and market expansion.
- Consumer Demand: Increasing awareness and prevalence of chronic diseases boost the demand for efficient drug delivery solutions.
Pharmaceutical Cartridges Market Product Innovations
Product innovations in the Pharmaceutical Cartridges Market are driven by the need for enhanced safety, efficiency, and patient compliance. Recent developments include the introduction of smart cartridges with integrated sensors for real-time monitoring of drug delivery. These innovations improve patient outcomes by ensuring accurate dosing and reducing the risk of errors. Companies are also focusing on developing eco-friendly materials, such as biodegradable plastics, to meet the growing demand for sustainable products. The integration of advanced manufacturing technologies, like 3D printing, allows for customization and rapid prototyping, enhancing the market fit of new products.
Report Segmentation & Scope
The Pharmaceutical Cartridges Market is segmented by end user, material, capacity, and therapeutic area, providing a comprehensive view of the industry.
By End User: The market is divided into Pharmaceutical Companies, Biotechnology Companies, and Other End Users. Pharmaceutical Companies are expected to grow at a CAGR of 6.8% during the forecast period, driven by the need for efficient drug delivery systems.
By Material: Segments include Glass, Plastic, and Other Plastic Material (Rubber). Glass remains dominant with a market size of $500 Million in 2025, due to its superior chemical resistance.
By Capacity: The market is categorized into Less than 3ml, 3ml-5ml, 5ml-10ml, and More than 10 ml. The 3ml-5ml segment is projected to reach $300 Million by 2033, driven by its use in insulin delivery.
By Therapeutic Area: Segments include Ophthalmology, Respiratory, Neurology, Oncology, Immunology, Cardiology, Diabetes, Dental, and Other Therapeutic Area. The Diabetes segment is expected to grow at a CAGR of 7.2%, fueled by the increasing prevalence of the disease.
Key Drivers of Pharmaceutical Cartridges Market Growth
The Pharmaceutical Cartridges Market is driven by several key factors. Technological advancements, such as the development of smart cartridges with integrated sensors, are enhancing patient safety and compliance. Economic factors, including rising healthcare expenditures in emerging markets, are boosting demand for efficient drug delivery systems. Regulatory changes, like the EU Medical Device Regulation (MDR), are encouraging innovation and market expansion. For instance, the increasing prevalence of chronic diseases globally necessitates advanced drug delivery solutions, propelling market growth.
Challenges in the Pharmaceutical Cartridges Market Sector
The Pharmaceutical Cartridges Market faces several challenges. Regulatory hurdles, such as compliance with stringent standards like the US FDA guidelines, can delay product launches and increase costs. Supply chain issues, exacerbated by global events like the COVID-19 pandemic, have led to disruptions and increased lead times. Competitive pressures are intense, with companies like Merck KGaA and Schott AG vying for market share through innovation and strategic acquisitions. These challenges have a quantifiable impact, with regulatory compliance costs estimated at $50 Million annually for major players.
Leading Players in the Pharmaceutical Cartridges Market Market
- West Pharmaceutical Services Inc
- Kel India Filters
- Merck KGaA
- Schott AG
- Kalbag Filters Pvt
- Nipro Corporation
- AptarGroup Inc
- Shandong Province Medicinal Glass Co Ltd
- Stevanato Group
- Transcoject GmbH
- Datwyler Holding Inc
- Gerresheimer AG
Key Developments in Pharmaceutical Cartridges Market Sector
- January 2023: Gerresheimer AG acquired Triveni Polymers for $20 Million, expanding its plastic packaging capabilities.
- March 2023: West Pharmaceutical Services Inc launched a new line of smart cartridges with integrated sensors, enhancing patient safety and compliance.
- June 2023: Merck KGaA announced a strategic partnership with a leading biotechnology company to develop advanced drug delivery systems, impacting market dynamics by increasing product offerings.
Strategic Pharmaceutical Cartridges Market Market Outlook
The Pharmaceutical Cartridges Market is poised for significant growth, driven by technological advancements and increasing demand for efficient drug delivery systems. Future market potential lies in the development of smart cartridges and eco-friendly materials, which align with consumer preferences for sustainability and safety. Strategic opportunities include expanding into emerging markets like India and China, where healthcare infrastructure is improving. Companies that focus on innovation and strategic partnerships will be well-positioned to capitalize on these growth accelerators and achieve long-term success.
Pharmaceutical Cartridges Market Segmentation
-
1. Material
- 1.1. Glass
- 1.2. Plastic
- 1.3. Rubber
-
2. Capacity
- 2.1. Less than 3ml
- 2.2. 3ml-5ml
- 2.3. 5ml-10ml
- 2.4. More than 10 ml
-
3. Therapeutic Area
- 3.1. Ophthalmology
- 3.2. Respiratory
- 3.3. Neurology
- 3.4. Oncology
- 3.5. Immunology
- 3.6. Cardiology
- 3.7. Diabetes
- 3.8. Dental
- 3.9. Other Therapeutic Area
-
4. End User
- 4.1. Pharmaceutical Companies
- 4.2. Biotechnology Companies
- 4.3. Other End Users
Pharmaceutical Cartridges Market Segmentation By Geography
-
1. North America
- 1.1. United States
- 1.2. Canada
- 1.3. Mexico
-
2. Europe
- 2.1. Germany
- 2.2. United Kingdom
- 2.3. France
- 2.4. Italy
- 2.5. Spain
- 2.6. Rest of Europe
-
3. Asia Pacific
- 3.1. China
- 3.2. Japan
- 3.3. India
- 3.4. Australia
- 3.5. South Korea
- 3.6. Rest of Asia Pacific
-
4. Middle East and Africa
- 4.1. GCC
- 4.2. South Africa
- 4.3. Rest of Middle East and Africa
-
5. South America
- 5.1. Brazil
- 5.2. Argentina
- 5.3. Rest of South America
Pharmaceutical Cartridges Market REPORT HIGHLIGHTS
| Aspects | Details |
|---|---|
| Study Period | 2019-2033 |
| Base Year | 2024 |
| Estimated Year | 2025 |
| Forecast Period | 2025-2033 |
| Historical Period | 2019-2024 |
| Growth Rate | CAGR of 7.50% from 2019-2033 |
| Segmentation |
|
Table of Contents
- 1. Introduction
- 1.1. Research Scope
- 1.2. Market Segmentation
- 1.3. Research Methodology
- 1.4. Definitions and Assumptions
- 2. Executive Summary
- 2.1. Introduction
- 3. Market Dynamics
- 3.1. Introduction
- 3.2. Market Drivers
- 3.2.1. Rising Demand for Easy to Use and Convenient Pharmaceutical Packaging Solutions; Increase in R&D Spending in the Pharmaceutical Industry
- 3.3. Market Restrains
- 3.3.1. Manufacturing Complexity and Stringent Regulatory Compliance Related to Pharmaceutical Cartridges
- 3.4. Market Trends
- 3.4.1. Glass Material is Expected to have Significant Market Share during the Forecast Period
- 4. Market Factor Analysis
- 4.1. Porters Five Forces
- 4.2. Supply/Value Chain
- 4.3. PESTEL analysis
- 4.4. Market Entropy
- 4.5. Patent/Trademark Analysis
- 5. Global Pharmaceutical Cartridges Market Analysis, Insights and Forecast, 2019-2031
- 5.1. Market Analysis, Insights and Forecast - by Material
- 5.1.1. Glass
- 5.1.2. Plastic
- 5.1.3. Rubber
- 5.2. Market Analysis, Insights and Forecast - by Capacity
- 5.2.1. Less than 3ml
- 5.2.2. 3ml-5ml
- 5.2.3. 5ml-10ml
- 5.2.4. More than 10 ml
- 5.3. Market Analysis, Insights and Forecast - by Therapeutic Area
- 5.3.1. Ophthalmology
- 5.3.2. Respiratory
- 5.3.3. Neurology
- 5.3.4. Oncology
- 5.3.5. Immunology
- 5.3.6. Cardiology
- 5.3.7. Diabetes
- 5.3.8. Dental
- 5.3.9. Other Therapeutic Area
- 5.4. Market Analysis, Insights and Forecast - by End User
- 5.4.1. Pharmaceutical Companies
- 5.4.2. Biotechnology Companies
- 5.4.3. Other End Users
- 5.5. Market Analysis, Insights and Forecast - by Region
- 5.5.1. North America
- 5.5.2. Europe
- 5.5.3. Asia Pacific
- 5.5.4. Middle East and Africa
- 5.5.5. South America
- 5.1. Market Analysis, Insights and Forecast - by Material
- 6. North America Pharmaceutical Cartridges Market Analysis, Insights and Forecast, 2019-2031
- 6.1. Market Analysis, Insights and Forecast - by Material
- 6.1.1. Glass
- 6.1.2. Plastic
- 6.1.3. Rubber
- 6.2. Market Analysis, Insights and Forecast - by Capacity
- 6.2.1. Less than 3ml
- 6.2.2. 3ml-5ml
- 6.2.3. 5ml-10ml
- 6.2.4. More than 10 ml
- 6.3. Market Analysis, Insights and Forecast - by Therapeutic Area
- 6.3.1. Ophthalmology
- 6.3.2. Respiratory
- 6.3.3. Neurology
- 6.3.4. Oncology
- 6.3.5. Immunology
- 6.3.6. Cardiology
- 6.3.7. Diabetes
- 6.3.8. Dental
- 6.3.9. Other Therapeutic Area
- 6.4. Market Analysis, Insights and Forecast - by End User
- 6.4.1. Pharmaceutical Companies
- 6.4.2. Biotechnology Companies
- 6.4.3. Other End Users
- 6.1. Market Analysis, Insights and Forecast - by Material
- 7. Europe Pharmaceutical Cartridges Market Analysis, Insights and Forecast, 2019-2031
- 7.1. Market Analysis, Insights and Forecast - by Material
- 7.1.1. Glass
- 7.1.2. Plastic
- 7.1.3. Rubber
- 7.2. Market Analysis, Insights and Forecast - by Capacity
- 7.2.1. Less than 3ml
- 7.2.2. 3ml-5ml
- 7.2.3. 5ml-10ml
- 7.2.4. More than 10 ml
- 7.3. Market Analysis, Insights and Forecast - by Therapeutic Area
- 7.3.1. Ophthalmology
- 7.3.2. Respiratory
- 7.3.3. Neurology
- 7.3.4. Oncology
- 7.3.5. Immunology
- 7.3.6. Cardiology
- 7.3.7. Diabetes
- 7.3.8. Dental
- 7.3.9. Other Therapeutic Area
- 7.4. Market Analysis, Insights and Forecast - by End User
- 7.4.1. Pharmaceutical Companies
- 7.4.2. Biotechnology Companies
- 7.4.3. Other End Users
- 7.1. Market Analysis, Insights and Forecast - by Material
- 8. Asia Pacific Pharmaceutical Cartridges Market Analysis, Insights and Forecast, 2019-2031
- 8.1. Market Analysis, Insights and Forecast - by Material
- 8.1.1. Glass
- 8.1.2. Plastic
- 8.1.3. Rubber
- 8.2. Market Analysis, Insights and Forecast - by Capacity
- 8.2.1. Less than 3ml
- 8.2.2. 3ml-5ml
- 8.2.3. 5ml-10ml
- 8.2.4. More than 10 ml
- 8.3. Market Analysis, Insights and Forecast - by Therapeutic Area
- 8.3.1. Ophthalmology
- 8.3.2. Respiratory
- 8.3.3. Neurology
- 8.3.4. Oncology
- 8.3.5. Immunology
- 8.3.6. Cardiology
- 8.3.7. Diabetes
- 8.3.8. Dental
- 8.3.9. Other Therapeutic Area
- 8.4. Market Analysis, Insights and Forecast - by End User
- 8.4.1. Pharmaceutical Companies
- 8.4.2. Biotechnology Companies
- 8.4.3. Other End Users
- 8.1. Market Analysis, Insights and Forecast - by Material
- 9. Middle East and Africa Pharmaceutical Cartridges Market Analysis, Insights and Forecast, 2019-2031
- 9.1. Market Analysis, Insights and Forecast - by Material
- 9.1.1. Glass
- 9.1.2. Plastic
- 9.1.3. Rubber
- 9.2. Market Analysis, Insights and Forecast - by Capacity
- 9.2.1. Less than 3ml
- 9.2.2. 3ml-5ml
- 9.2.3. 5ml-10ml
- 9.2.4. More than 10 ml
- 9.3. Market Analysis, Insights and Forecast - by Therapeutic Area
- 9.3.1. Ophthalmology
- 9.3.2. Respiratory
- 9.3.3. Neurology
- 9.3.4. Oncology
- 9.3.5. Immunology
- 9.3.6. Cardiology
- 9.3.7. Diabetes
- 9.3.8. Dental
- 9.3.9. Other Therapeutic Area
- 9.4. Market Analysis, Insights and Forecast - by End User
- 9.4.1. Pharmaceutical Companies
- 9.4.2. Biotechnology Companies
- 9.4.3. Other End Users
- 9.1. Market Analysis, Insights and Forecast - by Material
- 10. South America Pharmaceutical Cartridges Market Analysis, Insights and Forecast, 2019-2031
- 10.1. Market Analysis, Insights and Forecast - by Material
- 10.1.1. Glass
- 10.1.2. Plastic
- 10.1.3. Rubber
- 10.2. Market Analysis, Insights and Forecast - by Capacity
- 10.2.1. Less than 3ml
- 10.2.2. 3ml-5ml
- 10.2.3. 5ml-10ml
- 10.2.4. More than 10 ml
- 10.3. Market Analysis, Insights and Forecast - by Therapeutic Area
- 10.3.1. Ophthalmology
- 10.3.2. Respiratory
- 10.3.3. Neurology
- 10.3.4. Oncology
- 10.3.5. Immunology
- 10.3.6. Cardiology
- 10.3.7. Diabetes
- 10.3.8. Dental
- 10.3.9. Other Therapeutic Area
- 10.4. Market Analysis, Insights and Forecast - by End User
- 10.4.1. Pharmaceutical Companies
- 10.4.2. Biotechnology Companies
- 10.4.3. Other End Users
- 10.1. Market Analysis, Insights and Forecast - by Material
- 11. North America Pharmaceutical Cartridges Market Analysis, Insights and Forecast, 2019-2031
- 11.1. Market Analysis, Insights and Forecast - By Country/Sub-region
- 11.1.1 United States
- 11.1.2 Canada
- 11.1.3 Mexico
- 12. Europe Pharmaceutical Cartridges Market Analysis, Insights and Forecast, 2019-2031
- 12.1. Market Analysis, Insights and Forecast - By Country/Sub-region
- 12.1.1 Germany
- 12.1.2 United Kingdom
- 12.1.3 France
- 12.1.4 Italy
- 12.1.5 Spain
- 12.1.6 Rest of Europe
- 13. Asia Pacific Pharmaceutical Cartridges Market Analysis, Insights and Forecast, 2019-2031
- 13.1. Market Analysis, Insights and Forecast - By Country/Sub-region
- 13.1.1 China
- 13.1.2 Japan
- 13.1.3 India
- 13.1.4 Australia
- 13.1.5 South Korea
- 13.1.6 Rest of Asia Pacific
- 14. Middle East and Africa Pharmaceutical Cartridges Market Analysis, Insights and Forecast, 2019-2031
- 14.1. Market Analysis, Insights and Forecast - By Country/Sub-region
- 14.1.1 GCC
- 14.1.2 South Africa
- 14.1.3 Rest of Middle East and Africa
- 15. South America Pharmaceutical Cartridges Market Analysis, Insights and Forecast, 2019-2031
- 15.1. Market Analysis, Insights and Forecast - By Country/Sub-region
- 15.1.1 Brazil
- 15.1.2 Argentina
- 15.1.3 Rest of South America
- 16. Competitive Analysis
- 16.1. Global Market Share Analysis 2024
- 16.2. Company Profiles
- 16.2.1 West Pharmaceutical Services Inc
- 16.2.1.1. Overview
- 16.2.1.2. Products
- 16.2.1.3. SWOT Analysis
- 16.2.1.4. Recent Developments
- 16.2.1.5. Financials (Based on Availability)
- 16.2.2 Kel India Filters
- 16.2.2.1. Overview
- 16.2.2.2. Products
- 16.2.2.3. SWOT Analysis
- 16.2.2.4. Recent Developments
- 16.2.2.5. Financials (Based on Availability)
- 16.2.3 Merck KGaA
- 16.2.3.1. Overview
- 16.2.3.2. Products
- 16.2.3.3. SWOT Analysis
- 16.2.3.4. Recent Developments
- 16.2.3.5. Financials (Based on Availability)
- 16.2.4 Schott AG
- 16.2.4.1. Overview
- 16.2.4.2. Products
- 16.2.4.3. SWOT Analysis
- 16.2.4.4. Recent Developments
- 16.2.4.5. Financials (Based on Availability)
- 16.2.5 Kalbag Filters Pvt
- 16.2.5.1. Overview
- 16.2.5.2. Products
- 16.2.5.3. SWOT Analysis
- 16.2.5.4. Recent Developments
- 16.2.5.5. Financials (Based on Availability)
- 16.2.6 Nipro Corporation
- 16.2.6.1. Overview
- 16.2.6.2. Products
- 16.2.6.3. SWOT Analysis
- 16.2.6.4. Recent Developments
- 16.2.6.5. Financials (Based on Availability)
- 16.2.7 AptarGroup Inc
- 16.2.7.1. Overview
- 16.2.7.2. Products
- 16.2.7.3. SWOT Analysis
- 16.2.7.4. Recent Developments
- 16.2.7.5. Financials (Based on Availability)
- 16.2.8 Shandong Province Medicinal Glass Co Ltd
- 16.2.8.1. Overview
- 16.2.8.2. Products
- 16.2.8.3. SWOT Analysis
- 16.2.8.4. Recent Developments
- 16.2.8.5. Financials (Based on Availability)
- 16.2.9 Stevanato Group
- 16.2.9.1. Overview
- 16.2.9.2. Products
- 16.2.9.3. SWOT Analysis
- 16.2.9.4. Recent Developments
- 16.2.9.5. Financials (Based on Availability)
- 16.2.10 Transcoject GmbH
- 16.2.10.1. Overview
- 16.2.10.2. Products
- 16.2.10.3. SWOT Analysis
- 16.2.10.4. Recent Developments
- 16.2.10.5. Financials (Based on Availability)
- 16.2.11 Datwyler Holding Inc
- 16.2.11.1. Overview
- 16.2.11.2. Products
- 16.2.11.3. SWOT Analysis
- 16.2.11.4. Recent Developments
- 16.2.11.5. Financials (Based on Availability)
- 16.2.12 Gerresheimer AG
- 16.2.12.1. Overview
- 16.2.12.2. Products
- 16.2.12.3. SWOT Analysis
- 16.2.12.4. Recent Developments
- 16.2.12.5. Financials (Based on Availability)
- 16.2.1 West Pharmaceutical Services Inc
List of Figures
- Figure 1: Global Pharmaceutical Cartridges Market Revenue Breakdown (Million, %) by Region 2024 & 2032
- Figure 2: Global Pharmaceutical Cartridges Market Volume Breakdown (K Unit, %) by Region 2024 & 2032
- Figure 3: North America Pharmaceutical Cartridges Market Revenue (Million), by Country 2024 & 2032
- Figure 4: North America Pharmaceutical Cartridges Market Volume (K Unit), by Country 2024 & 2032
- Figure 5: North America Pharmaceutical Cartridges Market Revenue Share (%), by Country 2024 & 2032
- Figure 6: North America Pharmaceutical Cartridges Market Volume Share (%), by Country 2024 & 2032
- Figure 7: Europe Pharmaceutical Cartridges Market Revenue (Million), by Country 2024 & 2032
- Figure 8: Europe Pharmaceutical Cartridges Market Volume (K Unit), by Country 2024 & 2032
- Figure 9: Europe Pharmaceutical Cartridges Market Revenue Share (%), by Country 2024 & 2032
- Figure 10: Europe Pharmaceutical Cartridges Market Volume Share (%), by Country 2024 & 2032
- Figure 11: Asia Pacific Pharmaceutical Cartridges Market Revenue (Million), by Country 2024 & 2032
- Figure 12: Asia Pacific Pharmaceutical Cartridges Market Volume (K Unit), by Country 2024 & 2032
- Figure 13: Asia Pacific Pharmaceutical Cartridges Market Revenue Share (%), by Country 2024 & 2032
- Figure 14: Asia Pacific Pharmaceutical Cartridges Market Volume Share (%), by Country 2024 & 2032
- Figure 15: Middle East and Africa Pharmaceutical Cartridges Market Revenue (Million), by Country 2024 & 2032
- Figure 16: Middle East and Africa Pharmaceutical Cartridges Market Volume (K Unit), by Country 2024 & 2032
- Figure 17: Middle East and Africa Pharmaceutical Cartridges Market Revenue Share (%), by Country 2024 & 2032
- Figure 18: Middle East and Africa Pharmaceutical Cartridges Market Volume Share (%), by Country 2024 & 2032
- Figure 19: South America Pharmaceutical Cartridges Market Revenue (Million), by Country 2024 & 2032
- Figure 20: South America Pharmaceutical Cartridges Market Volume (K Unit), by Country 2024 & 2032
- Figure 21: South America Pharmaceutical Cartridges Market Revenue Share (%), by Country 2024 & 2032
- Figure 22: South America Pharmaceutical Cartridges Market Volume Share (%), by Country 2024 & 2032
- Figure 23: North America Pharmaceutical Cartridges Market Revenue (Million), by Material 2024 & 2032
- Figure 24: North America Pharmaceutical Cartridges Market Volume (K Unit), by Material 2024 & 2032
- Figure 25: North America Pharmaceutical Cartridges Market Revenue Share (%), by Material 2024 & 2032
- Figure 26: North America Pharmaceutical Cartridges Market Volume Share (%), by Material 2024 & 2032
- Figure 27: North America Pharmaceutical Cartridges Market Revenue (Million), by Capacity 2024 & 2032
- Figure 28: North America Pharmaceutical Cartridges Market Volume (K Unit), by Capacity 2024 & 2032
- Figure 29: North America Pharmaceutical Cartridges Market Revenue Share (%), by Capacity 2024 & 2032
- Figure 30: North America Pharmaceutical Cartridges Market Volume Share (%), by Capacity 2024 & 2032
- Figure 31: North America Pharmaceutical Cartridges Market Revenue (Million), by Therapeutic Area 2024 & 2032
- Figure 32: North America Pharmaceutical Cartridges Market Volume (K Unit), by Therapeutic Area 2024 & 2032
- Figure 33: North America Pharmaceutical Cartridges Market Revenue Share (%), by Therapeutic Area 2024 & 2032
- Figure 34: North America Pharmaceutical Cartridges Market Volume Share (%), by Therapeutic Area 2024 & 2032
- Figure 35: North America Pharmaceutical Cartridges Market Revenue (Million), by End User 2024 & 2032
- Figure 36: North America Pharmaceutical Cartridges Market Volume (K Unit), by End User 2024 & 2032
- Figure 37: North America Pharmaceutical Cartridges Market Revenue Share (%), by End User 2024 & 2032
- Figure 38: North America Pharmaceutical Cartridges Market Volume Share (%), by End User 2024 & 2032
- Figure 39: North America Pharmaceutical Cartridges Market Revenue (Million), by Country 2024 & 2032
- Figure 40: North America Pharmaceutical Cartridges Market Volume (K Unit), by Country 2024 & 2032
- Figure 41: North America Pharmaceutical Cartridges Market Revenue Share (%), by Country 2024 & 2032
- Figure 42: North America Pharmaceutical Cartridges Market Volume Share (%), by Country 2024 & 2032
- Figure 43: Europe Pharmaceutical Cartridges Market Revenue (Million), by Material 2024 & 2032
- Figure 44: Europe Pharmaceutical Cartridges Market Volume (K Unit), by Material 2024 & 2032
- Figure 45: Europe Pharmaceutical Cartridges Market Revenue Share (%), by Material 2024 & 2032
- Figure 46: Europe Pharmaceutical Cartridges Market Volume Share (%), by Material 2024 & 2032
- Figure 47: Europe Pharmaceutical Cartridges Market Revenue (Million), by Capacity 2024 & 2032
- Figure 48: Europe Pharmaceutical Cartridges Market Volume (K Unit), by Capacity 2024 & 2032
- Figure 49: Europe Pharmaceutical Cartridges Market Revenue Share (%), by Capacity 2024 & 2032
- Figure 50: Europe Pharmaceutical Cartridges Market Volume Share (%), by Capacity 2024 & 2032
- Figure 51: Europe Pharmaceutical Cartridges Market Revenue (Million), by Therapeutic Area 2024 & 2032
- Figure 52: Europe Pharmaceutical Cartridges Market Volume (K Unit), by Therapeutic Area 2024 & 2032
- Figure 53: Europe Pharmaceutical Cartridges Market Revenue Share (%), by Therapeutic Area 2024 & 2032
- Figure 54: Europe Pharmaceutical Cartridges Market Volume Share (%), by Therapeutic Area 2024 & 2032
- Figure 55: Europe Pharmaceutical Cartridges Market Revenue (Million), by End User 2024 & 2032
- Figure 56: Europe Pharmaceutical Cartridges Market Volume (K Unit), by End User 2024 & 2032
- Figure 57: Europe Pharmaceutical Cartridges Market Revenue Share (%), by End User 2024 & 2032
- Figure 58: Europe Pharmaceutical Cartridges Market Volume Share (%), by End User 2024 & 2032
- Figure 59: Europe Pharmaceutical Cartridges Market Revenue (Million), by Country 2024 & 2032
- Figure 60: Europe Pharmaceutical Cartridges Market Volume (K Unit), by Country 2024 & 2032
- Figure 61: Europe Pharmaceutical Cartridges Market Revenue Share (%), by Country 2024 & 2032
- Figure 62: Europe Pharmaceutical Cartridges Market Volume Share (%), by Country 2024 & 2032
- Figure 63: Asia Pacific Pharmaceutical Cartridges Market Revenue (Million), by Material 2024 & 2032
- Figure 64: Asia Pacific Pharmaceutical Cartridges Market Volume (K Unit), by Material 2024 & 2032
- Figure 65: Asia Pacific Pharmaceutical Cartridges Market Revenue Share (%), by Material 2024 & 2032
- Figure 66: Asia Pacific Pharmaceutical Cartridges Market Volume Share (%), by Material 2024 & 2032
- Figure 67: Asia Pacific Pharmaceutical Cartridges Market Revenue (Million), by Capacity 2024 & 2032
- Figure 68: Asia Pacific Pharmaceutical Cartridges Market Volume (K Unit), by Capacity 2024 & 2032
- Figure 69: Asia Pacific Pharmaceutical Cartridges Market Revenue Share (%), by Capacity 2024 & 2032
- Figure 70: Asia Pacific Pharmaceutical Cartridges Market Volume Share (%), by Capacity 2024 & 2032
- Figure 71: Asia Pacific Pharmaceutical Cartridges Market Revenue (Million), by Therapeutic Area 2024 & 2032
- Figure 72: Asia Pacific Pharmaceutical Cartridges Market Volume (K Unit), by Therapeutic Area 2024 & 2032
- Figure 73: Asia Pacific Pharmaceutical Cartridges Market Revenue Share (%), by Therapeutic Area 2024 & 2032
- Figure 74: Asia Pacific Pharmaceutical Cartridges Market Volume Share (%), by Therapeutic Area 2024 & 2032
- Figure 75: Asia Pacific Pharmaceutical Cartridges Market Revenue (Million), by End User 2024 & 2032
- Figure 76: Asia Pacific Pharmaceutical Cartridges Market Volume (K Unit), by End User 2024 & 2032
- Figure 77: Asia Pacific Pharmaceutical Cartridges Market Revenue Share (%), by End User 2024 & 2032
- Figure 78: Asia Pacific Pharmaceutical Cartridges Market Volume Share (%), by End User 2024 & 2032
- Figure 79: Asia Pacific Pharmaceutical Cartridges Market Revenue (Million), by Country 2024 & 2032
- Figure 80: Asia Pacific Pharmaceutical Cartridges Market Volume (K Unit), by Country 2024 & 2032
- Figure 81: Asia Pacific Pharmaceutical Cartridges Market Revenue Share (%), by Country 2024 & 2032
- Figure 82: Asia Pacific Pharmaceutical Cartridges Market Volume Share (%), by Country 2024 & 2032
- Figure 83: Middle East and Africa Pharmaceutical Cartridges Market Revenue (Million), by Material 2024 & 2032
- Figure 84: Middle East and Africa Pharmaceutical Cartridges Market Volume (K Unit), by Material 2024 & 2032
- Figure 85: Middle East and Africa Pharmaceutical Cartridges Market Revenue Share (%), by Material 2024 & 2032
- Figure 86: Middle East and Africa Pharmaceutical Cartridges Market Volume Share (%), by Material 2024 & 2032
- Figure 87: Middle East and Africa Pharmaceutical Cartridges Market Revenue (Million), by Capacity 2024 & 2032
- Figure 88: Middle East and Africa Pharmaceutical Cartridges Market Volume (K Unit), by Capacity 2024 & 2032
- Figure 89: Middle East and Africa Pharmaceutical Cartridges Market Revenue Share (%), by Capacity 2024 & 2032
- Figure 90: Middle East and Africa Pharmaceutical Cartridges Market Volume Share (%), by Capacity 2024 & 2032
- Figure 91: Middle East and Africa Pharmaceutical Cartridges Market Revenue (Million), by Therapeutic Area 2024 & 2032
- Figure 92: Middle East and Africa Pharmaceutical Cartridges Market Volume (K Unit), by Therapeutic Area 2024 & 2032
- Figure 93: Middle East and Africa Pharmaceutical Cartridges Market Revenue Share (%), by Therapeutic Area 2024 & 2032
- Figure 94: Middle East and Africa Pharmaceutical Cartridges Market Volume Share (%), by Therapeutic Area 2024 & 2032
- Figure 95: Middle East and Africa Pharmaceutical Cartridges Market Revenue (Million), by End User 2024 & 2032
- Figure 96: Middle East and Africa Pharmaceutical Cartridges Market Volume (K Unit), by End User 2024 & 2032
- Figure 97: Middle East and Africa Pharmaceutical Cartridges Market Revenue Share (%), by End User 2024 & 2032
- Figure 98: Middle East and Africa Pharmaceutical Cartridges Market Volume Share (%), by End User 2024 & 2032
- Figure 99: Middle East and Africa Pharmaceutical Cartridges Market Revenue (Million), by Country 2024 & 2032
- Figure 100: Middle East and Africa Pharmaceutical Cartridges Market Volume (K Unit), by Country 2024 & 2032
- Figure 101: Middle East and Africa Pharmaceutical Cartridges Market Revenue Share (%), by Country 2024 & 2032
- Figure 102: Middle East and Africa Pharmaceutical Cartridges Market Volume Share (%), by Country 2024 & 2032
- Figure 103: South America Pharmaceutical Cartridges Market Revenue (Million), by Material 2024 & 2032
- Figure 104: South America Pharmaceutical Cartridges Market Volume (K Unit), by Material 2024 & 2032
- Figure 105: South America Pharmaceutical Cartridges Market Revenue Share (%), by Material 2024 & 2032
- Figure 106: South America Pharmaceutical Cartridges Market Volume Share (%), by Material 2024 & 2032
- Figure 107: South America Pharmaceutical Cartridges Market Revenue (Million), by Capacity 2024 & 2032
- Figure 108: South America Pharmaceutical Cartridges Market Volume (K Unit), by Capacity 2024 & 2032
- Figure 109: South America Pharmaceutical Cartridges Market Revenue Share (%), by Capacity 2024 & 2032
- Figure 110: South America Pharmaceutical Cartridges Market Volume Share (%), by Capacity 2024 & 2032
- Figure 111: South America Pharmaceutical Cartridges Market Revenue (Million), by Therapeutic Area 2024 & 2032
- Figure 112: South America Pharmaceutical Cartridges Market Volume (K Unit), by Therapeutic Area 2024 & 2032
- Figure 113: South America Pharmaceutical Cartridges Market Revenue Share (%), by Therapeutic Area 2024 & 2032
- Figure 114: South America Pharmaceutical Cartridges Market Volume Share (%), by Therapeutic Area 2024 & 2032
- Figure 115: South America Pharmaceutical Cartridges Market Revenue (Million), by End User 2024 & 2032
- Figure 116: South America Pharmaceutical Cartridges Market Volume (K Unit), by End User 2024 & 2032
- Figure 117: South America Pharmaceutical Cartridges Market Revenue Share (%), by End User 2024 & 2032
- Figure 118: South America Pharmaceutical Cartridges Market Volume Share (%), by End User 2024 & 2032
- Figure 119: South America Pharmaceutical Cartridges Market Revenue (Million), by Country 2024 & 2032
- Figure 120: South America Pharmaceutical Cartridges Market Volume (K Unit), by Country 2024 & 2032
- Figure 121: South America Pharmaceutical Cartridges Market Revenue Share (%), by Country 2024 & 2032
- Figure 122: South America Pharmaceutical Cartridges Market Volume Share (%), by Country 2024 & 2032
List of Tables
- Table 1: Global Pharmaceutical Cartridges Market Revenue Million Forecast, by Region 2019 & 2032
- Table 2: Global Pharmaceutical Cartridges Market Volume K Unit Forecast, by Region 2019 & 2032
- Table 3: Global Pharmaceutical Cartridges Market Revenue Million Forecast, by Material 2019 & 2032
- Table 4: Global Pharmaceutical Cartridges Market Volume K Unit Forecast, by Material 2019 & 2032
- Table 5: Global Pharmaceutical Cartridges Market Revenue Million Forecast, by Capacity 2019 & 2032
- Table 6: Global Pharmaceutical Cartridges Market Volume K Unit Forecast, by Capacity 2019 & 2032
- Table 7: Global Pharmaceutical Cartridges Market Revenue Million Forecast, by Therapeutic Area 2019 & 2032
- Table 8: Global Pharmaceutical Cartridges Market Volume K Unit Forecast, by Therapeutic Area 2019 & 2032
- Table 9: Global Pharmaceutical Cartridges Market Revenue Million Forecast, by End User 2019 & 2032
- Table 10: Global Pharmaceutical Cartridges Market Volume K Unit Forecast, by End User 2019 & 2032
- Table 11: Global Pharmaceutical Cartridges Market Revenue Million Forecast, by Region 2019 & 2032
- Table 12: Global Pharmaceutical Cartridges Market Volume K Unit Forecast, by Region 2019 & 2032
- Table 13: Global Pharmaceutical Cartridges Market Revenue Million Forecast, by Country 2019 & 2032
- Table 14: Global Pharmaceutical Cartridges Market Volume K Unit Forecast, by Country 2019 & 2032
- Table 15: United States Pharmaceutical Cartridges Market Revenue (Million) Forecast, by Application 2019 & 2032
- Table 16: United States Pharmaceutical Cartridges Market Volume (K Unit) Forecast, by Application 2019 & 2032
- Table 17: Canada Pharmaceutical Cartridges Market Revenue (Million) Forecast, by Application 2019 & 2032
- Table 18: Canada Pharmaceutical Cartridges Market Volume (K Unit) Forecast, by Application 2019 & 2032
- Table 19: Mexico Pharmaceutical Cartridges Market Revenue (Million) Forecast, by Application 2019 & 2032
- Table 20: Mexico Pharmaceutical Cartridges Market Volume (K Unit) Forecast, by Application 2019 & 2032
- Table 21: Global Pharmaceutical Cartridges Market Revenue Million Forecast, by Country 2019 & 2032
- Table 22: Global Pharmaceutical Cartridges Market Volume K Unit Forecast, by Country 2019 & 2032
- Table 23: Germany Pharmaceutical Cartridges Market Revenue (Million) Forecast, by Application 2019 & 2032
- Table 24: Germany Pharmaceutical Cartridges Market Volume (K Unit) Forecast, by Application 2019 & 2032
- Table 25: United Kingdom Pharmaceutical Cartridges Market Revenue (Million) Forecast, by Application 2019 & 2032
- Table 26: United Kingdom Pharmaceutical Cartridges Market Volume (K Unit) Forecast, by Application 2019 & 2032
- Table 27: France Pharmaceutical Cartridges Market Revenue (Million) Forecast, by Application 2019 & 2032
- Table 28: France Pharmaceutical Cartridges Market Volume (K Unit) Forecast, by Application 2019 & 2032
- Table 29: Italy Pharmaceutical Cartridges Market Revenue (Million) Forecast, by Application 2019 & 2032
- Table 30: Italy Pharmaceutical Cartridges Market Volume (K Unit) Forecast, by Application 2019 & 2032
- Table 31: Spain Pharmaceutical Cartridges Market Revenue (Million) Forecast, by Application 2019 & 2032
- Table 32: Spain Pharmaceutical Cartridges Market Volume (K Unit) Forecast, by Application 2019 & 2032
- Table 33: Rest of Europe Pharmaceutical Cartridges Market Revenue (Million) Forecast, by Application 2019 & 2032
- Table 34: Rest of Europe Pharmaceutical Cartridges Market Volume (K Unit) Forecast, by Application 2019 & 2032
- Table 35: Global Pharmaceutical Cartridges Market Revenue Million Forecast, by Country 2019 & 2032
- Table 36: Global Pharmaceutical Cartridges Market Volume K Unit Forecast, by Country 2019 & 2032
- Table 37: China Pharmaceutical Cartridges Market Revenue (Million) Forecast, by Application 2019 & 2032
- Table 38: China Pharmaceutical Cartridges Market Volume (K Unit) Forecast, by Application 2019 & 2032
- Table 39: Japan Pharmaceutical Cartridges Market Revenue (Million) Forecast, by Application 2019 & 2032
- Table 40: Japan Pharmaceutical Cartridges Market Volume (K Unit) Forecast, by Application 2019 & 2032
- Table 41: India Pharmaceutical Cartridges Market Revenue (Million) Forecast, by Application 2019 & 2032
- Table 42: India Pharmaceutical Cartridges Market Volume (K Unit) Forecast, by Application 2019 & 2032
- Table 43: Australia Pharmaceutical Cartridges Market Revenue (Million) Forecast, by Application 2019 & 2032
- Table 44: Australia Pharmaceutical Cartridges Market Volume (K Unit) Forecast, by Application 2019 & 2032
- Table 45: South Korea Pharmaceutical Cartridges Market Revenue (Million) Forecast, by Application 2019 & 2032
- Table 46: South Korea Pharmaceutical Cartridges Market Volume (K Unit) Forecast, by Application 2019 & 2032
- Table 47: Rest of Asia Pacific Pharmaceutical Cartridges Market Revenue (Million) Forecast, by Application 2019 & 2032
- Table 48: Rest of Asia Pacific Pharmaceutical Cartridges Market Volume (K Unit) Forecast, by Application 2019 & 2032
- Table 49: Global Pharmaceutical Cartridges Market Revenue Million Forecast, by Country 2019 & 2032
- Table 50: Global Pharmaceutical Cartridges Market Volume K Unit Forecast, by Country 2019 & 2032
- Table 51: GCC Pharmaceutical Cartridges Market Revenue (Million) Forecast, by Application 2019 & 2032
- Table 52: GCC Pharmaceutical Cartridges Market Volume (K Unit) Forecast, by Application 2019 & 2032
- Table 53: South Africa Pharmaceutical Cartridges Market Revenue (Million) Forecast, by Application 2019 & 2032
- Table 54: South Africa Pharmaceutical Cartridges Market Volume (K Unit) Forecast, by Application 2019 & 2032
- Table 55: Rest of Middle East and Africa Pharmaceutical Cartridges Market Revenue (Million) Forecast, by Application 2019 & 2032
- Table 56: Rest of Middle East and Africa Pharmaceutical Cartridges Market Volume (K Unit) Forecast, by Application 2019 & 2032
- Table 57: Global Pharmaceutical Cartridges Market Revenue Million Forecast, by Country 2019 & 2032
- Table 58: Global Pharmaceutical Cartridges Market Volume K Unit Forecast, by Country 2019 & 2032
- Table 59: Brazil Pharmaceutical Cartridges Market Revenue (Million) Forecast, by Application 2019 & 2032
- Table 60: Brazil Pharmaceutical Cartridges Market Volume (K Unit) Forecast, by Application 2019 & 2032
- Table 61: Argentina Pharmaceutical Cartridges Market Revenue (Million) Forecast, by Application 2019 & 2032
- Table 62: Argentina Pharmaceutical Cartridges Market Volume (K Unit) Forecast, by Application 2019 & 2032
- Table 63: Rest of South America Pharmaceutical Cartridges Market Revenue (Million) Forecast, by Application 2019 & 2032
- Table 64: Rest of South America Pharmaceutical Cartridges Market Volume (K Unit) Forecast, by Application 2019 & 2032
- Table 65: Global Pharmaceutical Cartridges Market Revenue Million Forecast, by Material 2019 & 2032
- Table 66: Global Pharmaceutical Cartridges Market Volume K Unit Forecast, by Material 2019 & 2032
- Table 67: Global Pharmaceutical Cartridges Market Revenue Million Forecast, by Capacity 2019 & 2032
- Table 68: Global Pharmaceutical Cartridges Market Volume K Unit Forecast, by Capacity 2019 & 2032
- Table 69: Global Pharmaceutical Cartridges Market Revenue Million Forecast, by Therapeutic Area 2019 & 2032
- Table 70: Global Pharmaceutical Cartridges Market Volume K Unit Forecast, by Therapeutic Area 2019 & 2032
- Table 71: Global Pharmaceutical Cartridges Market Revenue Million Forecast, by End User 2019 & 2032
- Table 72: Global Pharmaceutical Cartridges Market Volume K Unit Forecast, by End User 2019 & 2032
- Table 73: Global Pharmaceutical Cartridges Market Revenue Million Forecast, by Country 2019 & 2032
- Table 74: Global Pharmaceutical Cartridges Market Volume K Unit Forecast, by Country 2019 & 2032
- Table 75: United States Pharmaceutical Cartridges Market Revenue (Million) Forecast, by Application 2019 & 2032
- Table 76: United States Pharmaceutical Cartridges Market Volume (K Unit) Forecast, by Application 2019 & 2032
- Table 77: Canada Pharmaceutical Cartridges Market Revenue (Million) Forecast, by Application 2019 & 2032
- Table 78: Canada Pharmaceutical Cartridges Market Volume (K Unit) Forecast, by Application 2019 & 2032
- Table 79: Mexico Pharmaceutical Cartridges Market Revenue (Million) Forecast, by Application 2019 & 2032
- Table 80: Mexico Pharmaceutical Cartridges Market Volume (K Unit) Forecast, by Application 2019 & 2032
- Table 81: Global Pharmaceutical Cartridges Market Revenue Million Forecast, by Material 2019 & 2032
- Table 82: Global Pharmaceutical Cartridges Market Volume K Unit Forecast, by Material 2019 & 2032
- Table 83: Global Pharmaceutical Cartridges Market Revenue Million Forecast, by Capacity 2019 & 2032
- Table 84: Global Pharmaceutical Cartridges Market Volume K Unit Forecast, by Capacity 2019 & 2032
- Table 85: Global Pharmaceutical Cartridges Market Revenue Million Forecast, by Therapeutic Area 2019 & 2032
- Table 86: Global Pharmaceutical Cartridges Market Volume K Unit Forecast, by Therapeutic Area 2019 & 2032
- Table 87: Global Pharmaceutical Cartridges Market Revenue Million Forecast, by End User 2019 & 2032
- Table 88: Global Pharmaceutical Cartridges Market Volume K Unit Forecast, by End User 2019 & 2032
- Table 89: Global Pharmaceutical Cartridges Market Revenue Million Forecast, by Country 2019 & 2032
- Table 90: Global Pharmaceutical Cartridges Market Volume K Unit Forecast, by Country 2019 & 2032
- Table 91: Germany Pharmaceutical Cartridges Market Revenue (Million) Forecast, by Application 2019 & 2032
- Table 92: Germany Pharmaceutical Cartridges Market Volume (K Unit) Forecast, by Application 2019 & 2032
- Table 93: United Kingdom Pharmaceutical Cartridges Market Revenue (Million) Forecast, by Application 2019 & 2032
- Table 94: United Kingdom Pharmaceutical Cartridges Market Volume (K Unit) Forecast, by Application 2019 & 2032
- Table 95: France Pharmaceutical Cartridges Market Revenue (Million) Forecast, by Application 2019 & 2032
- Table 96: France Pharmaceutical Cartridges Market Volume (K Unit) Forecast, by Application 2019 & 2032
- Table 97: Italy Pharmaceutical Cartridges Market Revenue (Million) Forecast, by Application 2019 & 2032
- Table 98: Italy Pharmaceutical Cartridges Market Volume (K Unit) Forecast, by Application 2019 & 2032
- Table 99: Spain Pharmaceutical Cartridges Market Revenue (Million) Forecast, by Application 2019 & 2032
- Table 100: Spain Pharmaceutical Cartridges Market Volume (K Unit) Forecast, by Application 2019 & 2032
- Table 101: Rest of Europe Pharmaceutical Cartridges Market Revenue (Million) Forecast, by Application 2019 & 2032
- Table 102: Rest of Europe Pharmaceutical Cartridges Market Volume (K Unit) Forecast, by Application 2019 & 2032
- Table 103: Global Pharmaceutical Cartridges Market Revenue Million Forecast, by Material 2019 & 2032
- Table 104: Global Pharmaceutical Cartridges Market Volume K Unit Forecast, by Material 2019 & 2032
- Table 105: Global Pharmaceutical Cartridges Market Revenue Million Forecast, by Capacity 2019 & 2032
- Table 106: Global Pharmaceutical Cartridges Market Volume K Unit Forecast, by Capacity 2019 & 2032
- Table 107: Global Pharmaceutical Cartridges Market Revenue Million Forecast, by Therapeutic Area 2019 & 2032
- Table 108: Global Pharmaceutical Cartridges Market Volume K Unit Forecast, by Therapeutic Area 2019 & 2032
- Table 109: Global Pharmaceutical Cartridges Market Revenue Million Forecast, by End User 2019 & 2032
- Table 110: Global Pharmaceutical Cartridges Market Volume K Unit Forecast, by End User 2019 & 2032
- Table 111: Global Pharmaceutical Cartridges Market Revenue Million Forecast, by Country 2019 & 2032
- Table 112: Global Pharmaceutical Cartridges Market Volume K Unit Forecast, by Country 2019 & 2032
- Table 113: China Pharmaceutical Cartridges Market Revenue (Million) Forecast, by Application 2019 & 2032
- Table 114: China Pharmaceutical Cartridges Market Volume (K Unit) Forecast, by Application 2019 & 2032
- Table 115: Japan Pharmaceutical Cartridges Market Revenue (Million) Forecast, by Application 2019 & 2032
- Table 116: Japan Pharmaceutical Cartridges Market Volume (K Unit) Forecast, by Application 2019 & 2032
- Table 117: India Pharmaceutical Cartridges Market Revenue (Million) Forecast, by Application 2019 & 2032
- Table 118: India Pharmaceutical Cartridges Market Volume (K Unit) Forecast, by Application 2019 & 2032
- Table 119: Australia Pharmaceutical Cartridges Market Revenue (Million) Forecast, by Application 2019 & 2032
- Table 120: Australia Pharmaceutical Cartridges Market Volume (K Unit) Forecast, by Application 2019 & 2032
- Table 121: South Korea Pharmaceutical Cartridges Market Revenue (Million) Forecast, by Application 2019 & 2032
- Table 122: South Korea Pharmaceutical Cartridges Market Volume (K Unit) Forecast, by Application 2019 & 2032
- Table 123: Rest of Asia Pacific Pharmaceutical Cartridges Market Revenue (Million) Forecast, by Application 2019 & 2032
- Table 124: Rest of Asia Pacific Pharmaceutical Cartridges Market Volume (K Unit) Forecast, by Application 2019 & 2032
- Table 125: Global Pharmaceutical Cartridges Market Revenue Million Forecast, by Material 2019 & 2032
- Table 126: Global Pharmaceutical Cartridges Market Volume K Unit Forecast, by Material 2019 & 2032
- Table 127: Global Pharmaceutical Cartridges Market Revenue Million Forecast, by Capacity 2019 & 2032
- Table 128: Global Pharmaceutical Cartridges Market Volume K Unit Forecast, by Capacity 2019 & 2032
- Table 129: Global Pharmaceutical Cartridges Market Revenue Million Forecast, by Therapeutic Area 2019 & 2032
- Table 130: Global Pharmaceutical Cartridges Market Volume K Unit Forecast, by Therapeutic Area 2019 & 2032
- Table 131: Global Pharmaceutical Cartridges Market Revenue Million Forecast, by End User 2019 & 2032
- Table 132: Global Pharmaceutical Cartridges Market Volume K Unit Forecast, by End User 2019 & 2032
- Table 133: Global Pharmaceutical Cartridges Market Revenue Million Forecast, by Country 2019 & 2032
- Table 134: Global Pharmaceutical Cartridges Market Volume K Unit Forecast, by Country 2019 & 2032
- Table 135: GCC Pharmaceutical Cartridges Market Revenue (Million) Forecast, by Application 2019 & 2032
- Table 136: GCC Pharmaceutical Cartridges Market Volume (K Unit) Forecast, by Application 2019 & 2032
- Table 137: South Africa Pharmaceutical Cartridges Market Revenue (Million) Forecast, by Application 2019 & 2032
- Table 138: South Africa Pharmaceutical Cartridges Market Volume (K Unit) Forecast, by Application 2019 & 2032
- Table 139: Rest of Middle East and Africa Pharmaceutical Cartridges Market Revenue (Million) Forecast, by Application 2019 & 2032
- Table 140: Rest of Middle East and Africa Pharmaceutical Cartridges Market Volume (K Unit) Forecast, by Application 2019 & 2032
- Table 141: Global Pharmaceutical Cartridges Market Revenue Million Forecast, by Material 2019 & 2032
- Table 142: Global Pharmaceutical Cartridges Market Volume K Unit Forecast, by Material 2019 & 2032
- Table 143: Global Pharmaceutical Cartridges Market Revenue Million Forecast, by Capacity 2019 & 2032
- Table 144: Global Pharmaceutical Cartridges Market Volume K Unit Forecast, by Capacity 2019 & 2032
- Table 145: Global Pharmaceutical Cartridges Market Revenue Million Forecast, by Therapeutic Area 2019 & 2032
- Table 146: Global Pharmaceutical Cartridges Market Volume K Unit Forecast, by Therapeutic Area 2019 & 2032
- Table 147: Global Pharmaceutical Cartridges Market Revenue Million Forecast, by End User 2019 & 2032
- Table 148: Global Pharmaceutical Cartridges Market Volume K Unit Forecast, by End User 2019 & 2032
- Table 149: Global Pharmaceutical Cartridges Market Revenue Million Forecast, by Country 2019 & 2032
- Table 150: Global Pharmaceutical Cartridges Market Volume K Unit Forecast, by Country 2019 & 2032
- Table 151: Brazil Pharmaceutical Cartridges Market Revenue (Million) Forecast, by Application 2019 & 2032
- Table 152: Brazil Pharmaceutical Cartridges Market Volume (K Unit) Forecast, by Application 2019 & 2032
- Table 153: Argentina Pharmaceutical Cartridges Market Revenue (Million) Forecast, by Application 2019 & 2032
- Table 154: Argentina Pharmaceutical Cartridges Market Volume (K Unit) Forecast, by Application 2019 & 2032
- Table 155: Rest of South America Pharmaceutical Cartridges Market Revenue (Million) Forecast, by Application 2019 & 2032
- Table 156: Rest of South America Pharmaceutical Cartridges Market Volume (K Unit) Forecast, by Application 2019 & 2032
Frequently Asked Questions
1. What is the projected Compound Annual Growth Rate (CAGR) of the Pharmaceutical Cartridges Market?
The projected CAGR is approximately 7.50%.
2. Which companies are prominent players in the Pharmaceutical Cartridges Market?
Key companies in the market include West Pharmaceutical Services Inc, Kel India Filters, Merck KGaA, Schott AG, Kalbag Filters Pvt, Nipro Corporation, AptarGroup Inc, Shandong Province Medicinal Glass Co Ltd, Stevanato Group, Transcoject GmbH, Datwyler Holding Inc, Gerresheimer AG.
3. What are the main segments of the Pharmaceutical Cartridges Market?
The market segments include Material, Capacity, Therapeutic Area, End User.
4. Can you provide details about the market size?
The market size is estimated to be USD XX Million as of 2022.
5. What are some drivers contributing to market growth?
Rising Demand for Easy to Use and Convenient Pharmaceutical Packaging Solutions; Increase in R&D Spending in the Pharmaceutical Industry.
6. What are the notable trends driving market growth?
Glass Material is Expected to have Significant Market Share during the Forecast Period.
7. Are there any restraints impacting market growth?
Manufacturing Complexity and Stringent Regulatory Compliance Related to Pharmaceutical Cartridges.
8. Can you provide examples of recent developments in the market?
N/A
9. What pricing options are available for accessing the report?
Pricing options include single-user, multi-user, and enterprise licenses priced at USD 4750, USD 5250, and USD 8750 respectively.
10. Is the market size provided in terms of value or volume?
The market size is provided in terms of value, measured in Million and volume, measured in K Unit.
11. Are there any specific market keywords associated with the report?
Yes, the market keyword associated with the report is "Pharmaceutical Cartridges Market," which aids in identifying and referencing the specific market segment covered.
12. How do I determine which pricing option suits my needs best?
The pricing options vary based on user requirements and access needs. Individual users may opt for single-user licenses, while businesses requiring broader access may choose multi-user or enterprise licenses for cost-effective access to the report.
13. Are there any additional resources or data provided in the Pharmaceutical Cartridges Market report?
While the report offers comprehensive insights, it's advisable to review the specific contents or supplementary materials provided to ascertain if additional resources or data are available.
14. How can I stay updated on further developments or reports in the Pharmaceutical Cartridges Market?
To stay informed about further developments, trends, and reports in the Pharmaceutical Cartridges Market, consider subscribing to industry newsletters, following relevant companies and organizations, or regularly checking reputable industry news sources and publications.
Methodology
Step 1 - Identification of Relevant Samples Size from Population Database


Step 2 - Approaches for Defining Global Market Size (Value, Volume* & Price*)

Note*: In applicable scenarios
Step 3 - Data Sources
Primary Research
- Web Analytics
- Survey Reports
- Research Institute
- Latest Research Reports
- Opinion Leaders
Secondary Research
- Annual Reports
- White Paper
- Latest Press Release
- Industry Association
- Paid Database
- Investor Presentations

Step 4 - Data Triangulation
Involves using different sources of information in order to increase the validity of a study
These sources are likely to be stakeholders in a program - participants, other researchers, program staff, other community members, and so on.
Then we put all data in single framework & apply various statistical tools to find out the dynamic on the market.
During the analysis stage, feedback from the stakeholder groups would be compared to determine areas of agreement as well as areas of divergence


