
Key Insights
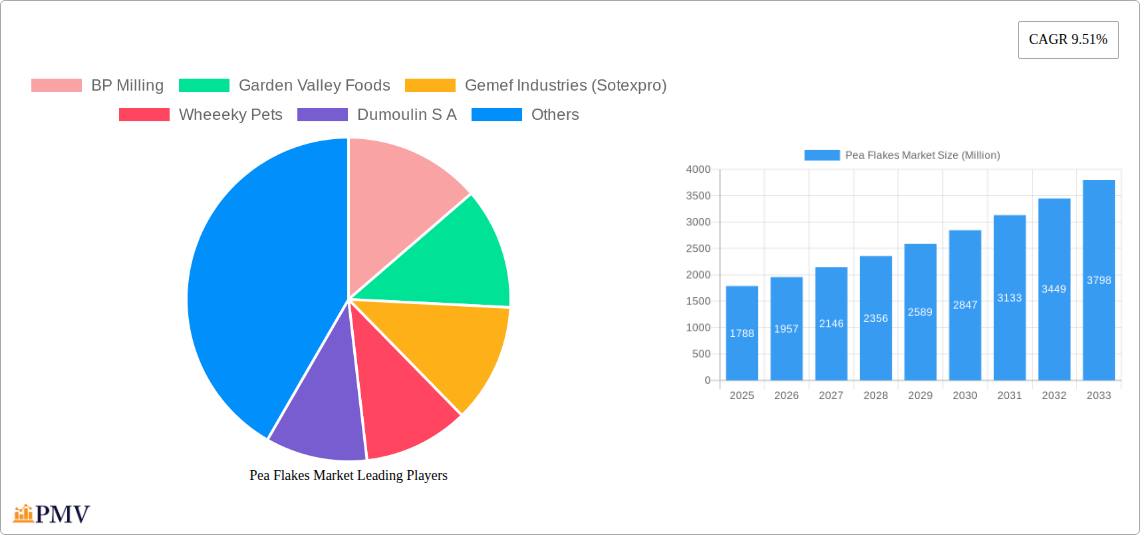
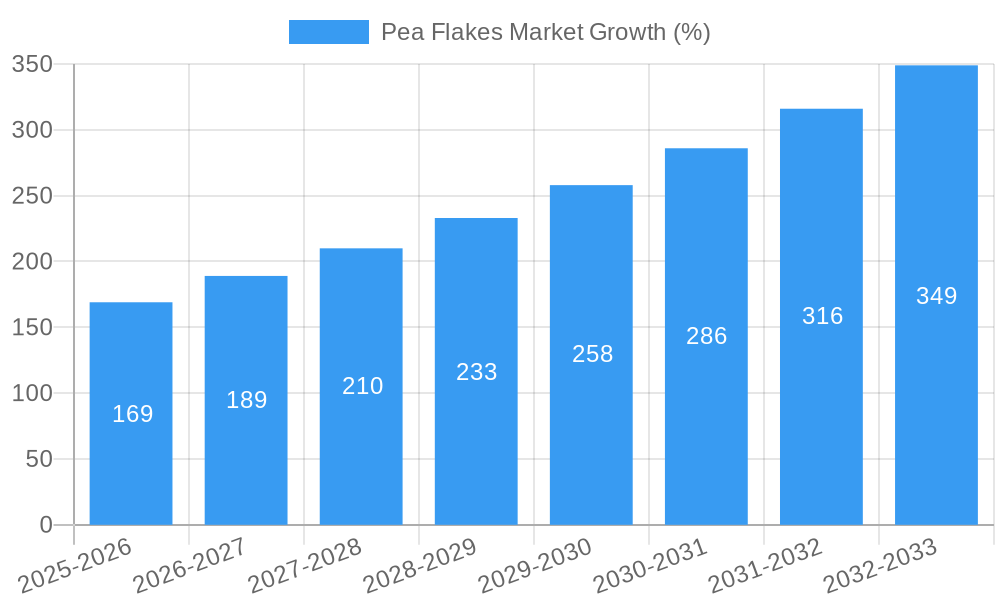
The global pea flakes market, valued at $1,788 million in 2025, is projected to experience robust growth, driven by a Compound Annual Growth Rate (CAGR) of 9.51% from 2025 to 2033. This expansion is fueled by several key factors. The increasing demand for plant-based protein sources, catering to the growing vegetarian and vegan populations, significantly boosts pea flake consumption in both processed food and animal feed applications. Health-conscious consumers are drawn to the nutritional benefits of pea flakes, including their high protein content and fiber, further stimulating market demand. The versatility of pea flakes, enabling their use in various food products like snacks, breakfast cereals, and meat alternatives, broadens the market's appeal. Furthermore, the expanding global food processing industry and the rising popularity of convenient, ready-to-eat meals contribute to increased pea flake demand. Innovation in pea flake processing technologies, leading to improved quality and extended shelf life, also positively impacts market growth. Geographical expansion into emerging markets, especially in Asia-Pacific, offers significant growth potential.
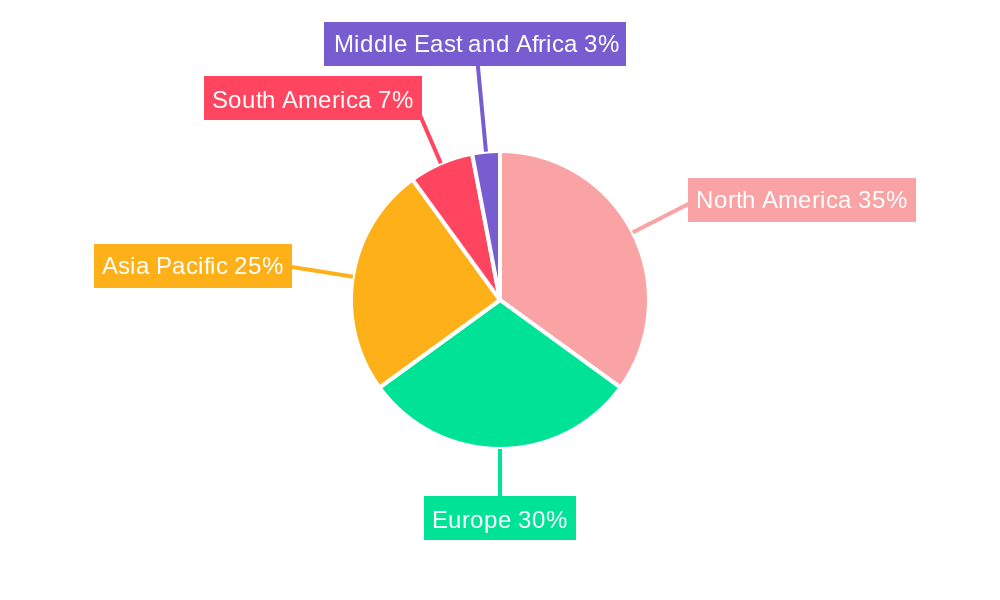
However, certain challenges exist. Price fluctuations in raw materials (peas) and potential supply chain disruptions can impact profitability. Competition from other plant-based protein sources, such as soy and lentils, poses a challenge. Maintaining consistent quality and addressing consumer concerns regarding potential allergens are crucial for sustained market growth. The market segmentation reveals that animal feed is likely a major application, with processed food and other applications holding significant, albeit potentially smaller, shares. Key players like BP Milling, Garden Valley Foods, and AGT Foods are likely to shape market dynamics through innovation, product diversification, and strategic partnerships. Regional variations are anticipated, with North America and Europe likely maintaining strong market positions, while Asia-Pacific demonstrates significant growth potential given its expanding population and increasing consumption of plant-based foods.
Pea Flakes Market: A Comprehensive Report (2019-2033)
This in-depth report provides a comprehensive analysis of the global Pea Flakes Market, offering valuable insights into market dynamics, competitive landscapes, and future growth projections from 2019 to 2033. The study covers key segments, including By Type (Green Pea, Yellow Pea), By Application (Animal Feed, Processed Food, Other Applications), and By Distribution Channel (Hypermarkets and Supermarkets, Convenience Stores, Online Stores, Other Channels), providing a granular understanding of this dynamic market. The report's detailed analysis encompasses historical data (2019-2024), base year (2025), and forecast period (2025-2033), delivering a robust foundation for strategic decision-making. The market value is presented in Millions throughout the report.
Pea Flakes Market Market Structure & Competitive Dynamics
The global pea flakes market exhibits a moderately concentrated structure, with several key players commanding significant market share. The market's competitive landscape is characterized by both established players and emerging entrants, leading to intense competition based on price, quality, and product innovation. Innovation ecosystems are developing rapidly, particularly around sustainable sourcing and processing techniques. Regulatory frameworks, while generally favorable, vary by region impacting production and labeling standards. Product substitutes, such as other legume flakes and textured vegetable proteins, pose a degree of competitive pressure. End-user trends, particularly the growing demand for plant-based foods and pet food, are major growth drivers. M&A activity has been moderate, with smaller acquisitions driving consolidation within the industry. Deal values have ranged from xx Million to xx Million in recent years. Market share estimates place the top 5 players at approximately xx% of the total market.
Pea Flakes Market Industry Trends & Insights
The global pea flakes market is experiencing robust growth, driven by several key factors. The increasing consumer preference for plant-based diets and the rising demand for sustainable and healthy food alternatives fuel this expansion. Technological advancements in pea processing, resulting in improved flake quality and production efficiency, are also significant contributors. The CAGR for the forecast period (2025-2033) is estimated at xx%, indicating substantial market expansion. Market penetration is highest in developed regions, while developing economies showcase significant growth potential. The surge in popularity of vegan and vegetarian diets directly correlates with market expansion. Competitive dynamics continue to evolve with innovation in product applications and distribution strategies. The increasing use of pea flakes in pet food is a rapidly growing niche.
Dominant Markets & Segments in Pea Flakes Market
By Type: The Green Pea segment currently holds the largest market share, driven by its superior flavor and nutritional profile compared to yellow pea flakes. This segment's projected CAGR is xx% for the forecast period.
By Application: The Animal Feed application segment dominates the market, fueled by the growing demand for plant-based pet food and livestock feed. Processed food applications are also significant, with notable growth in ready-to-eat meals and snacks incorporating pea flakes. The CAGR for the processed food segment is estimated at xx%.
By Distribution Channel: Hypermarkets and supermarkets continue to hold the largest share of distribution channels, providing widespread product availability. Online stores are showing significant growth, particularly with the rising popularity of e-commerce platforms.
Key Drivers: The strong growth in the pea flakes market is driven by factors including increasing consumer awareness of health and nutritional benefits, government initiatives supporting sustainable agriculture, and robust growth in the plant-based food sector, particularly in North America and Europe. Investment in R&D has contributed to efficient and scalable production processes.
Dominance in specific regions is largely influenced by economic policies supporting agricultural production and the established food processing infrastructure. North America and Europe currently hold the largest market share.
Pea Flakes Market Product Innovations
Recent innovations in pea flake production have focused on enhancing texture, taste, and nutritional value. New processing techniques are improving the overall quality of the flakes and expanding their application range. Manufacturers are also focusing on developing organic and non-GMO options to meet increasing consumer demand for premium ingredients. These innovations drive market growth by providing consumers with more appealing and versatile products. This includes developing pea flakes with enhanced protein content and functional properties, for use in various foods and beverages.
Report Segmentation & Scope
This report segments the pea flakes market based on type, application, and distribution channel.
By Type: The report analyzes the market size and growth projections for both Green Pea and Yellow Pea flakes, considering their respective characteristics and market applications. Competitive dynamics within each segment are assessed.
By Application: The market is segmented by Animal Feed (pet food and livestock feed), Processed Food (ready-to-eat meals, snacks, etc.), and Other Applications (e.g., bakery goods). Growth projections and market sizes for each application are provided along with details on competitive strategies within each segment.
By Distribution Channel: The analysis encompasses Hypermarkets/Supermarkets, Convenience Stores, Online Stores, and Other Channels. Growth trajectories, market sizes, and channel-specific competitive dynamics are detailed.
Key Drivers of Pea Flakes Market Growth
The growth of the pea flakes market is primarily driven by:
Rising Demand for Plant-Based Foods: The increasing adoption of vegan, vegetarian, and flexitarian diets globally is a significant driver.
Health and Wellness Trends: Consumers are increasingly seeking healthy and nutritious food options, leading to higher demand for pea flakes as a source of protein and fiber.
Technological Advancements: Improved processing techniques result in higher quality flakes with enhanced taste and texture.
Sustainable Agriculture: Growing consumer preference for sustainably sourced ingredients promotes the use of pea flakes as an environmentally friendly alternative.
Challenges in the Pea Flakes Market Sector
The pea flakes market faces several challenges:
Price Volatility of Raw Materials: Fluctuations in pea prices can impact profitability and production costs.
Supply Chain Disruptions: Global events and logistical issues can disrupt the supply chain, affecting market availability.
Competition from Substitutes: Other legume flakes and plant-based protein sources pose competitive pressures.
Regulatory Changes: Changes in food safety and labeling regulations can lead to compliance costs and market disruptions. The impact of these challenges varies geographically but can potentially reduce the overall market CAGR by approximately xx% in certain regions.
Leading Players in the Pea Flakes Market Market
- BP Milling
- Garden Valley Foods
- Gemef Industries (Sotexpro)
- Wheeeky Pets
- Dumoulin S A
- Om Foods Inc
- JR Farm
- Inland Empire Foods Inc
- Exotic Nutrition
- AGT Foods and Ingredients Inc.
Key Developments in Pea Flakes Market Sector
- 2022 Q4: AGT Foods and Ingredients Inc. announced significant investments in new pea flake processing lines, substantially increasing production capacity.
- 2023 Q1: A major collaboration between a leading pea flake manufacturer and a health food company resulted in the launch of a new line of organic pea flakes.
- 2023 Q3: Acquisition of a smaller pea flake business by a multinational food corporation consolidated market share and expanded its product portfolio.
Strategic Pea Flakes Market Market Outlook
The pea flakes market presents significant growth potential, driven by continued consumer demand for plant-based and healthy foods. Strategic opportunities lie in expanding into emerging markets, developing innovative product applications, and focusing on sustainable and ethical sourcing. Investing in research and development to improve production efficiency and expand product lines will be crucial for success. The market's growth trajectory is projected to remain robust throughout the forecast period, presenting attractive opportunities for both established players and new entrants.
Pea Flakes Market Segmentation
-
1. Type
- 1.1. Green Pea
- 1.2. Yellow Pea
-
2. Application
- 2.1. Animal Feed
- 2.2. Processed Food
- 2.3. Other Applications
-
3. Distribution Channel
- 3.1. Hypermarkets and Supermarkets
- 3.2. Convenience stores
- 3.3. Online Stores
- 3.4. Other Channels
Pea Flakes Market Segmentation By Geography
-
1. North America
- 1.1. United States
- 1.2. Canada
- 1.3. Mexico
- 1.4. Rest of North America
-
2. Europe
- 2.1. Spain
- 2.2. United Kingdom
- 2.3. Germany
- 2.4. France
- 2.5. Italy
- 2.6. Russia
- 2.7. Rest of Europe
-
3. Asia Pacific
- 3.1. China
- 3.2. Japan
- 3.3. India
- 3.4. Australia
- 3.5. Rest of Asia Pacific
-
4. South America
- 4.1. Brazil
- 4.2. Argentina
- 4.3. Rest of South America
-
5. Middle East and Africa
- 5.1. South Africa
- 5.2. Saudi Arabia
- 5.3. Rest of Middle East and Africa
Pea Flakes Market REPORT HIGHLIGHTS
| Aspects | Details |
|---|---|
| Study Period | 2019-2033 |
| Base Year | 2024 |
| Estimated Year | 2025 |
| Forecast Period | 2025-2033 |
| Historical Period | 2019-2024 |
| Growth Rate | CAGR of 9.51% from 2019-2033 |
| Segmentation |
|
Table of Contents
- 1. Introduction
- 1.1. Research Scope
- 1.2. Market Segmentation
- 1.3. Research Methodology
- 1.4. Definitions and Assumptions
- 2. Executive Summary
- 2.1. Introduction
- 3. Market Dynamics
- 3.1. Introduction
- 3.2. Market Drivers
- 3.2.1. Increasing application of Gelatin in healthcare and pharmaceutical sector
- 3.3. Market Restrains
- 3.3.1. Rising demand for clean label products
- 3.4. Market Trends
- 3.4.1. Pea Flakes find Extensive Application in Food Industry
- 4. Market Factor Analysis
- 4.1. Porters Five Forces
- 4.2. Supply/Value Chain
- 4.3. PESTEL analysis
- 4.4. Market Entropy
- 4.5. Patent/Trademark Analysis
- 5. Global Pea Flakes Market Analysis, Insights and Forecast, 2019-2031
- 5.1. Market Analysis, Insights and Forecast - by Type
- 5.1.1. Green Pea
- 5.1.2. Yellow Pea
- 5.2. Market Analysis, Insights and Forecast - by Application
- 5.2.1. Animal Feed
- 5.2.2. Processed Food
- 5.2.3. Other Applications
- 5.3. Market Analysis, Insights and Forecast - by Distribution Channel
- 5.3.1. Hypermarkets and Supermarkets
- 5.3.2. Convenience stores
- 5.3.3. Online Stores
- 5.3.4. Other Channels
- 5.4. Market Analysis, Insights and Forecast - by Region
- 5.4.1. North America
- 5.4.2. Europe
- 5.4.3. Asia Pacific
- 5.4.4. South America
- 5.4.5. Middle East and Africa
- 5.1. Market Analysis, Insights and Forecast - by Type
- 6. North America Pea Flakes Market Analysis, Insights and Forecast, 2019-2031
- 6.1. Market Analysis, Insights and Forecast - by Type
- 6.1.1. Green Pea
- 6.1.2. Yellow Pea
- 6.2. Market Analysis, Insights and Forecast - by Application
- 6.2.1. Animal Feed
- 6.2.2. Processed Food
- 6.2.3. Other Applications
- 6.3. Market Analysis, Insights and Forecast - by Distribution Channel
- 6.3.1. Hypermarkets and Supermarkets
- 6.3.2. Convenience stores
- 6.3.3. Online Stores
- 6.3.4. Other Channels
- 6.1. Market Analysis, Insights and Forecast - by Type
- 7. Europe Pea Flakes Market Analysis, Insights and Forecast, 2019-2031
- 7.1. Market Analysis, Insights and Forecast - by Type
- 7.1.1. Green Pea
- 7.1.2. Yellow Pea
- 7.2. Market Analysis, Insights and Forecast - by Application
- 7.2.1. Animal Feed
- 7.2.2. Processed Food
- 7.2.3. Other Applications
- 7.3. Market Analysis, Insights and Forecast - by Distribution Channel
- 7.3.1. Hypermarkets and Supermarkets
- 7.3.2. Convenience stores
- 7.3.3. Online Stores
- 7.3.4. Other Channels
- 7.1. Market Analysis, Insights and Forecast - by Type
- 8. Asia Pacific Pea Flakes Market Analysis, Insights and Forecast, 2019-2031
- 8.1. Market Analysis, Insights and Forecast - by Type
- 8.1.1. Green Pea
- 8.1.2. Yellow Pea
- 8.2. Market Analysis, Insights and Forecast - by Application
- 8.2.1. Animal Feed
- 8.2.2. Processed Food
- 8.2.3. Other Applications
- 8.3. Market Analysis, Insights and Forecast - by Distribution Channel
- 8.3.1. Hypermarkets and Supermarkets
- 8.3.2. Convenience stores
- 8.3.3. Online Stores
- 8.3.4. Other Channels
- 8.1. Market Analysis, Insights and Forecast - by Type
- 9. South America Pea Flakes Market Analysis, Insights and Forecast, 2019-2031
- 9.1. Market Analysis, Insights and Forecast - by Type
- 9.1.1. Green Pea
- 9.1.2. Yellow Pea
- 9.2. Market Analysis, Insights and Forecast - by Application
- 9.2.1. Animal Feed
- 9.2.2. Processed Food
- 9.2.3. Other Applications
- 9.3. Market Analysis, Insights and Forecast - by Distribution Channel
- 9.3.1. Hypermarkets and Supermarkets
- 9.3.2. Convenience stores
- 9.3.3. Online Stores
- 9.3.4. Other Channels
- 9.1. Market Analysis, Insights and Forecast - by Type
- 10. Middle East and Africa Pea Flakes Market Analysis, Insights and Forecast, 2019-2031
- 10.1. Market Analysis, Insights and Forecast - by Type
- 10.1.1. Green Pea
- 10.1.2. Yellow Pea
- 10.2. Market Analysis, Insights and Forecast - by Application
- 10.2.1. Animal Feed
- 10.2.2. Processed Food
- 10.2.3. Other Applications
- 10.3. Market Analysis, Insights and Forecast - by Distribution Channel
- 10.3.1. Hypermarkets and Supermarkets
- 10.3.2. Convenience stores
- 10.3.3. Online Stores
- 10.3.4. Other Channels
- 10.1. Market Analysis, Insights and Forecast - by Type
- 11. North America Pea Flakes Market Analysis, Insights and Forecast, 2019-2031
- 11.1. Market Analysis, Insights and Forecast - By Country/Sub-region
- 11.1.1 United States
- 11.1.2 Canada
- 11.1.3 Mexico
- 11.1.4 Rest of North America
- 12. Europe Pea Flakes Market Analysis, Insights and Forecast, 2019-2031
- 12.1. Market Analysis, Insights and Forecast - By Country/Sub-region
- 12.1.1 Spain
- 12.1.2 United Kingdom
- 12.1.3 Germany
- 12.1.4 France
- 12.1.5 Italy
- 12.1.6 Russia
- 12.1.7 Rest of Europe
- 13. Asia Pacific Pea Flakes Market Analysis, Insights and Forecast, 2019-2031
- 13.1. Market Analysis, Insights and Forecast - By Country/Sub-region
- 13.1.1 China
- 13.1.2 Japan
- 13.1.3 India
- 13.1.4 Australia
- 13.1.5 Rest of Asia Pacific
- 14. South America Pea Flakes Market Analysis, Insights and Forecast, 2019-2031
- 14.1. Market Analysis, Insights and Forecast - By Country/Sub-region
- 14.1.1 Brazil
- 14.1.2 Argentina
- 14.1.3 Rest of South America
- 15. Middle East and Africa Pea Flakes Market Analysis, Insights and Forecast, 2019-2031
- 15.1. Market Analysis, Insights and Forecast - By Country/Sub-region
- 15.1.1 South Africa
- 15.1.2 Saudi Arabia
- 15.1.3 Rest of Middle East and Africa
- 16. Competitive Analysis
- 16.1. Global Market Share Analysis 2024
- 16.2. Company Profiles
- 16.2.1 BP Milling
- 16.2.1.1. Overview
- 16.2.1.2. Products
- 16.2.1.3. SWOT Analysis
- 16.2.1.4. Recent Developments
- 16.2.1.5. Financials (Based on Availability)
- 16.2.2 Garden Valley Foods
- 16.2.2.1. Overview
- 16.2.2.2. Products
- 16.2.2.3. SWOT Analysis
- 16.2.2.4. Recent Developments
- 16.2.2.5. Financials (Based on Availability)
- 16.2.3 Gemef Industries (Sotexpro)
- 16.2.3.1. Overview
- 16.2.3.2. Products
- 16.2.3.3. SWOT Analysis
- 16.2.3.4. Recent Developments
- 16.2.3.5. Financials (Based on Availability)
- 16.2.4 Wheeeky Pets
- 16.2.4.1. Overview
- 16.2.4.2. Products
- 16.2.4.3. SWOT Analysis
- 16.2.4.4. Recent Developments
- 16.2.4.5. Financials (Based on Availability)
- 16.2.5 Dumoulin S A
- 16.2.5.1. Overview
- 16.2.5.2. Products
- 16.2.5.3. SWOT Analysis
- 16.2.5.4. Recent Developments
- 16.2.5.5. Financials (Based on Availability)
- 16.2.6 Om Foods Inc
- 16.2.6.1. Overview
- 16.2.6.2. Products
- 16.2.6.3. SWOT Analysis
- 16.2.6.4. Recent Developments
- 16.2.6.5. Financials (Based on Availability)
- 16.2.7 JR Farm
- 16.2.7.1. Overview
- 16.2.7.2. Products
- 16.2.7.3. SWOT Analysis
- 16.2.7.4. Recent Developments
- 16.2.7.5. Financials (Based on Availability)
- 16.2.8 Inland Empire Foods Inc
- 16.2.8.1. Overview
- 16.2.8.2. Products
- 16.2.8.3. SWOT Analysis
- 16.2.8.4. Recent Developments
- 16.2.8.5. Financials (Based on Availability)
- 16.2.9 Exotic Nutrition*List Not Exhaustive
- 16.2.9.1. Overview
- 16.2.9.2. Products
- 16.2.9.3. SWOT Analysis
- 16.2.9.4. Recent Developments
- 16.2.9.5. Financials (Based on Availability)
- 16.2.10 AGT Foods and Ingredients Inc.
- 16.2.10.1. Overview
- 16.2.10.2. Products
- 16.2.10.3. SWOT Analysis
- 16.2.10.4. Recent Developments
- 16.2.10.5. Financials (Based on Availability)
- 16.2.1 BP Milling
List of Figures
- Figure 1: Global Pea Flakes Market Revenue Breakdown (Million, %) by Region 2024 & 2032
- Figure 2: Global Pea Flakes Market Volume Breakdown (K Tons, %) by Region 2024 & 2032
- Figure 3: North America Pea Flakes Market Revenue (Million), by Country 2024 & 2032
- Figure 4: North America Pea Flakes Market Volume (K Tons), by Country 2024 & 2032
- Figure 5: North America Pea Flakes Market Revenue Share (%), by Country 2024 & 2032
- Figure 6: North America Pea Flakes Market Volume Share (%), by Country 2024 & 2032
- Figure 7: Europe Pea Flakes Market Revenue (Million), by Country 2024 & 2032
- Figure 8: Europe Pea Flakes Market Volume (K Tons), by Country 2024 & 2032
- Figure 9: Europe Pea Flakes Market Revenue Share (%), by Country 2024 & 2032
- Figure 10: Europe Pea Flakes Market Volume Share (%), by Country 2024 & 2032
- Figure 11: Asia Pacific Pea Flakes Market Revenue (Million), by Country 2024 & 2032
- Figure 12: Asia Pacific Pea Flakes Market Volume (K Tons), by Country 2024 & 2032
- Figure 13: Asia Pacific Pea Flakes Market Revenue Share (%), by Country 2024 & 2032
- Figure 14: Asia Pacific Pea Flakes Market Volume Share (%), by Country 2024 & 2032
- Figure 15: South America Pea Flakes Market Revenue (Million), by Country 2024 & 2032
- Figure 16: South America Pea Flakes Market Volume (K Tons), by Country 2024 & 2032
- Figure 17: South America Pea Flakes Market Revenue Share (%), by Country 2024 & 2032
- Figure 18: South America Pea Flakes Market Volume Share (%), by Country 2024 & 2032
- Figure 19: Middle East and Africa Pea Flakes Market Revenue (Million), by Country 2024 & 2032
- Figure 20: Middle East and Africa Pea Flakes Market Volume (K Tons), by Country 2024 & 2032
- Figure 21: Middle East and Africa Pea Flakes Market Revenue Share (%), by Country 2024 & 2032
- Figure 22: Middle East and Africa Pea Flakes Market Volume Share (%), by Country 2024 & 2032
- Figure 23: North America Pea Flakes Market Revenue (Million), by Type 2024 & 2032
- Figure 24: North America Pea Flakes Market Volume (K Tons), by Type 2024 & 2032
- Figure 25: North America Pea Flakes Market Revenue Share (%), by Type 2024 & 2032
- Figure 26: North America Pea Flakes Market Volume Share (%), by Type 2024 & 2032
- Figure 27: North America Pea Flakes Market Revenue (Million), by Application 2024 & 2032
- Figure 28: North America Pea Flakes Market Volume (K Tons), by Application 2024 & 2032
- Figure 29: North America Pea Flakes Market Revenue Share (%), by Application 2024 & 2032
- Figure 30: North America Pea Flakes Market Volume Share (%), by Application 2024 & 2032
- Figure 31: North America Pea Flakes Market Revenue (Million), by Distribution Channel 2024 & 2032
- Figure 32: North America Pea Flakes Market Volume (K Tons), by Distribution Channel 2024 & 2032
- Figure 33: North America Pea Flakes Market Revenue Share (%), by Distribution Channel 2024 & 2032
- Figure 34: North America Pea Flakes Market Volume Share (%), by Distribution Channel 2024 & 2032
- Figure 35: North America Pea Flakes Market Revenue (Million), by Country 2024 & 2032
- Figure 36: North America Pea Flakes Market Volume (K Tons), by Country 2024 & 2032
- Figure 37: North America Pea Flakes Market Revenue Share (%), by Country 2024 & 2032
- Figure 38: North America Pea Flakes Market Volume Share (%), by Country 2024 & 2032
- Figure 39: Europe Pea Flakes Market Revenue (Million), by Type 2024 & 2032
- Figure 40: Europe Pea Flakes Market Volume (K Tons), by Type 2024 & 2032
- Figure 41: Europe Pea Flakes Market Revenue Share (%), by Type 2024 & 2032
- Figure 42: Europe Pea Flakes Market Volume Share (%), by Type 2024 & 2032
- Figure 43: Europe Pea Flakes Market Revenue (Million), by Application 2024 & 2032
- Figure 44: Europe Pea Flakes Market Volume (K Tons), by Application 2024 & 2032
- Figure 45: Europe Pea Flakes Market Revenue Share (%), by Application 2024 & 2032
- Figure 46: Europe Pea Flakes Market Volume Share (%), by Application 2024 & 2032
- Figure 47: Europe Pea Flakes Market Revenue (Million), by Distribution Channel 2024 & 2032
- Figure 48: Europe Pea Flakes Market Volume (K Tons), by Distribution Channel 2024 & 2032
- Figure 49: Europe Pea Flakes Market Revenue Share (%), by Distribution Channel 2024 & 2032
- Figure 50: Europe Pea Flakes Market Volume Share (%), by Distribution Channel 2024 & 2032
- Figure 51: Europe Pea Flakes Market Revenue (Million), by Country 2024 & 2032
- Figure 52: Europe Pea Flakes Market Volume (K Tons), by Country 2024 & 2032
- Figure 53: Europe Pea Flakes Market Revenue Share (%), by Country 2024 & 2032
- Figure 54: Europe Pea Flakes Market Volume Share (%), by Country 2024 & 2032
- Figure 55: Asia Pacific Pea Flakes Market Revenue (Million), by Type 2024 & 2032
- Figure 56: Asia Pacific Pea Flakes Market Volume (K Tons), by Type 2024 & 2032
- Figure 57: Asia Pacific Pea Flakes Market Revenue Share (%), by Type 2024 & 2032
- Figure 58: Asia Pacific Pea Flakes Market Volume Share (%), by Type 2024 & 2032
- Figure 59: Asia Pacific Pea Flakes Market Revenue (Million), by Application 2024 & 2032
- Figure 60: Asia Pacific Pea Flakes Market Volume (K Tons), by Application 2024 & 2032
- Figure 61: Asia Pacific Pea Flakes Market Revenue Share (%), by Application 2024 & 2032
- Figure 62: Asia Pacific Pea Flakes Market Volume Share (%), by Application 2024 & 2032
- Figure 63: Asia Pacific Pea Flakes Market Revenue (Million), by Distribution Channel 2024 & 2032
- Figure 64: Asia Pacific Pea Flakes Market Volume (K Tons), by Distribution Channel 2024 & 2032
- Figure 65: Asia Pacific Pea Flakes Market Revenue Share (%), by Distribution Channel 2024 & 2032
- Figure 66: Asia Pacific Pea Flakes Market Volume Share (%), by Distribution Channel 2024 & 2032
- Figure 67: Asia Pacific Pea Flakes Market Revenue (Million), by Country 2024 & 2032
- Figure 68: Asia Pacific Pea Flakes Market Volume (K Tons), by Country 2024 & 2032
- Figure 69: Asia Pacific Pea Flakes Market Revenue Share (%), by Country 2024 & 2032
- Figure 70: Asia Pacific Pea Flakes Market Volume Share (%), by Country 2024 & 2032
- Figure 71: South America Pea Flakes Market Revenue (Million), by Type 2024 & 2032
- Figure 72: South America Pea Flakes Market Volume (K Tons), by Type 2024 & 2032
- Figure 73: South America Pea Flakes Market Revenue Share (%), by Type 2024 & 2032
- Figure 74: South America Pea Flakes Market Volume Share (%), by Type 2024 & 2032
- Figure 75: South America Pea Flakes Market Revenue (Million), by Application 2024 & 2032
- Figure 76: South America Pea Flakes Market Volume (K Tons), by Application 2024 & 2032
- Figure 77: South America Pea Flakes Market Revenue Share (%), by Application 2024 & 2032
- Figure 78: South America Pea Flakes Market Volume Share (%), by Application 2024 & 2032
- Figure 79: South America Pea Flakes Market Revenue (Million), by Distribution Channel 2024 & 2032
- Figure 80: South America Pea Flakes Market Volume (K Tons), by Distribution Channel 2024 & 2032
- Figure 81: South America Pea Flakes Market Revenue Share (%), by Distribution Channel 2024 & 2032
- Figure 82: South America Pea Flakes Market Volume Share (%), by Distribution Channel 2024 & 2032
- Figure 83: South America Pea Flakes Market Revenue (Million), by Country 2024 & 2032
- Figure 84: South America Pea Flakes Market Volume (K Tons), by Country 2024 & 2032
- Figure 85: South America Pea Flakes Market Revenue Share (%), by Country 2024 & 2032
- Figure 86: South America Pea Flakes Market Volume Share (%), by Country 2024 & 2032
- Figure 87: Middle East and Africa Pea Flakes Market Revenue (Million), by Type 2024 & 2032
- Figure 88: Middle East and Africa Pea Flakes Market Volume (K Tons), by Type 2024 & 2032
- Figure 89: Middle East and Africa Pea Flakes Market Revenue Share (%), by Type 2024 & 2032
- Figure 90: Middle East and Africa Pea Flakes Market Volume Share (%), by Type 2024 & 2032
- Figure 91: Middle East and Africa Pea Flakes Market Revenue (Million), by Application 2024 & 2032
- Figure 92: Middle East and Africa Pea Flakes Market Volume (K Tons), by Application 2024 & 2032
- Figure 93: Middle East and Africa Pea Flakes Market Revenue Share (%), by Application 2024 & 2032
- Figure 94: Middle East and Africa Pea Flakes Market Volume Share (%), by Application 2024 & 2032
- Figure 95: Middle East and Africa Pea Flakes Market Revenue (Million), by Distribution Channel 2024 & 2032
- Figure 96: Middle East and Africa Pea Flakes Market Volume (K Tons), by Distribution Channel 2024 & 2032
- Figure 97: Middle East and Africa Pea Flakes Market Revenue Share (%), by Distribution Channel 2024 & 2032
- Figure 98: Middle East and Africa Pea Flakes Market Volume Share (%), by Distribution Channel 2024 & 2032
- Figure 99: Middle East and Africa Pea Flakes Market Revenue (Million), by Country 2024 & 2032
- Figure 100: Middle East and Africa Pea Flakes Market Volume (K Tons), by Country 2024 & 2032
- Figure 101: Middle East and Africa Pea Flakes Market Revenue Share (%), by Country 2024 & 2032
- Figure 102: Middle East and Africa Pea Flakes Market Volume Share (%), by Country 2024 & 2032
List of Tables
- Table 1: Global Pea Flakes Market Revenue Million Forecast, by Region 2019 & 2032
- Table 2: Global Pea Flakes Market Volume K Tons Forecast, by Region 2019 & 2032
- Table 3: Global Pea Flakes Market Revenue Million Forecast, by Type 2019 & 2032
- Table 4: Global Pea Flakes Market Volume K Tons Forecast, by Type 2019 & 2032
- Table 5: Global Pea Flakes Market Revenue Million Forecast, by Application 2019 & 2032
- Table 6: Global Pea Flakes Market Volume K Tons Forecast, by Application 2019 & 2032
- Table 7: Global Pea Flakes Market Revenue Million Forecast, by Distribution Channel 2019 & 2032
- Table 8: Global Pea Flakes Market Volume K Tons Forecast, by Distribution Channel 2019 & 2032
- Table 9: Global Pea Flakes Market Revenue Million Forecast, by Region 2019 & 2032
- Table 10: Global Pea Flakes Market Volume K Tons Forecast, by Region 2019 & 2032
- Table 11: Global Pea Flakes Market Revenue Million Forecast, by Country 2019 & 2032
- Table 12: Global Pea Flakes Market Volume K Tons Forecast, by Country 2019 & 2032
- Table 13: United States Pea Flakes Market Revenue (Million) Forecast, by Application 2019 & 2032
- Table 14: United States Pea Flakes Market Volume (K Tons) Forecast, by Application 2019 & 2032
- Table 15: Canada Pea Flakes Market Revenue (Million) Forecast, by Application 2019 & 2032
- Table 16: Canada Pea Flakes Market Volume (K Tons) Forecast, by Application 2019 & 2032
- Table 17: Mexico Pea Flakes Market Revenue (Million) Forecast, by Application 2019 & 2032
- Table 18: Mexico Pea Flakes Market Volume (K Tons) Forecast, by Application 2019 & 2032
- Table 19: Rest of North America Pea Flakes Market Revenue (Million) Forecast, by Application 2019 & 2032
- Table 20: Rest of North America Pea Flakes Market Volume (K Tons) Forecast, by Application 2019 & 2032
- Table 21: Global Pea Flakes Market Revenue Million Forecast, by Country 2019 & 2032
- Table 22: Global Pea Flakes Market Volume K Tons Forecast, by Country 2019 & 2032
- Table 23: Spain Pea Flakes Market Revenue (Million) Forecast, by Application 2019 & 2032
- Table 24: Spain Pea Flakes Market Volume (K Tons) Forecast, by Application 2019 & 2032
- Table 25: United Kingdom Pea Flakes Market Revenue (Million) Forecast, by Application 2019 & 2032
- Table 26: United Kingdom Pea Flakes Market Volume (K Tons) Forecast, by Application 2019 & 2032
- Table 27: Germany Pea Flakes Market Revenue (Million) Forecast, by Application 2019 & 2032
- Table 28: Germany Pea Flakes Market Volume (K Tons) Forecast, by Application 2019 & 2032
- Table 29: France Pea Flakes Market Revenue (Million) Forecast, by Application 2019 & 2032
- Table 30: France Pea Flakes Market Volume (K Tons) Forecast, by Application 2019 & 2032
- Table 31: Italy Pea Flakes Market Revenue (Million) Forecast, by Application 2019 & 2032
- Table 32: Italy Pea Flakes Market Volume (K Tons) Forecast, by Application 2019 & 2032
- Table 33: Russia Pea Flakes Market Revenue (Million) Forecast, by Application 2019 & 2032
- Table 34: Russia Pea Flakes Market Volume (K Tons) Forecast, by Application 2019 & 2032
- Table 35: Rest of Europe Pea Flakes Market Revenue (Million) Forecast, by Application 2019 & 2032
- Table 36: Rest of Europe Pea Flakes Market Volume (K Tons) Forecast, by Application 2019 & 2032
- Table 37: Global Pea Flakes Market Revenue Million Forecast, by Country 2019 & 2032
- Table 38: Global Pea Flakes Market Volume K Tons Forecast, by Country 2019 & 2032
- Table 39: China Pea Flakes Market Revenue (Million) Forecast, by Application 2019 & 2032
- Table 40: China Pea Flakes Market Volume (K Tons) Forecast, by Application 2019 & 2032
- Table 41: Japan Pea Flakes Market Revenue (Million) Forecast, by Application 2019 & 2032
- Table 42: Japan Pea Flakes Market Volume (K Tons) Forecast, by Application 2019 & 2032
- Table 43: India Pea Flakes Market Revenue (Million) Forecast, by Application 2019 & 2032
- Table 44: India Pea Flakes Market Volume (K Tons) Forecast, by Application 2019 & 2032
- Table 45: Australia Pea Flakes Market Revenue (Million) Forecast, by Application 2019 & 2032
- Table 46: Australia Pea Flakes Market Volume (K Tons) Forecast, by Application 2019 & 2032
- Table 47: Rest of Asia Pacific Pea Flakes Market Revenue (Million) Forecast, by Application 2019 & 2032
- Table 48: Rest of Asia Pacific Pea Flakes Market Volume (K Tons) Forecast, by Application 2019 & 2032
- Table 49: Global Pea Flakes Market Revenue Million Forecast, by Country 2019 & 2032
- Table 50: Global Pea Flakes Market Volume K Tons Forecast, by Country 2019 & 2032
- Table 51: Brazil Pea Flakes Market Revenue (Million) Forecast, by Application 2019 & 2032
- Table 52: Brazil Pea Flakes Market Volume (K Tons) Forecast, by Application 2019 & 2032
- Table 53: Argentina Pea Flakes Market Revenue (Million) Forecast, by Application 2019 & 2032
- Table 54: Argentina Pea Flakes Market Volume (K Tons) Forecast, by Application 2019 & 2032
- Table 55: Rest of South America Pea Flakes Market Revenue (Million) Forecast, by Application 2019 & 2032
- Table 56: Rest of South America Pea Flakes Market Volume (K Tons) Forecast, by Application 2019 & 2032
- Table 57: Global Pea Flakes Market Revenue Million Forecast, by Country 2019 & 2032
- Table 58: Global Pea Flakes Market Volume K Tons Forecast, by Country 2019 & 2032
- Table 59: South Africa Pea Flakes Market Revenue (Million) Forecast, by Application 2019 & 2032
- Table 60: South Africa Pea Flakes Market Volume (K Tons) Forecast, by Application 2019 & 2032
- Table 61: Saudi Arabia Pea Flakes Market Revenue (Million) Forecast, by Application 2019 & 2032
- Table 62: Saudi Arabia Pea Flakes Market Volume (K Tons) Forecast, by Application 2019 & 2032
- Table 63: Rest of Middle East and Africa Pea Flakes Market Revenue (Million) Forecast, by Application 2019 & 2032
- Table 64: Rest of Middle East and Africa Pea Flakes Market Volume (K Tons) Forecast, by Application 2019 & 2032
- Table 65: Global Pea Flakes Market Revenue Million Forecast, by Type 2019 & 2032
- Table 66: Global Pea Flakes Market Volume K Tons Forecast, by Type 2019 & 2032
- Table 67: Global Pea Flakes Market Revenue Million Forecast, by Application 2019 & 2032
- Table 68: Global Pea Flakes Market Volume K Tons Forecast, by Application 2019 & 2032
- Table 69: Global Pea Flakes Market Revenue Million Forecast, by Distribution Channel 2019 & 2032
- Table 70: Global Pea Flakes Market Volume K Tons Forecast, by Distribution Channel 2019 & 2032
- Table 71: Global Pea Flakes Market Revenue Million Forecast, by Country 2019 & 2032
- Table 72: Global Pea Flakes Market Volume K Tons Forecast, by Country 2019 & 2032
- Table 73: United States Pea Flakes Market Revenue (Million) Forecast, by Application 2019 & 2032
- Table 74: United States Pea Flakes Market Volume (K Tons) Forecast, by Application 2019 & 2032
- Table 75: Canada Pea Flakes Market Revenue (Million) Forecast, by Application 2019 & 2032
- Table 76: Canada Pea Flakes Market Volume (K Tons) Forecast, by Application 2019 & 2032
- Table 77: Mexico Pea Flakes Market Revenue (Million) Forecast, by Application 2019 & 2032
- Table 78: Mexico Pea Flakes Market Volume (K Tons) Forecast, by Application 2019 & 2032
- Table 79: Rest of North America Pea Flakes Market Revenue (Million) Forecast, by Application 2019 & 2032
- Table 80: Rest of North America Pea Flakes Market Volume (K Tons) Forecast, by Application 2019 & 2032
- Table 81: Global Pea Flakes Market Revenue Million Forecast, by Type 2019 & 2032
- Table 82: Global Pea Flakes Market Volume K Tons Forecast, by Type 2019 & 2032
- Table 83: Global Pea Flakes Market Revenue Million Forecast, by Application 2019 & 2032
- Table 84: Global Pea Flakes Market Volume K Tons Forecast, by Application 2019 & 2032
- Table 85: Global Pea Flakes Market Revenue Million Forecast, by Distribution Channel 2019 & 2032
- Table 86: Global Pea Flakes Market Volume K Tons Forecast, by Distribution Channel 2019 & 2032
- Table 87: Global Pea Flakes Market Revenue Million Forecast, by Country 2019 & 2032
- Table 88: Global Pea Flakes Market Volume K Tons Forecast, by Country 2019 & 2032
- Table 89: Spain Pea Flakes Market Revenue (Million) Forecast, by Application 2019 & 2032
- Table 90: Spain Pea Flakes Market Volume (K Tons) Forecast, by Application 2019 & 2032
- Table 91: United Kingdom Pea Flakes Market Revenue (Million) Forecast, by Application 2019 & 2032
- Table 92: United Kingdom Pea Flakes Market Volume (K Tons) Forecast, by Application 2019 & 2032
- Table 93: Germany Pea Flakes Market Revenue (Million) Forecast, by Application 2019 & 2032
- Table 94: Germany Pea Flakes Market Volume (K Tons) Forecast, by Application 2019 & 2032
- Table 95: France Pea Flakes Market Revenue (Million) Forecast, by Application 2019 & 2032
- Table 96: France Pea Flakes Market Volume (K Tons) Forecast, by Application 2019 & 2032
- Table 97: Italy Pea Flakes Market Revenue (Million) Forecast, by Application 2019 & 2032
- Table 98: Italy Pea Flakes Market Volume (K Tons) Forecast, by Application 2019 & 2032
- Table 99: Russia Pea Flakes Market Revenue (Million) Forecast, by Application 2019 & 2032
- Table 100: Russia Pea Flakes Market Volume (K Tons) Forecast, by Application 2019 & 2032
- Table 101: Rest of Europe Pea Flakes Market Revenue (Million) Forecast, by Application 2019 & 2032
- Table 102: Rest of Europe Pea Flakes Market Volume (K Tons) Forecast, by Application 2019 & 2032
- Table 103: Global Pea Flakes Market Revenue Million Forecast, by Type 2019 & 2032
- Table 104: Global Pea Flakes Market Volume K Tons Forecast, by Type 2019 & 2032
- Table 105: Global Pea Flakes Market Revenue Million Forecast, by Application 2019 & 2032
- Table 106: Global Pea Flakes Market Volume K Tons Forecast, by Application 2019 & 2032
- Table 107: Global Pea Flakes Market Revenue Million Forecast, by Distribution Channel 2019 & 2032
- Table 108: Global Pea Flakes Market Volume K Tons Forecast, by Distribution Channel 2019 & 2032
- Table 109: Global Pea Flakes Market Revenue Million Forecast, by Country 2019 & 2032
- Table 110: Global Pea Flakes Market Volume K Tons Forecast, by Country 2019 & 2032
- Table 111: China Pea Flakes Market Revenue (Million) Forecast, by Application 2019 & 2032
- Table 112: China Pea Flakes Market Volume (K Tons) Forecast, by Application 2019 & 2032
- Table 113: Japan Pea Flakes Market Revenue (Million) Forecast, by Application 2019 & 2032
- Table 114: Japan Pea Flakes Market Volume (K Tons) Forecast, by Application 2019 & 2032
- Table 115: India Pea Flakes Market Revenue (Million) Forecast, by Application 2019 & 2032
- Table 116: India Pea Flakes Market Volume (K Tons) Forecast, by Application 2019 & 2032
- Table 117: Australia Pea Flakes Market Revenue (Million) Forecast, by Application 2019 & 2032
- Table 118: Australia Pea Flakes Market Volume (K Tons) Forecast, by Application 2019 & 2032
- Table 119: Rest of Asia Pacific Pea Flakes Market Revenue (Million) Forecast, by Application 2019 & 2032
- Table 120: Rest of Asia Pacific Pea Flakes Market Volume (K Tons) Forecast, by Application 2019 & 2032
- Table 121: Global Pea Flakes Market Revenue Million Forecast, by Type 2019 & 2032
- Table 122: Global Pea Flakes Market Volume K Tons Forecast, by Type 2019 & 2032
- Table 123: Global Pea Flakes Market Revenue Million Forecast, by Application 2019 & 2032
- Table 124: Global Pea Flakes Market Volume K Tons Forecast, by Application 2019 & 2032
- Table 125: Global Pea Flakes Market Revenue Million Forecast, by Distribution Channel 2019 & 2032
- Table 126: Global Pea Flakes Market Volume K Tons Forecast, by Distribution Channel 2019 & 2032
- Table 127: Global Pea Flakes Market Revenue Million Forecast, by Country 2019 & 2032
- Table 128: Global Pea Flakes Market Volume K Tons Forecast, by Country 2019 & 2032
- Table 129: Brazil Pea Flakes Market Revenue (Million) Forecast, by Application 2019 & 2032
- Table 130: Brazil Pea Flakes Market Volume (K Tons) Forecast, by Application 2019 & 2032
- Table 131: Argentina Pea Flakes Market Revenue (Million) Forecast, by Application 2019 & 2032
- Table 132: Argentina Pea Flakes Market Volume (K Tons) Forecast, by Application 2019 & 2032
- Table 133: Rest of South America Pea Flakes Market Revenue (Million) Forecast, by Application 2019 & 2032
- Table 134: Rest of South America Pea Flakes Market Volume (K Tons) Forecast, by Application 2019 & 2032
- Table 135: Global Pea Flakes Market Revenue Million Forecast, by Type 2019 & 2032
- Table 136: Global Pea Flakes Market Volume K Tons Forecast, by Type 2019 & 2032
- Table 137: Global Pea Flakes Market Revenue Million Forecast, by Application 2019 & 2032
- Table 138: Global Pea Flakes Market Volume K Tons Forecast, by Application 2019 & 2032
- Table 139: Global Pea Flakes Market Revenue Million Forecast, by Distribution Channel 2019 & 2032
- Table 140: Global Pea Flakes Market Volume K Tons Forecast, by Distribution Channel 2019 & 2032
- Table 141: Global Pea Flakes Market Revenue Million Forecast, by Country 2019 & 2032
- Table 142: Global Pea Flakes Market Volume K Tons Forecast, by Country 2019 & 2032
- Table 143: South Africa Pea Flakes Market Revenue (Million) Forecast, by Application 2019 & 2032
- Table 144: South Africa Pea Flakes Market Volume (K Tons) Forecast, by Application 2019 & 2032
- Table 145: Saudi Arabia Pea Flakes Market Revenue (Million) Forecast, by Application 2019 & 2032
- Table 146: Saudi Arabia Pea Flakes Market Volume (K Tons) Forecast, by Application 2019 & 2032
- Table 147: Rest of Middle East and Africa Pea Flakes Market Revenue (Million) Forecast, by Application 2019 & 2032
- Table 148: Rest of Middle East and Africa Pea Flakes Market Volume (K Tons) Forecast, by Application 2019 & 2032
Frequently Asked Questions
1. What is the projected Compound Annual Growth Rate (CAGR) of the Pea Flakes Market?
The projected CAGR is approximately 9.51%.
2. Which companies are prominent players in the Pea Flakes Market?
Key companies in the market include BP Milling, Garden Valley Foods, Gemef Industries (Sotexpro), Wheeeky Pets, Dumoulin S A, Om Foods Inc, JR Farm, Inland Empire Foods Inc, Exotic Nutrition*List Not Exhaustive, AGT Foods and Ingredients Inc..
3. What are the main segments of the Pea Flakes Market?
The market segments include Type, Application, Distribution Channel.
4. Can you provide details about the market size?
The market size is estimated to be USD 1,788 Million as of 2022.
5. What are some drivers contributing to market growth?
Increasing application of Gelatin in healthcare and pharmaceutical sector.
6. What are the notable trends driving market growth?
Pea Flakes find Extensive Application in Food Industry.
7. Are there any restraints impacting market growth?
Rising demand for clean label products.
8. Can you provide examples of recent developments in the market?
New pea flake processing lines for increased production capacity
9. What pricing options are available for accessing the report?
Pricing options include single-user, multi-user, and enterprise licenses priced at USD 4750, USD 5250, and USD 8750 respectively.
10. Is the market size provided in terms of value or volume?
The market size is provided in terms of value, measured in Million and volume, measured in K Tons.
11. Are there any specific market keywords associated with the report?
Yes, the market keyword associated with the report is "Pea Flakes Market," which aids in identifying and referencing the specific market segment covered.
12. How do I determine which pricing option suits my needs best?
The pricing options vary based on user requirements and access needs. Individual users may opt for single-user licenses, while businesses requiring broader access may choose multi-user or enterprise licenses for cost-effective access to the report.
13. Are there any additional resources or data provided in the Pea Flakes Market report?
While the report offers comprehensive insights, it's advisable to review the specific contents or supplementary materials provided to ascertain if additional resources or data are available.
14. How can I stay updated on further developments or reports in the Pea Flakes Market?
To stay informed about further developments, trends, and reports in the Pea Flakes Market, consider subscribing to industry newsletters, following relevant companies and organizations, or regularly checking reputable industry news sources and publications.
Methodology
Step 1 - Identification of Relevant Samples Size from Population Database


Step 2 - Approaches for Defining Global Market Size (Value, Volume* & Price*)

Note*: In applicable scenarios
Step 3 - Data Sources
Primary Research
- Web Analytics
- Survey Reports
- Research Institute
- Latest Research Reports
- Opinion Leaders
Secondary Research
- Annual Reports
- White Paper
- Latest Press Release
- Industry Association
- Paid Database
- Investor Presentations

Step 4 - Data Triangulation
Involves using different sources of information in order to increase the validity of a study
These sources are likely to be stakeholders in a program - participants, other researchers, program staff, other community members, and so on.
Then we put all data in single framework & apply various statistical tools to find out the dynamic on the market.
During the analysis stage, feedback from the stakeholder groups would be compared to determine areas of agreement as well as areas of divergence


